
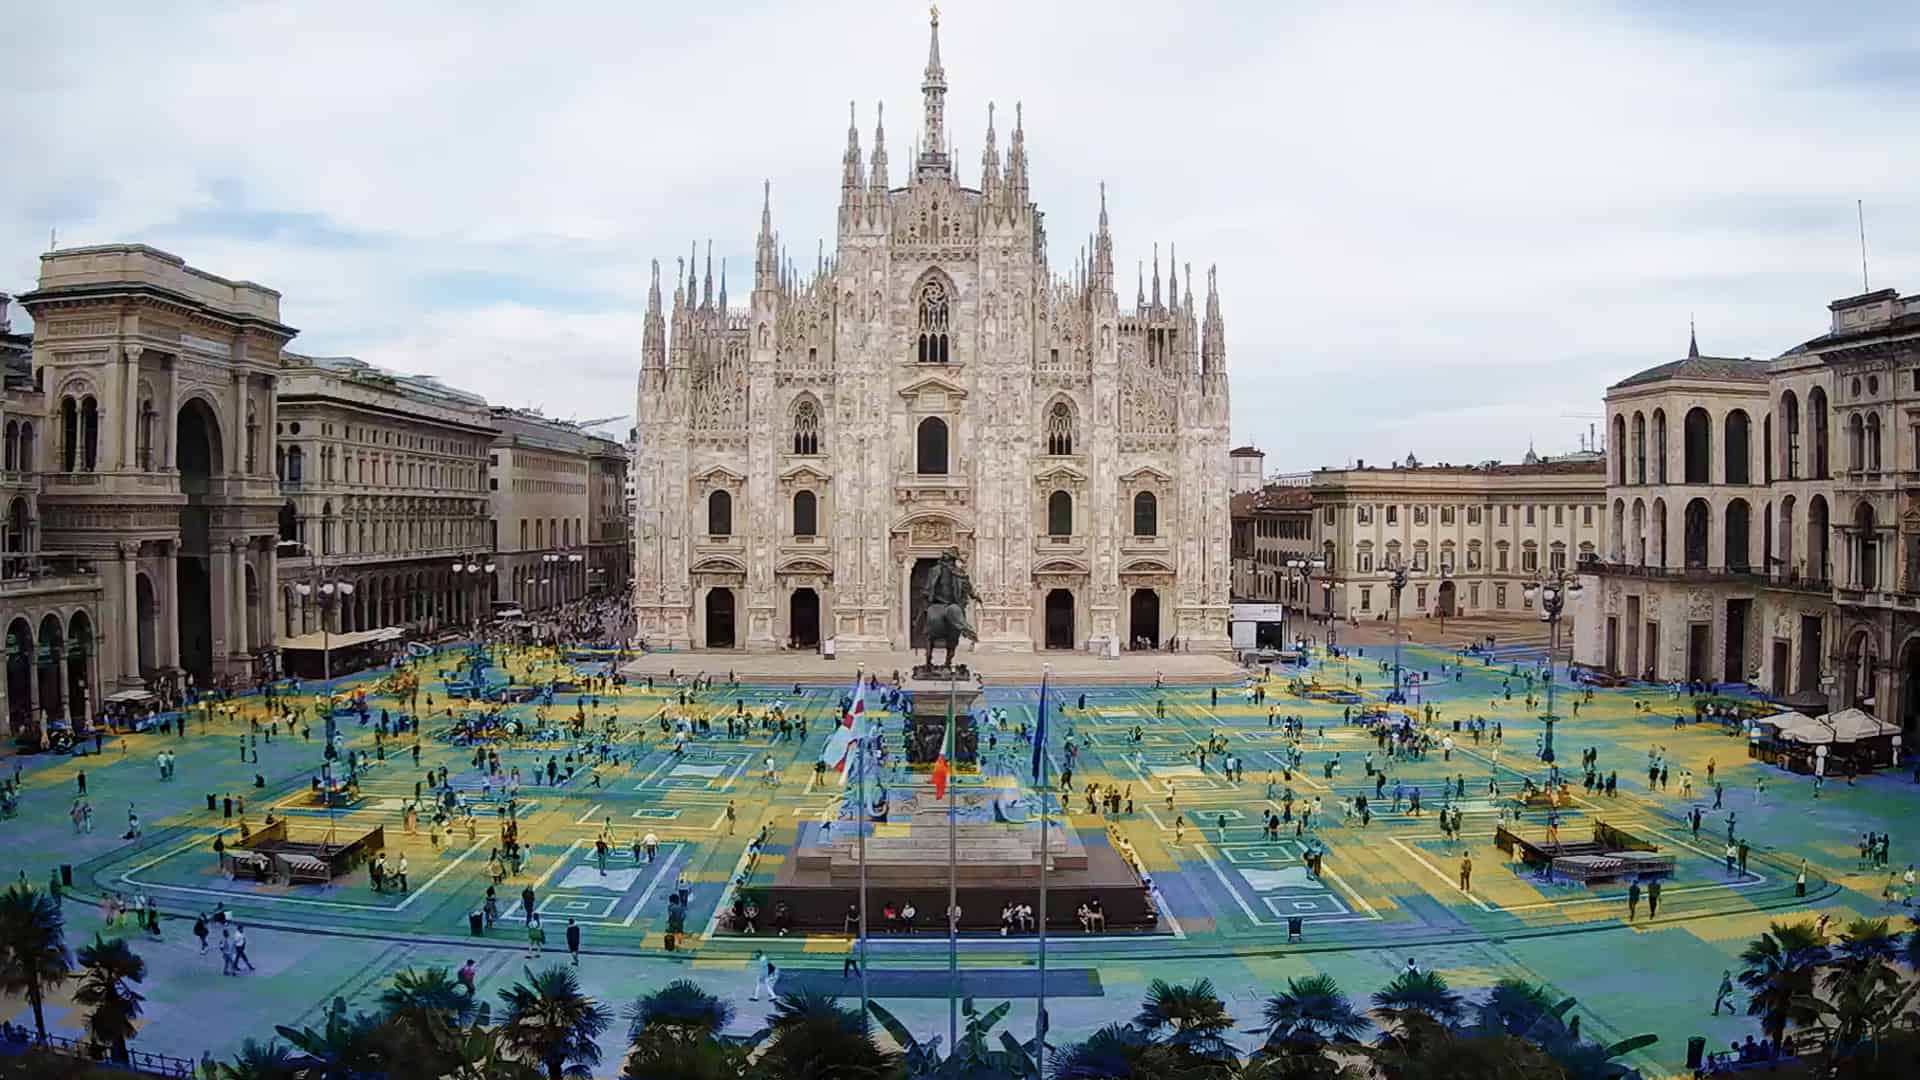
Since the introduction of the Social Logic of Space (Hillier and Hanson, 1984) and the further developments of Space Syntax theories during the following decades (Hillier et al., 1996; Hillier, 2007), the proposed methodologies have been proven effective to analyze the space in his physical configuration. In this regard, the study proposes the application of Visibility Graph Analysis (VGA) measures to Piazza Duomo, one of the busiest public squares in Milan, Italy. These metrics were tested in relation to the pedestrian movements measured through remote sensing technologies. Deep-learning video-analytics methods were used to detect the pedestrian occupancy in five different moments of the day (see Figure 1). Detections were then reprojected on the plane to obtain the spatial utilization, discretized on the grid used to calculate the VGA metrics. Then, a series of correlation analyses tested the grid-based analyses against the cumulated footfall and a movement metric. The results show how the correlation between the VGA measures and the pedestrian movements varies greatly at different radii, considered through the variation of the restricted visibility parameter, ranging from negative weak correlations to positive moderate correlations for the cumulative density, and from positive moderate correlations to weak correlations for the turnover metric. The results, in line with other recent research works, shows how pure VGA measures can only partially describe an open public space, posing an interesting step in the direction of future works, aimed at the development of a more complex model based on the Space Syntax theories.
Literature Review
Space Syntax theories have been tested since their introduction in the effort to correlate the syntactic measures with empirical evidence, such as the recorded flows of pedestrians or vehicles. In the case of the Grid-based analysis (i.e., VGA), the metrics were tested in various settings. In one of the most notable example, an urban environment case study is represented by the experiments made on the Barnsbury area in London (Turner, 2003), based on 116 gate counted pedestrian movements. More recently, a building-based case study is used as setting for an occupancy analysis in an educational building (Tomé et al., 2015). In this case, video analytics is used to identify moving and standing individuals, to analyze the utilization patterns of the space.
Empirical pedestrian gathering techniques can be divided in two main categories: automatic and manual systems (Conroy, 2001). Both can rely on sensing technologies to quantify space utilization, as outlined in Table 1 (van Nes et al., 2021). Among them, videos represent the most versatile mean of gathering, as they can be mounted at a fixed location (i.e., snapshots, general movement traces, gate counts, mean occupancy), or mobile (i.e., pedestrian following).
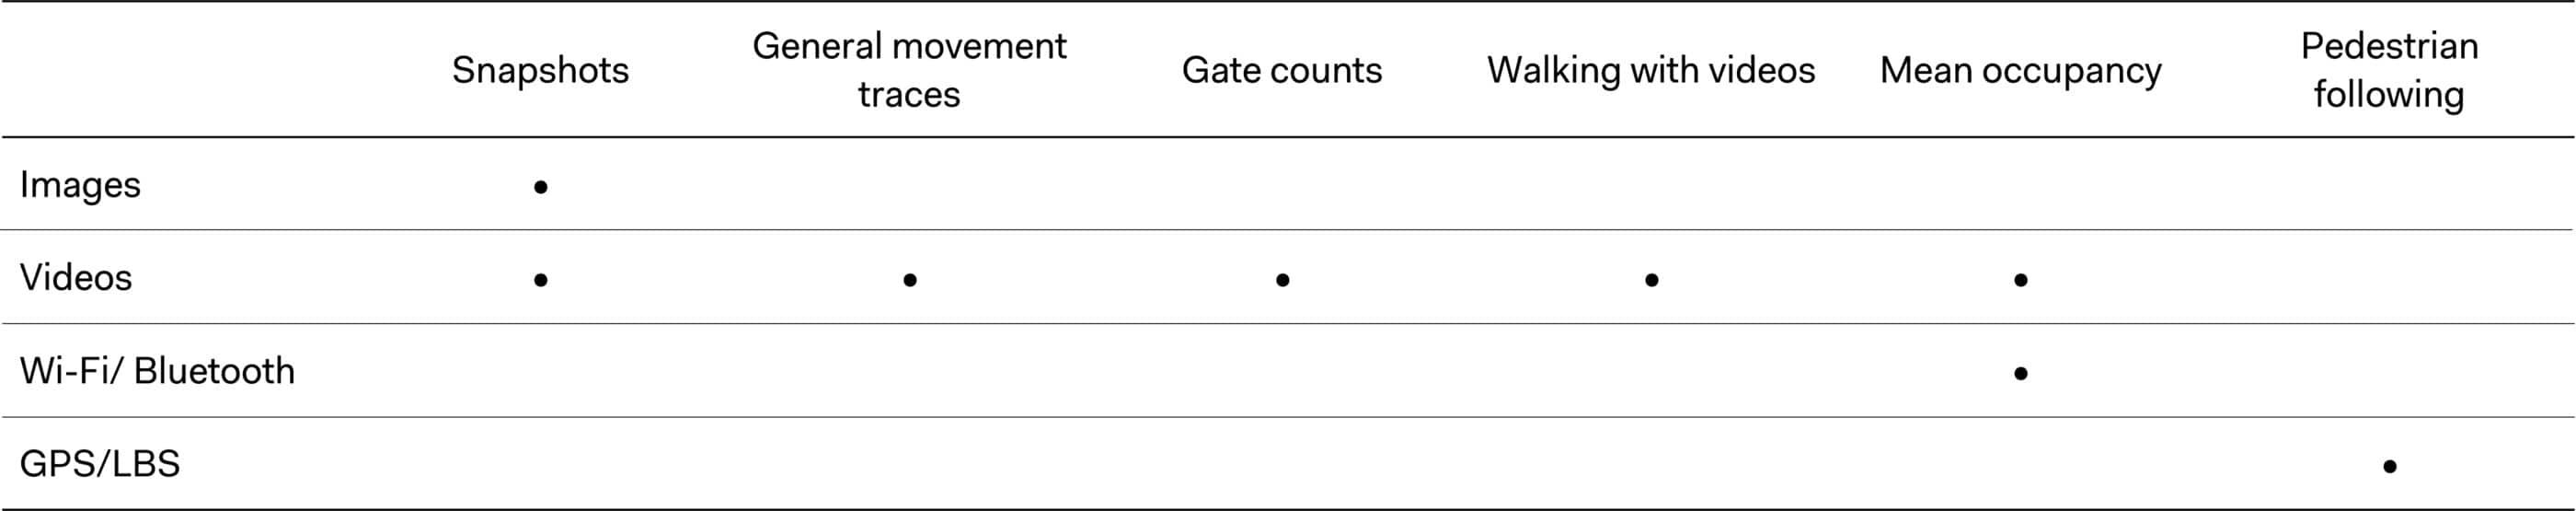
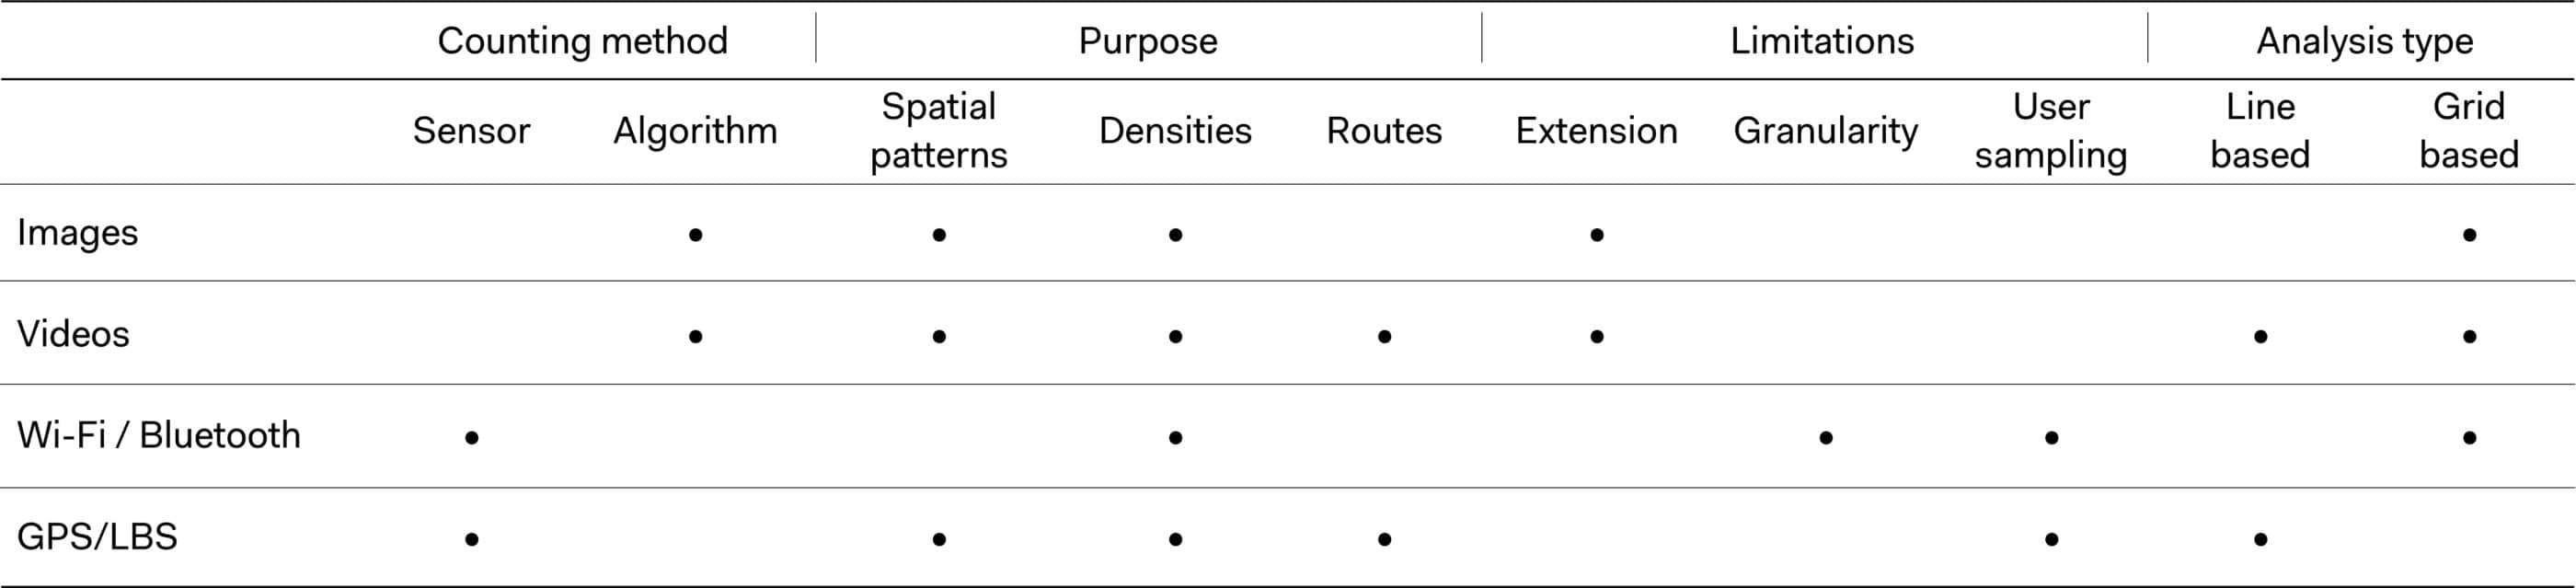
Table 2 classifies the technologies presented in Table 1 based on automatic data counting methodologies, purposes and limitations and Space Syntax analyses typologies. Data counting methodologies can be divided in two categories:
- Algorithm-based counting methods, namely those that rely on additional analyses to retrieve data (i.e., images, videos);
- Sensor-based counting methods, which depend on the technology embedded in the sensor to retrieve data (i.e., Wi-Fi, Bluetooth, GPS/ LBS technologies).
The analysis purposes categorization, see Table 2, is structured in three groups, enabling the study of:
- Spatial patterns, pedestrian behaviors, and movements in an area (e.g., grouping, sitting, etc.);
- Densities and the quantification of the footfall around hotspots;
- Routes and the analysis of routing preferences (e.g., most walked paths, etc.).
Limitations of sensors can be classified as:
- The analysis is restricted to a limited area, as for images and videos (i.e. extension);
- The analysis is restricted to a limited number of people, as for Wi-Fi, Bluetooth, GPS technologies (i.e., users).
Lastly, the sensors are classified based on which Space Syntax analyses can be linked to them:
- Line-based analyses relate to route preferences and traces (e.g., videos, GPS/LBS);
- Grid-based analyses mainly relate to densities and patterns (e.g., images, videos, Wi-Fi, Bluetooth).
Methodology
Case study definition and VGA metrics selection
Piazza Duomo (Milan, Italy), is chosen as a case study as it is structured as a pedestrian space, interrupted by a limited number of elements, as the subway entrances. In the analyses, the square is studied together with the area surrounding it, with a buffer of 250 meters from the center of the square, to create an uninterrupted linear system. The drawing used in Depthmap is obtained from a collection of open geodata, which have been enriched to include pedestrian spaces not visible from satellite. Figure 2 shows the extent of the pedestrian are considered for the analysis.
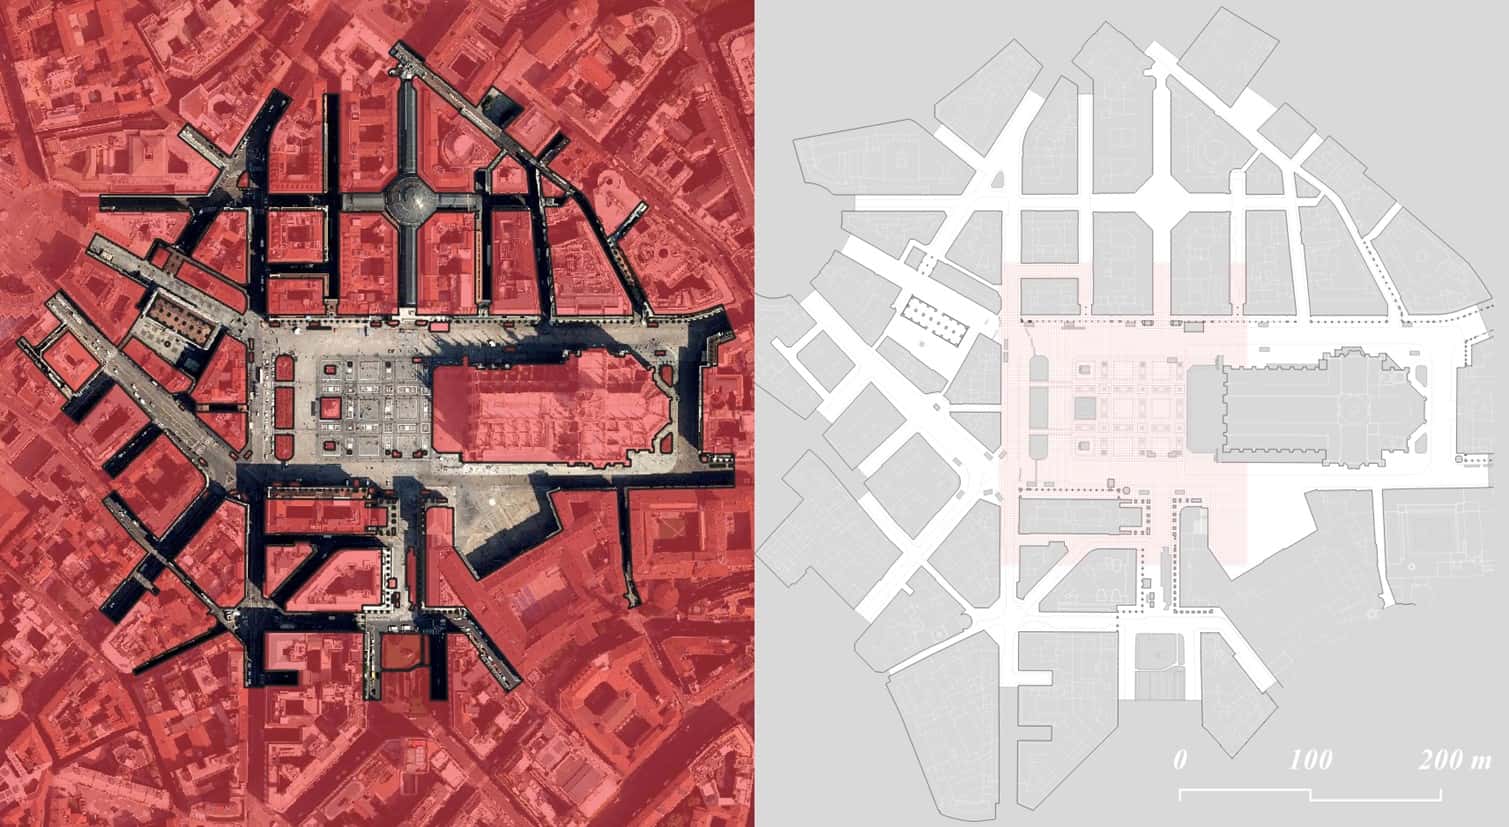
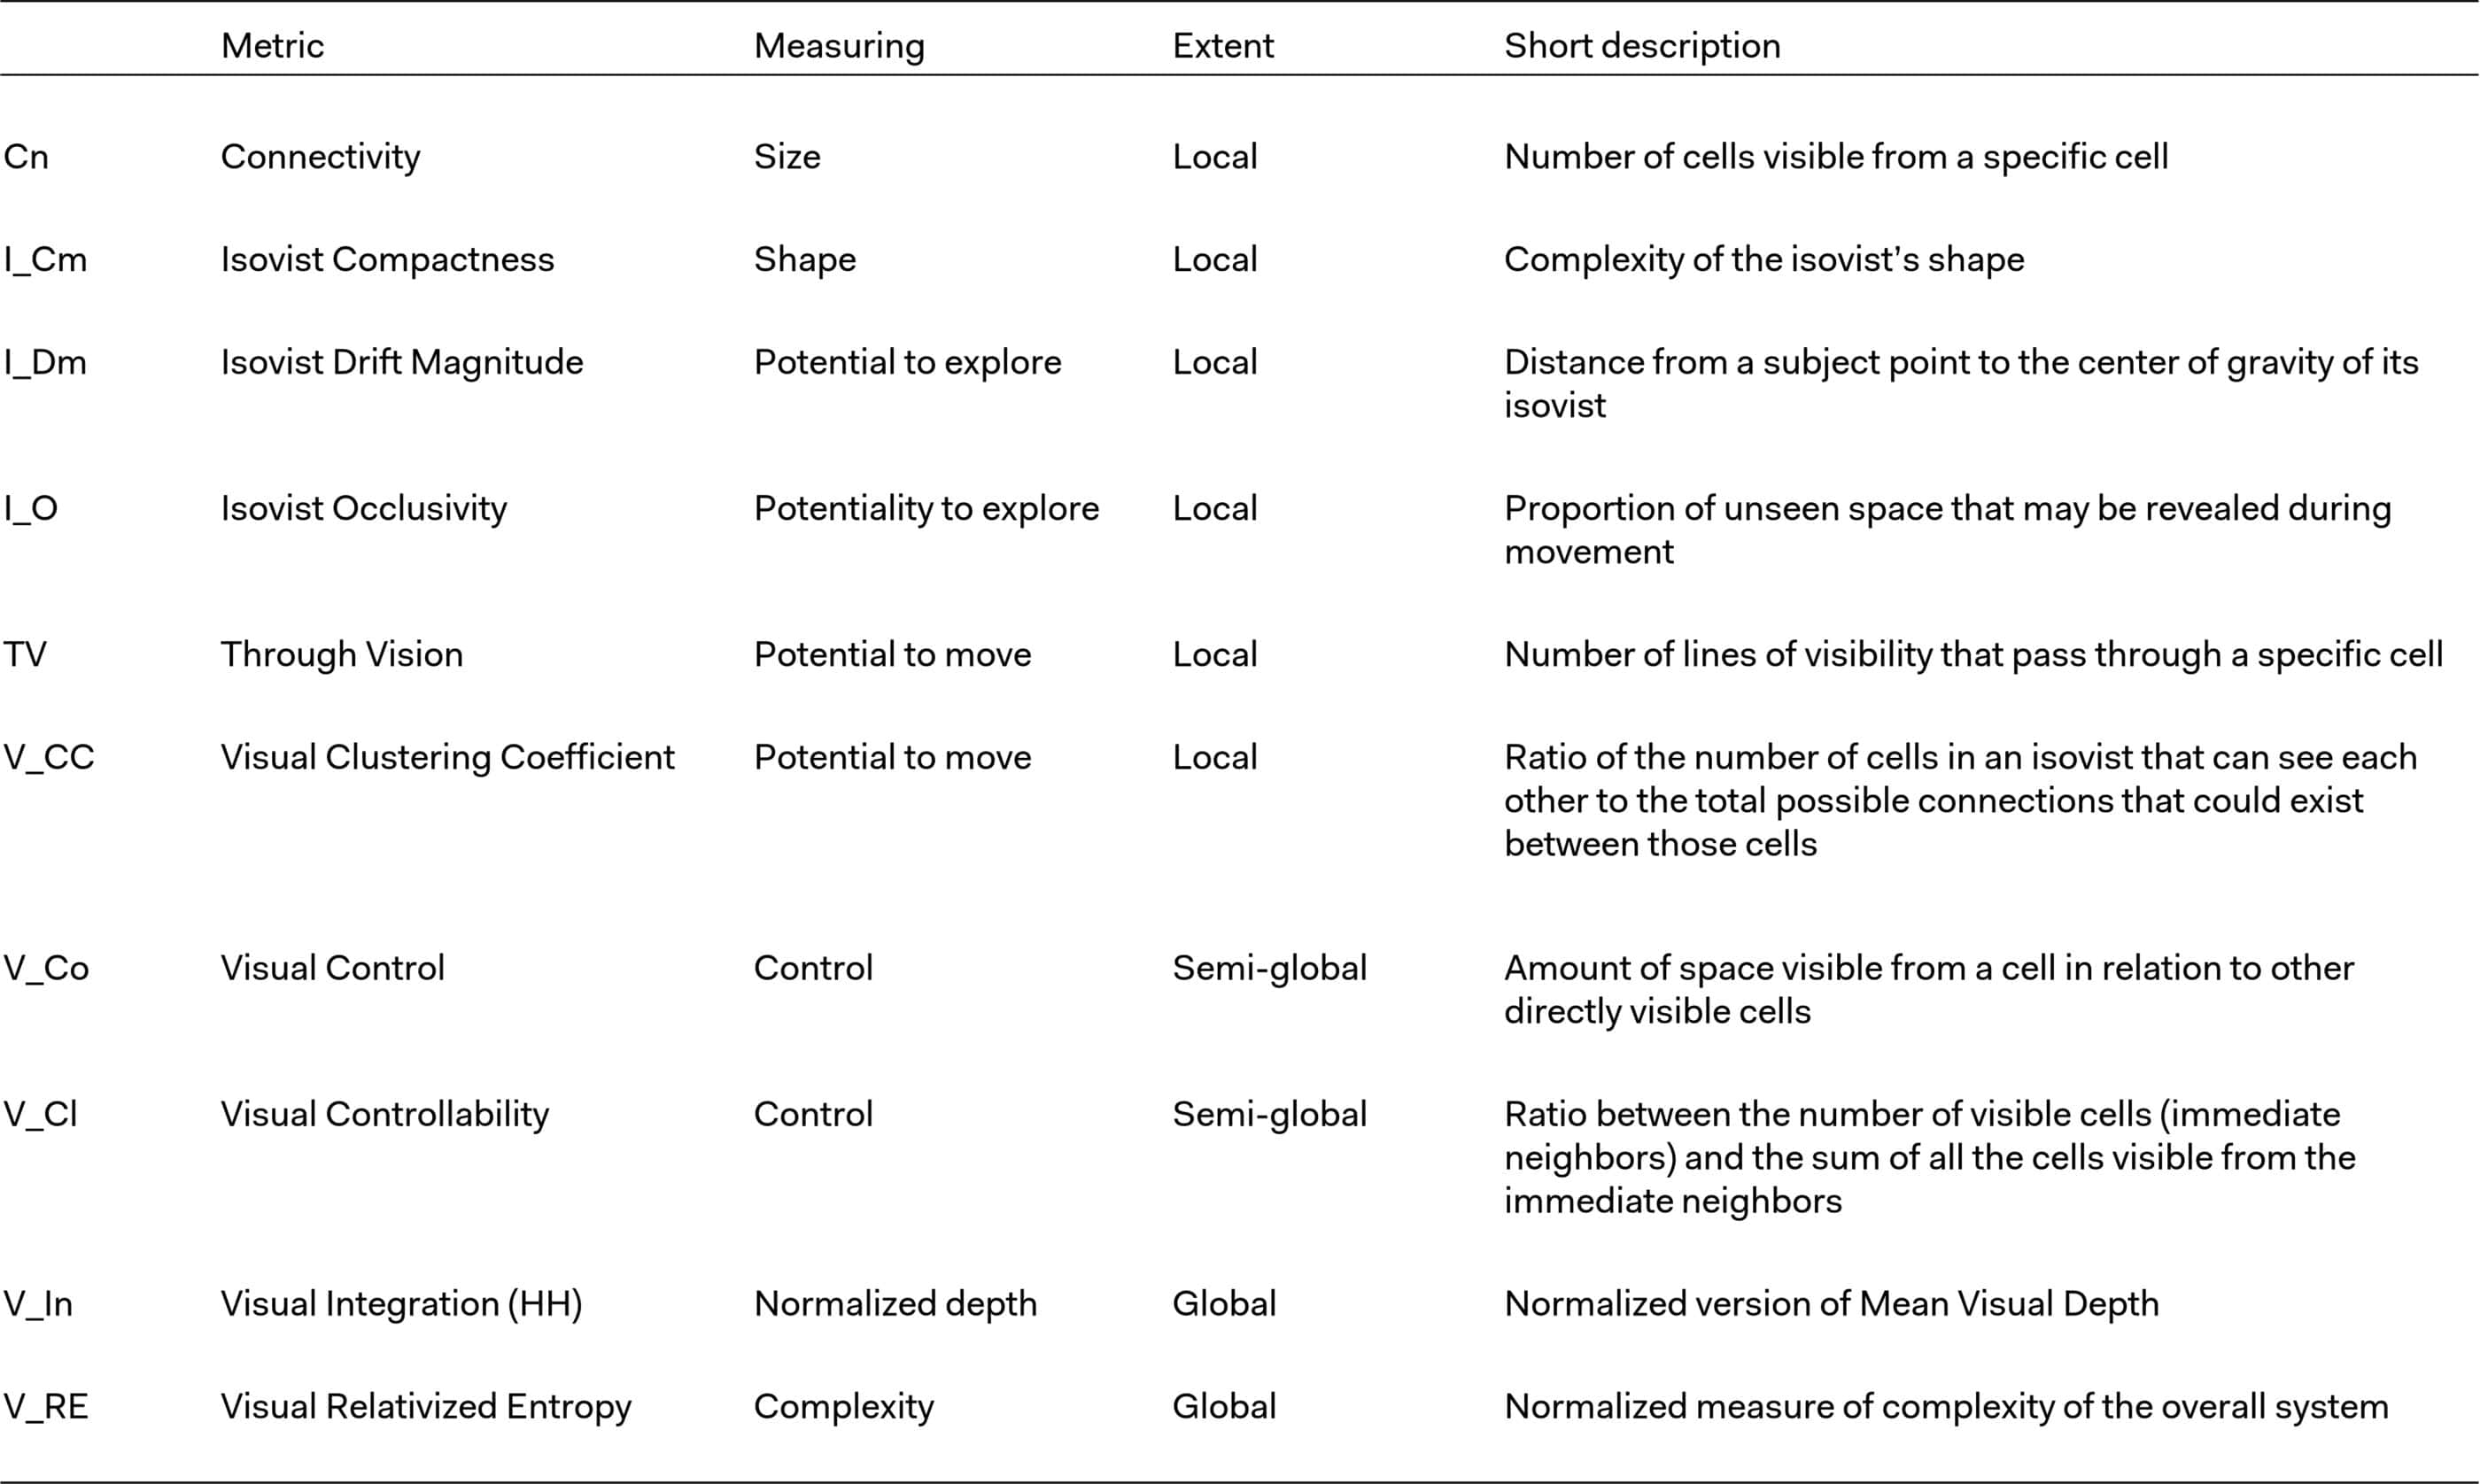
The analyzed space is configured as an open-geometry area, that is expected to be used in diverse manners, as follows: (i) users crossing the central area to get to the other side of the square; (ii) users walking slowly and stopping to appreciate the architecture of the square; and (iii) users walking in relation to urban functions (e.g., subway accesses, shopping venues, etc.). VGA metrics chosen to describe the area are listed in Table 3, these are calculated with diverse restricted visibility distances (i.e., NR – Not Restricted, 150m, 100m and 50m).
Video description and analytics techniques
Five videos were analyzed to obtain pedestrian footfall data. The footage was recorded on July 15, 2021, in five different moments of the day, specifically at 08:00, 11:00, 12:45, 15:00 and 18:00, each of them depicted a 30-minute time interval, with a size of 1920×1080 pixels and a frame rate of 15 frame per second (FPS).
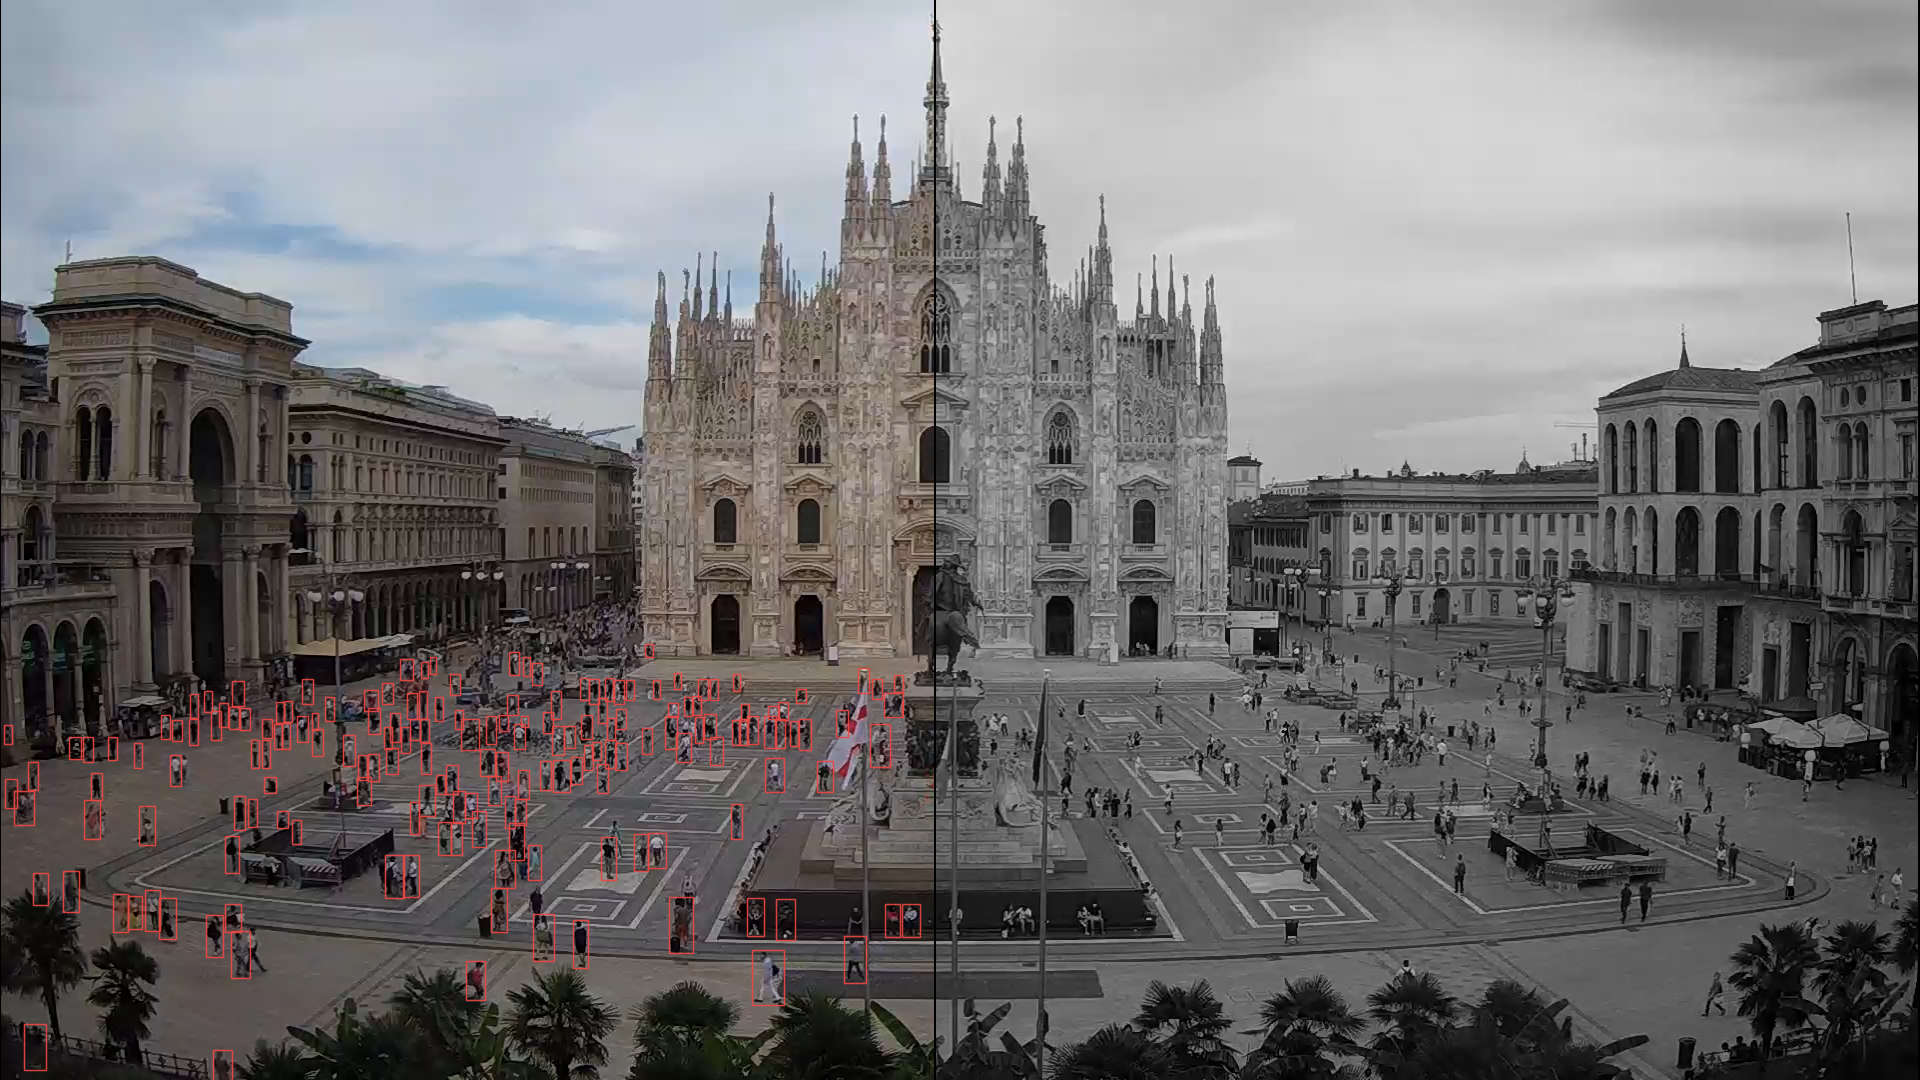
Yolov5 (Jocher et al., 2021) with DeepSORT integration was used to detect pedestrians in the square, as visible in Figure 3. An open-source model was used, which was trained on webcam images in Montreal, Canada (City of Montreal, 2021), obtaining a mean Average Precision (mAP) equal to 0.809 in pedestrians’ recognition on the original training set.
Video georeferencing
A georeferencing technique was implemented, to estimate the geographical position of the distribution of pedestrians in the square. The methodology uses the QGIS implementation of the Thin Plate Spline algorithm as a transformation technique, with 240 Ground Control Points selected to anchor points in the perspective image. The procedure is repeated through an automatic matching algorithm in each frame of the videos.
Detections’ measurements
The georeferenced pedestrian coordinates (x, y) in each frame were then associated to the corresponding cell of the VGA grid, in Figure 2. Then, a mean occupancy value, expressed as people/sec, was computed, averaging the number of detections that fell into the same grid cell within fifteen frames. Finally, two metrics were computed:
- Cumulated footfall measure, defined as the cumulative sum of the mean occupancy value in thirty seconds bins;
- Turnover variation measure, computed as the sum of the difference in occupancy in a cell every five seconds and the activation measure (i.e., measuring the frequency of activation of the cell), normalized on the mean occupancy of the cell.
Results
Measured pedestrian footfall
The video analytics process allowed for the calculation of the occupancy of the space on the 2x2m grid. Since the footage was taken at different hours of the day, the footfall measured in the videos differs in magnitude and patterns, reflecting the varying nature of the public space. Figure 1 shows the detection collected during the 08:00 video, and Table 4 shows the results of the video analytics, including descriptive statistics to highlight the diversity of the results.
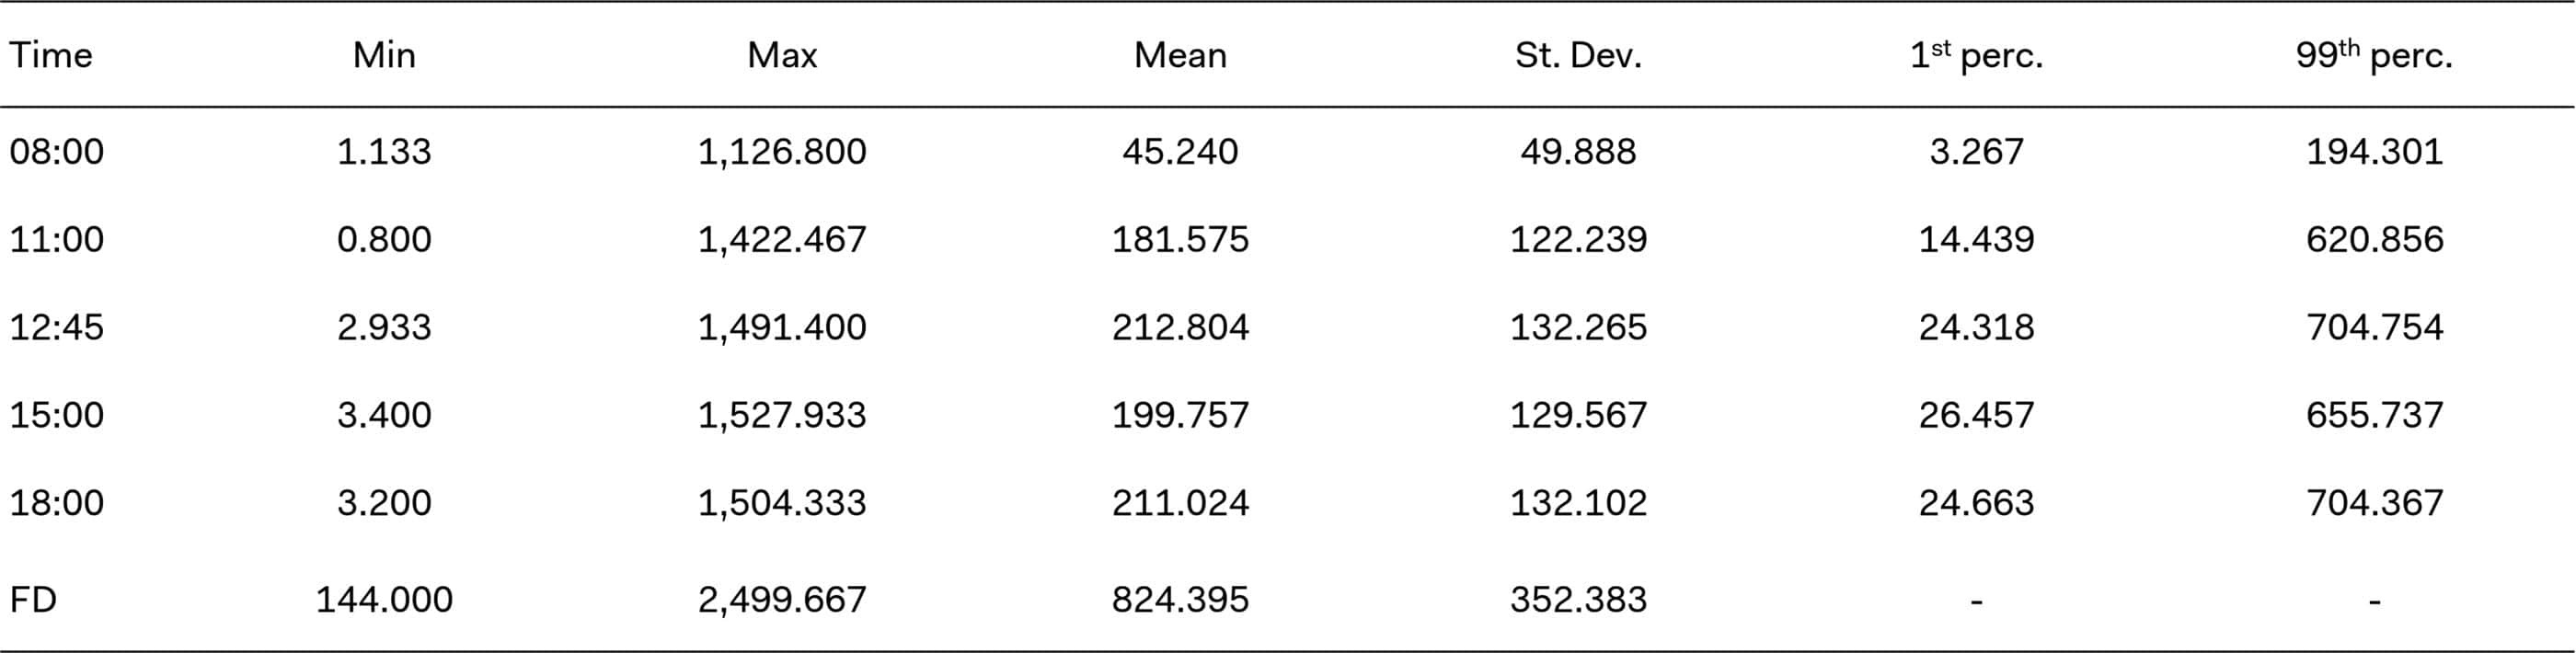
Then, outliers were removed from the distributions, considering the 1st and the 99th percentile of each video sequence and two metrics were defined:
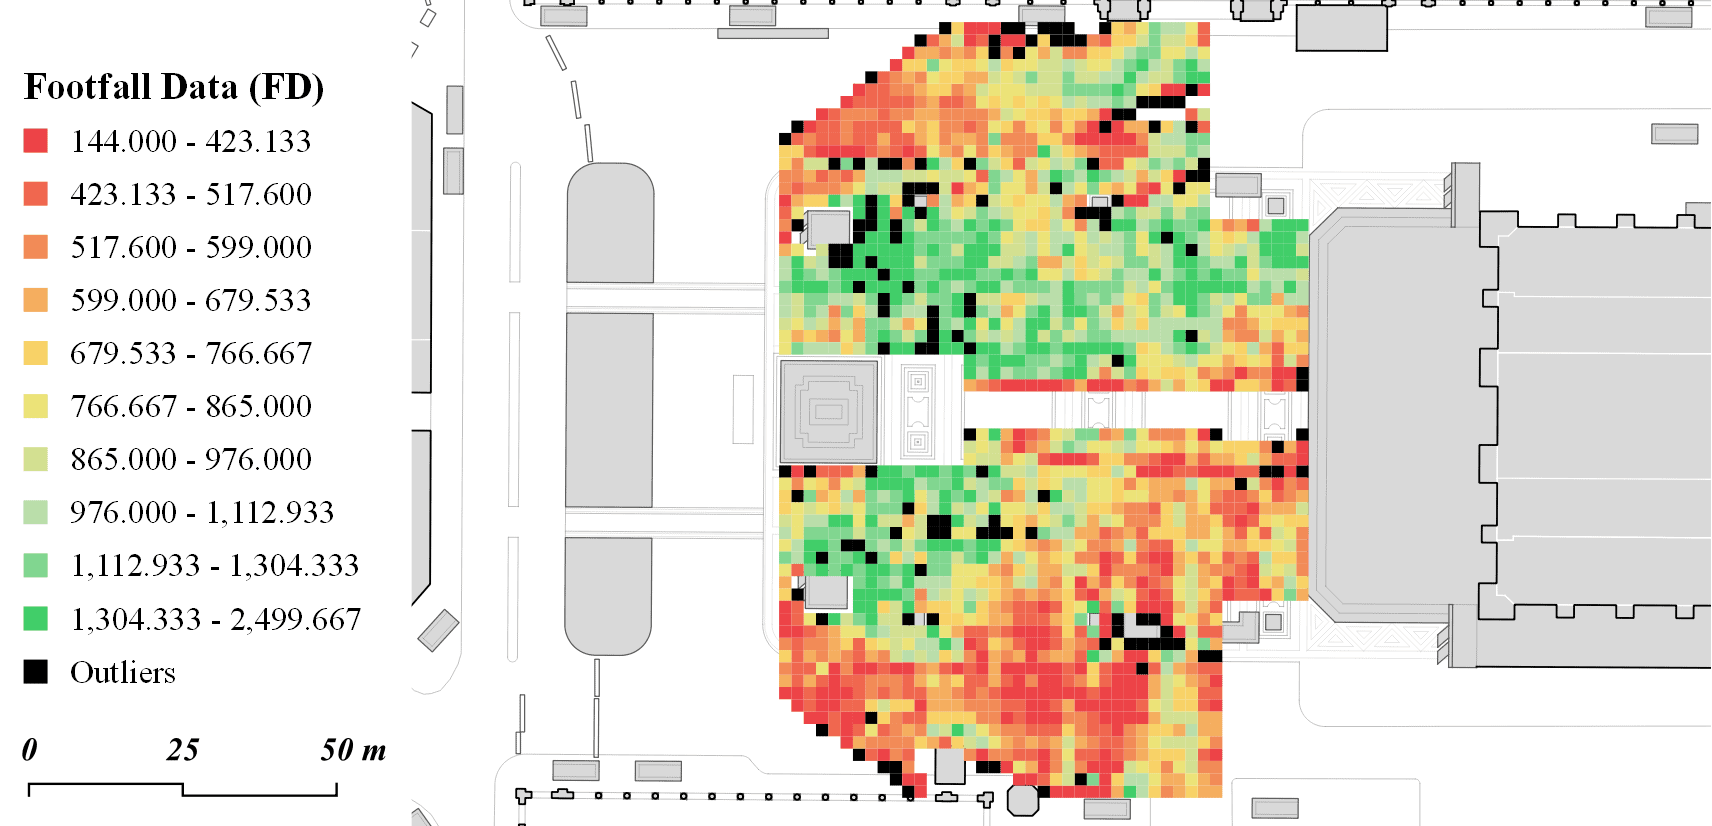
- Footfall Data (FD) is defined as the sum of the cumulated mean occupancy for the five videos. It represents the utilization pattern of the square, describing an average situation of different moments of the day (see Figure 4);
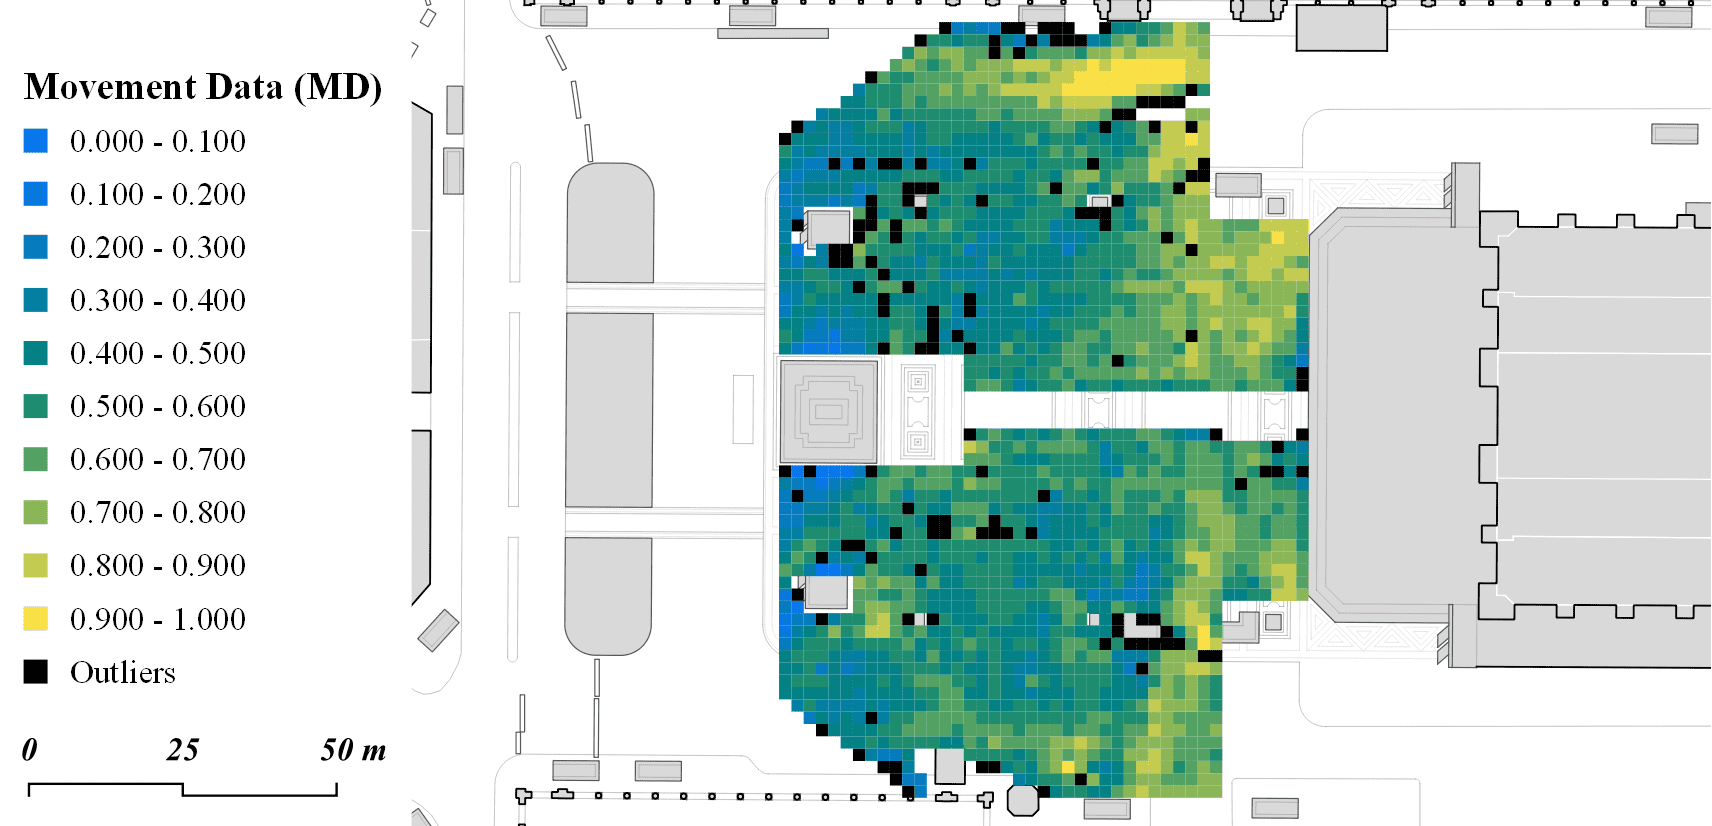
- Movement Data (MD) is defined as the mean value of the measure of variation (Var) for the five videos. It represents the cells with a high turnover, namely the areas where the pedestrians don’t stop but generally keep moving (see Figure 5).
VGA metrics
The VGA analyses were calculated for the area shown in Figure 2, for several maximum visibility distances (i.e., NR – Not Restricted, 150m, 100m and 50m), to compare the results and understand which distance can describe effectively an open public space. In Figure 6, it is possible to see how out of the ten selected metrics, three of them (i.e., I_Cm – Isovist Compactness, I_DM – Isovist Drift Magnitude, and I_O – Isovist Occlusivity) are not related to the maximum visibility distance parameters, since those are based on the un-restricted isovist’s shape. The other metrics show a consistent difference among the four distances, namely the transition from the large-scale topology to the open public space topology.
Correlation analyses
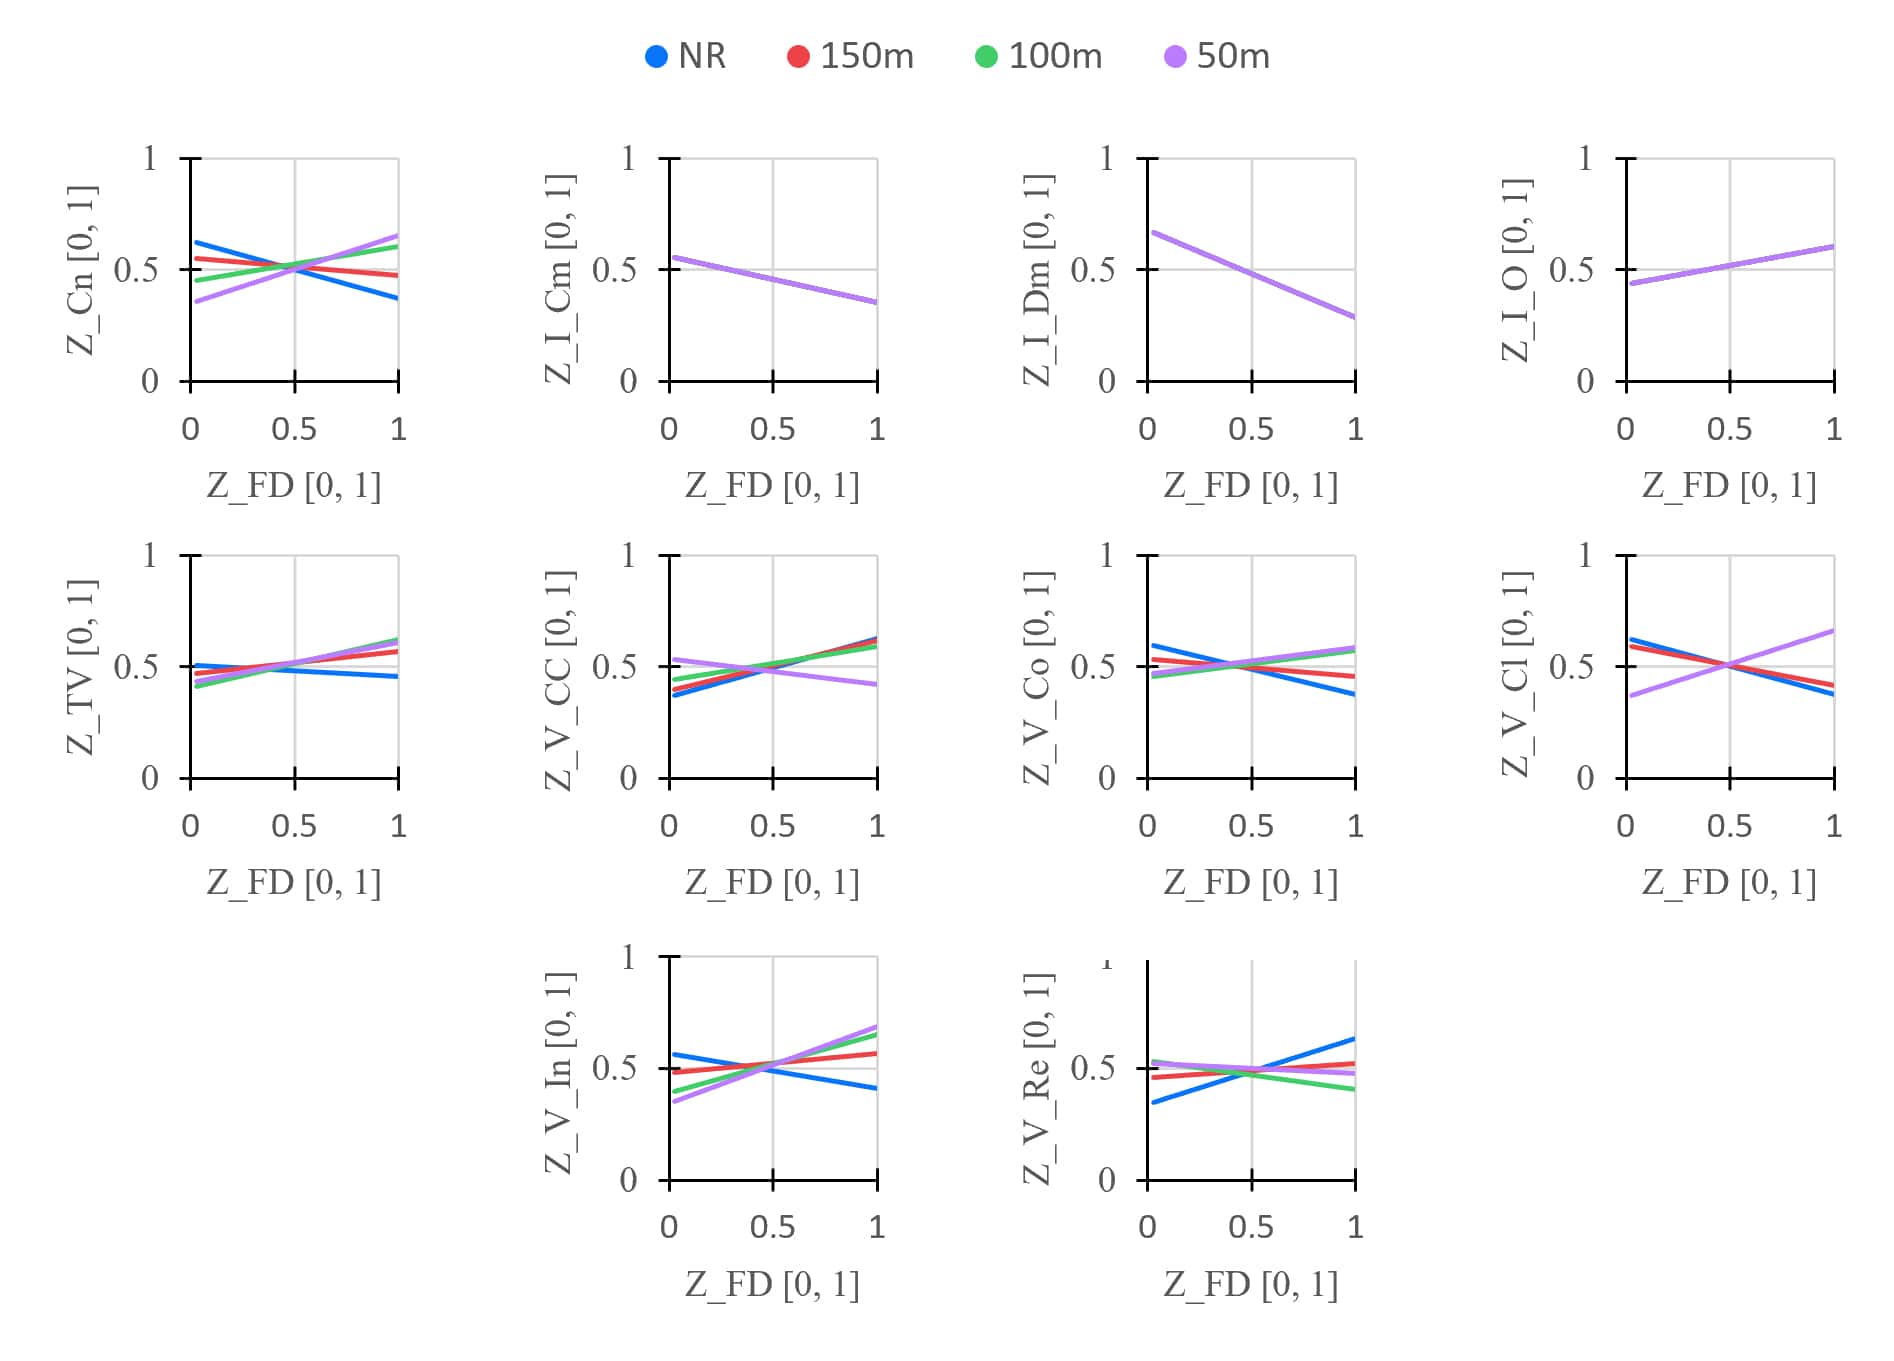
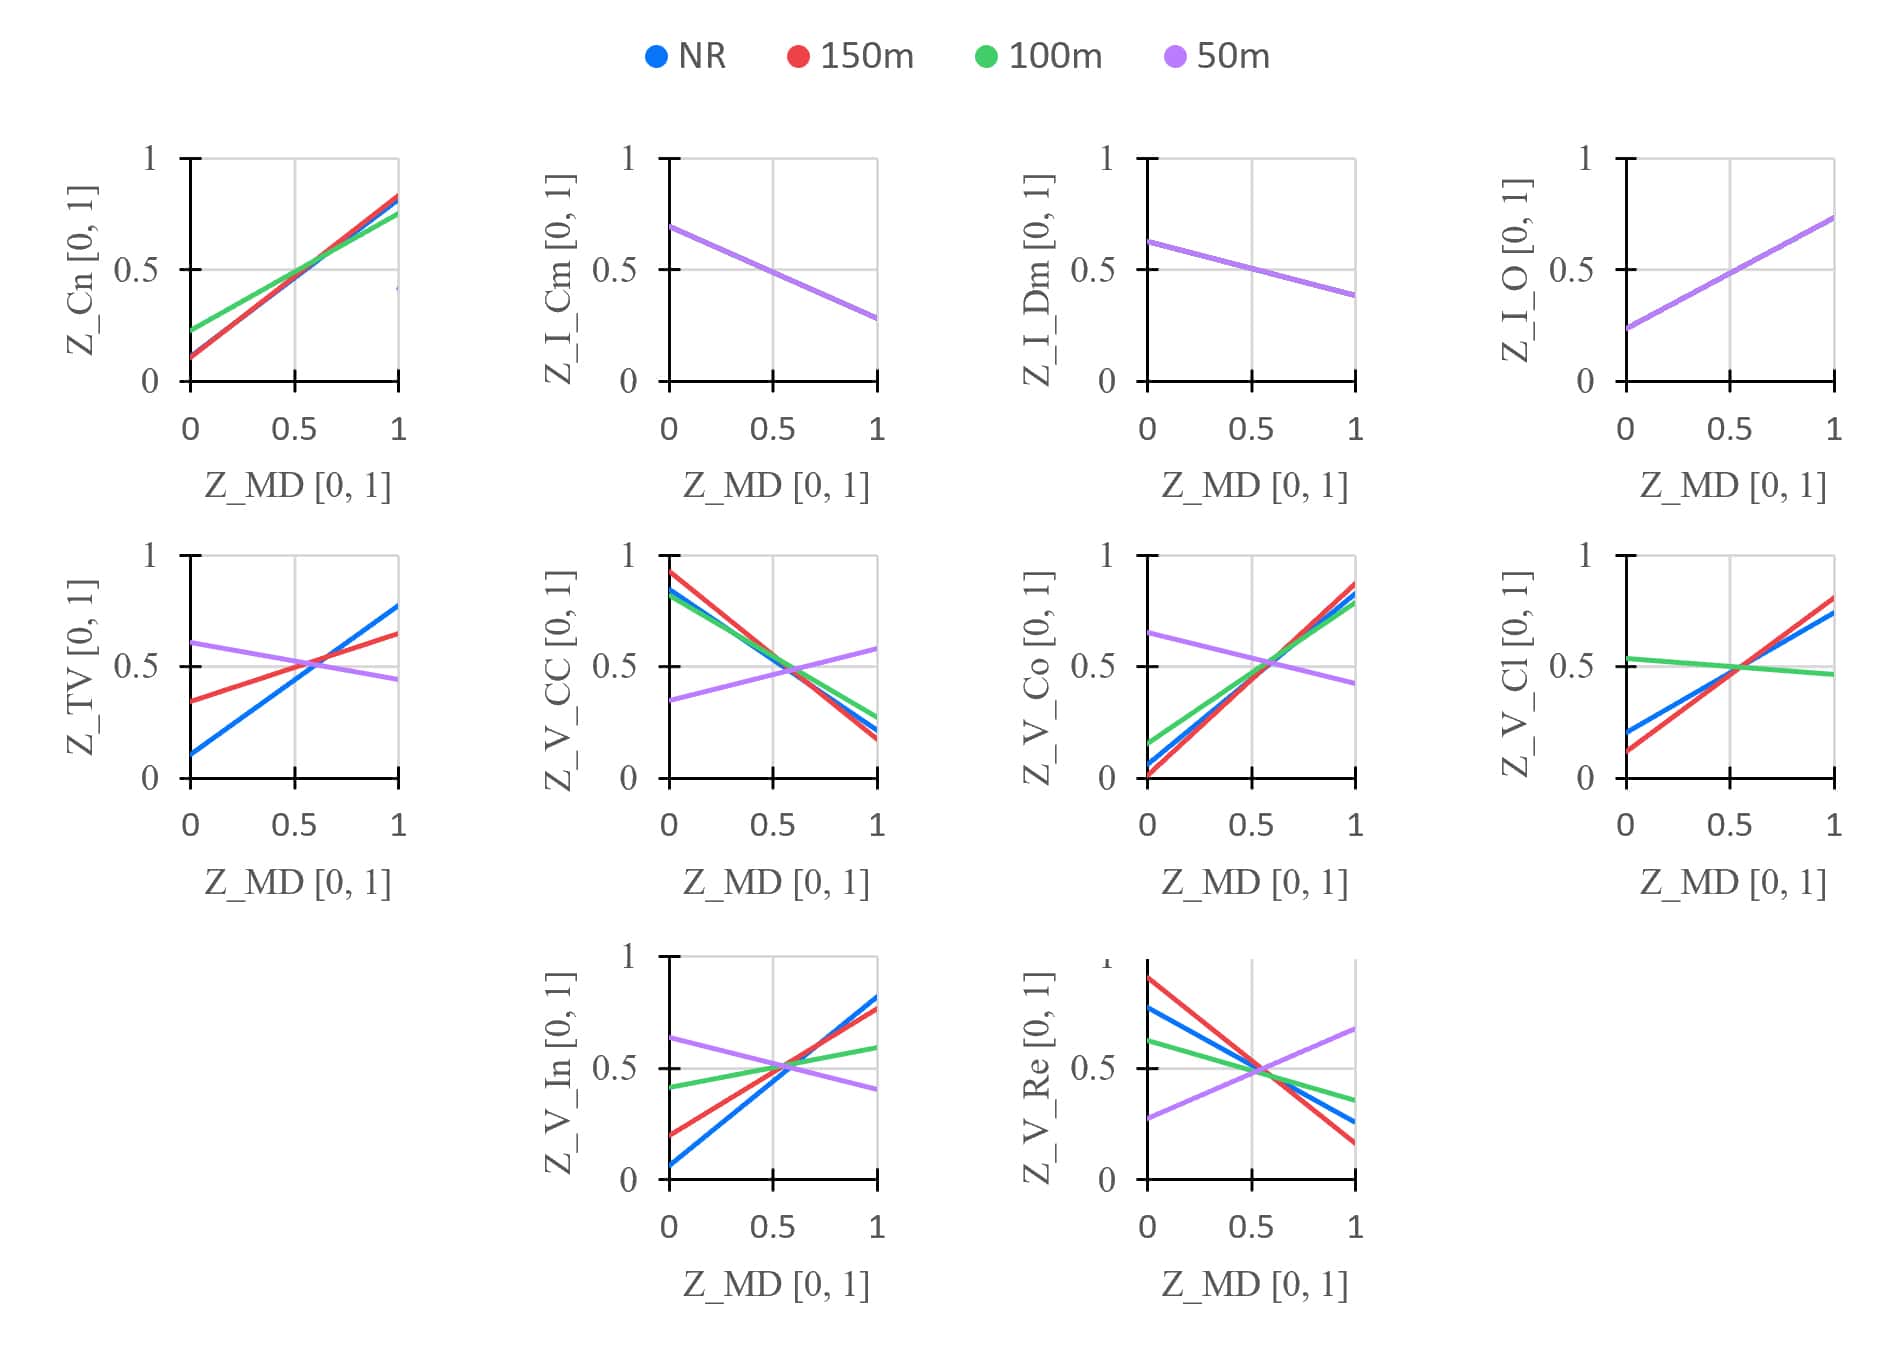
In this phase, the VGA metrics, with the variation of the restricted visibility distance parameter, and the Footfall Data (FD) were normalized, while the Movement Data (MD) was linearized. Then, using Pearson’s Correlation Coefficient, the datasets were analyzed with a series of correlations analyses. The results for the Footfall Data (FD) and the Movement Data (MD) are shown, respectively in Figure 7 and Figure 8.
Discussion
The correlation results for the Footfall Data (FD), visible in Figure 7, do not show strong correlations between the analyzed data. The values range from negative to positive correlations, but the absolute values are never higher than .376, in the case of the Isovist Drift Magnitude. The restricted visibility parameter influences results for (i) Connectivity, (ii) Through Vision, (iii) Visual Control, and (iv) Visual Integration (HH).
The correlation analysis results for the Movement Data (MD), shown in Figure 8 express different outcomes. The correlation coefficient is still moderate at best, such as the cases of Connectivity (.373 – NR and .411 – 150m), Through Vision (.373 – NR), Visual Clustering Coefficient (-.326 – NR and -.391 – 150m), Visual Control (.402 – NR and .468 – 150m), and Visual Integration (HH) (.396 – NR and .303 – 150m)
These results can be related to a case-specific utilization of the space for the Duomo case study. The touristic nature of the square and the presence of the subway accesses lead to a higher cumulative density in the middle part of the space, but, at the same time, the area utilized to move around draw some “desire lines”, especially near the gallery, that are also well represented in the VGA analyses. The Movement Data (MD) metric allow to clean the recorded movement data from the noise of people standing still in the space, narrowing the analysis to the actual flows.
In support of this statement, it is possible to see how the short-radius Visual Integration (50m), which shows a positive correlation of .326 with the Footfall Data (FD), is not linked to the topological shape of the larger environment, but it is very similar to results obtainable in a perfect square shape: higher values in the middle, with lower values toward the edges, also the Connectivity follow a very similar pattern. Meanwhile, the Movement Data (MD) is better correlated with the large-radius and, thus, showing how the environment shapes the presence of pedestrian flows. Finally, in the case of Through Vision, which can be regarded as an alternative to EVA agents for 360° field of view, the comparison between the Footfall Data (FD) and Movement Data (MD) shows much more consistent results in the latter case.
The outcomes of these analyses are in line with other recent research studies (Ericson et al., 2020; Koutsolampros et al., 2019), and show limitations in the application of VGA metrics in relation to different typologies of spaces. However, the proposed case study is a particularly complex environment chosen to stress the reliability of the VGA metrics in a space characterized by an inherent asymmetry of functions and the presence of strong attractors and generators, namely the subway accesses. These factors weight heavily in the pedestrian movements, greatly influencing the cumulated density as expressed in the FD dataset. On the other hand, the utilization of a “movement-based” metric, expressed in the MD dataset, allow to partially re-focus the analysis on the movements.
Conclusions and Future Work
The proposed case study is utilized to test the VGA metrics values, obtained by varying the restrict visibility parameter, in the central part of Piazza Duomo (Milan, Italy). The central portion of the public space was recorded through a webcam, and the footage was studied through video analytics techniques, measuring the pedestrian activity of the space discretized in a 2x2m grid.
The metrics and the pedestrian movements were tested in correlation analyses, showing weak to moderate correlation values. In this framework, the proposed Movement Data (MD) shows positive moderate correlation with VGA metrics usually associated to movements, namely Connectivity, Through Vision and Visual Integration (HH). As future improvement, this dataset can be refined by introducing tracking technologies in the video analytics techniques, associating a unique ID to each pedestrian, and recording its location and movement speed.
Future works include the application of the Agent Analysis (Turner, 2003), based on the VGA metrics, considering a series of access gates, acting as starting points of space exploration and the implementation of anchors-based metrics, specifically a metric value representing the distance from the main anchors. The weighting of the VGA metric, especially the Visual Integration (HH) with the distance from selected points could lead to a more reliable representation of the public space, in the effort to build a calibrated VGA model.
Lastly, future work will be focused on the possibility to further characterized pedestrian profiles by using proxemics, speeds and trajectories data collected through tracking video analytics techniques, in line with the conceptualization of different walking behaviors of single pedestrians and groups in (i) time driven pedestrians, (ii) space driven pedestrians and (iii) social driven pedestrians.
The results of this research work have been presented at the 13th International Space Syntax Symposium: Messa, F., Ceccarelli, G., Gorrini, A., Presicce, D., Choubassi, R. (2022). Deep Learning Video Analytics to Assess VGA Measures and Proxemic Behaviour in Public Spaces. In: Proceedings of the 13th International Space Syntax Symposium (13SSS), 22-24 June 2022, Bergen (Norway). Available at: https://www.hvl.no/globalassets/hvl-internett/arrangement/2022/13sss/479messa.pdf
Acknowledgments
The analyzed data were treated according to the GDPR-General Data Protection Regulation (EU, 2016/679). This research received no specific grant from any funding agency in the public, commercial, or not-for-profit sectors.
References
City of Montreal (2021). Annotated images taken from the video stream of traffic cameras. Information Technology Department. Available at: https://donnees.montreal.ca/ville-de-montreal/images-annotees-cameras-circulation
Conroy, R. (2001). Spatial navigation in immersive virtual environments. University of London, University College London (United Kingdom).
Ericson, J. D., Chrastil, E. R., & Warren, W. H. (2020). Space syntax visibility graph analysis is not robust to changes in spatial and temporal resolution. Environment and Planning B: Urban Analytics and City Science, 48(6), 1478-1494. https://doi.org/10.1177/2399808319897624
Hillier, B. (2007). Space is the machine: a configurational theory of architecture. Space Syntax.
Hillier, B., & Hanson, J. (1984). The Social Logic of Space. Cambridge, New York: Cambridge University Press.
Hillier, B., Major, M.D., Desyllas, J. Karimi, K. Campos, B., Stonor, T. (1996). Tate Gallery, Millbank: a study of the existing layout and new masterplan proposal. UCL (University College London): London, UK. Available at: https://discovery.ucl.ac.uk/id/eprint/932/1/hillier-etal-1996a_TateGallery.pdf
Jocher G., Stoken A., Chaurasia A., Borovec J., NanoCode012, TaoXie, Kwon Y., Michael K., Changyu L., Fang J., Abhiram V., Laughin, tkianai, xyNONG, Skalski P., Hogan A., Nadar J., imyhxy, Mammana L., … & wanghaoyang0106 (2021). ultralytics/yolov5: v6.0 – YOLOv5n ‘Nano’ models, Roboflow integration, TensorFlow export, OpenCV DNN support (v6.0). Zenodo. https://doi.org/10.5281/zenodo.5563715
Koutsolampros, P., Sailer, K., Varoudis, T., & Haslem, R. (2019). Dissecting Visibility Graph Analysis: The metrics and their role in understanding workplace human behaviour. In: Proceedings of the 12th International Space Syntax Symposium (Vol. 12). Available at: https://discovery.ucl.ac.uk/id/eprint/10073528/
Tomé, A., Kuipers, M., Pinheiro, T., Nunes, M., & Heitor, T. (2015). Space–use analysis through computer vision. Automation in Construction, 57, 80-97. https://doi.org/10.1016/j.autcon.2015.04.013
Turner, A. (2003). ‘Analysing the visual dynamics of spatial morphology.’ Environment and Planning B: Planning and Design, 30(5), 657-676. https://doi.org/10.1068/b12962
van Nes, A., & Yamu, C. (2021). Empirical Data Collection and Analysis, and Connecting Data with Space Syntax. In A. van Nes, & C. Yamu (Eds.), Introduction to Space Syntax in Urban Studies (pp. 133-170). Springer. https://doi.org/10.1007/978-3-030-59140-3_5