
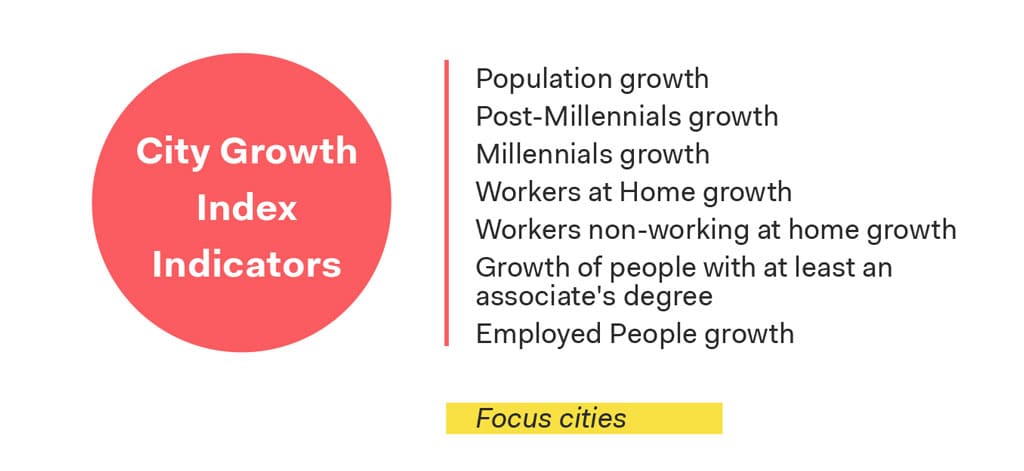
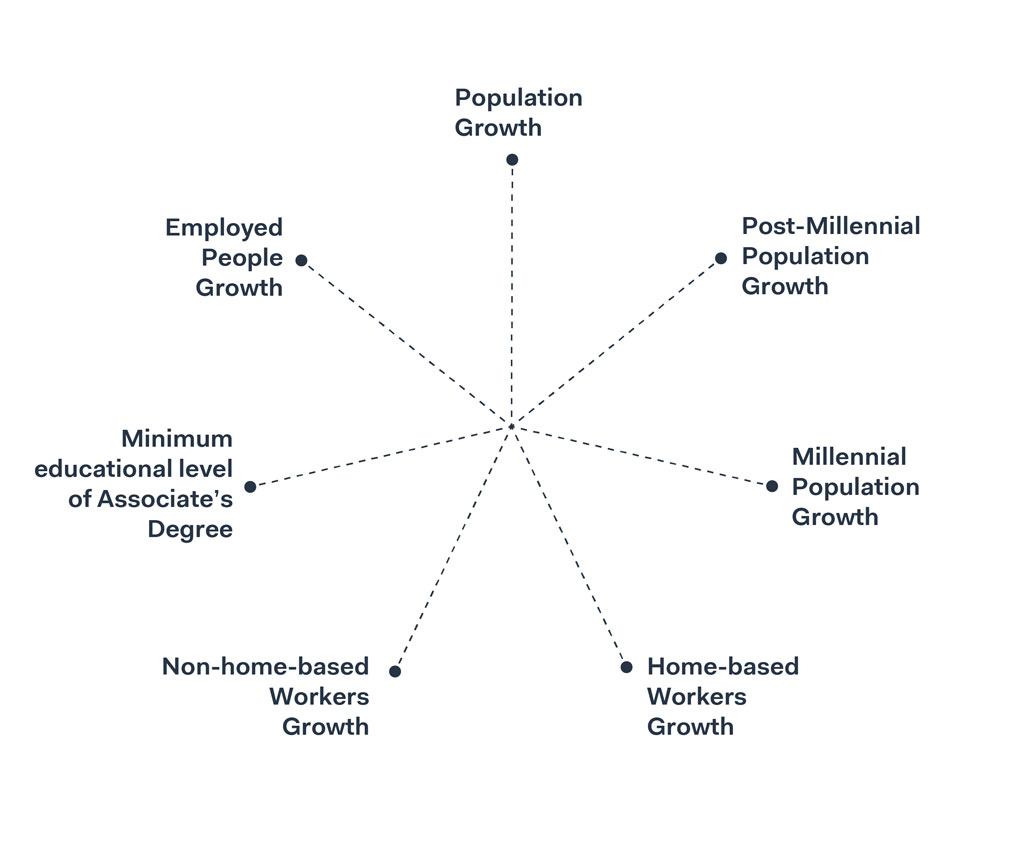
Radar chart index
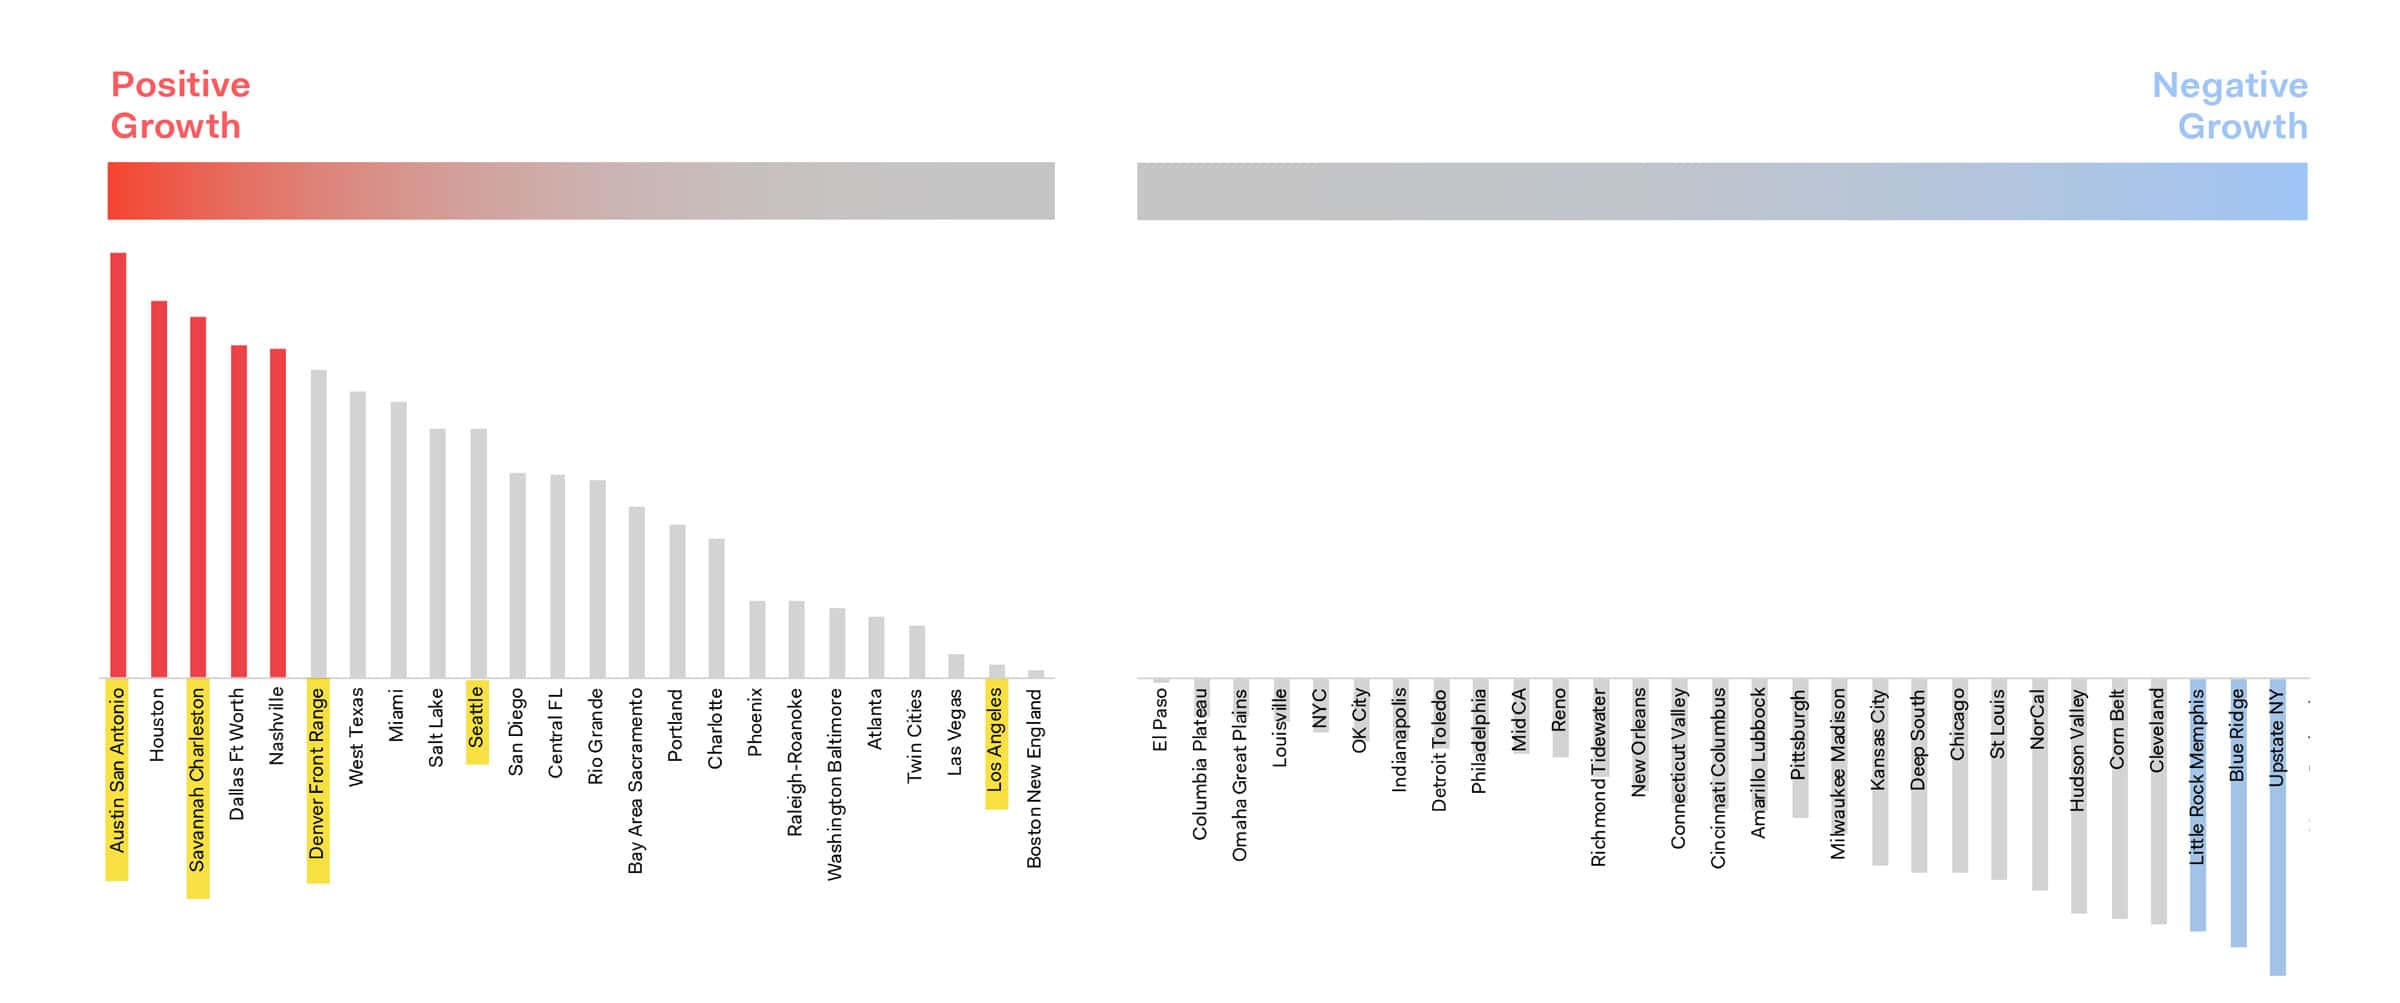
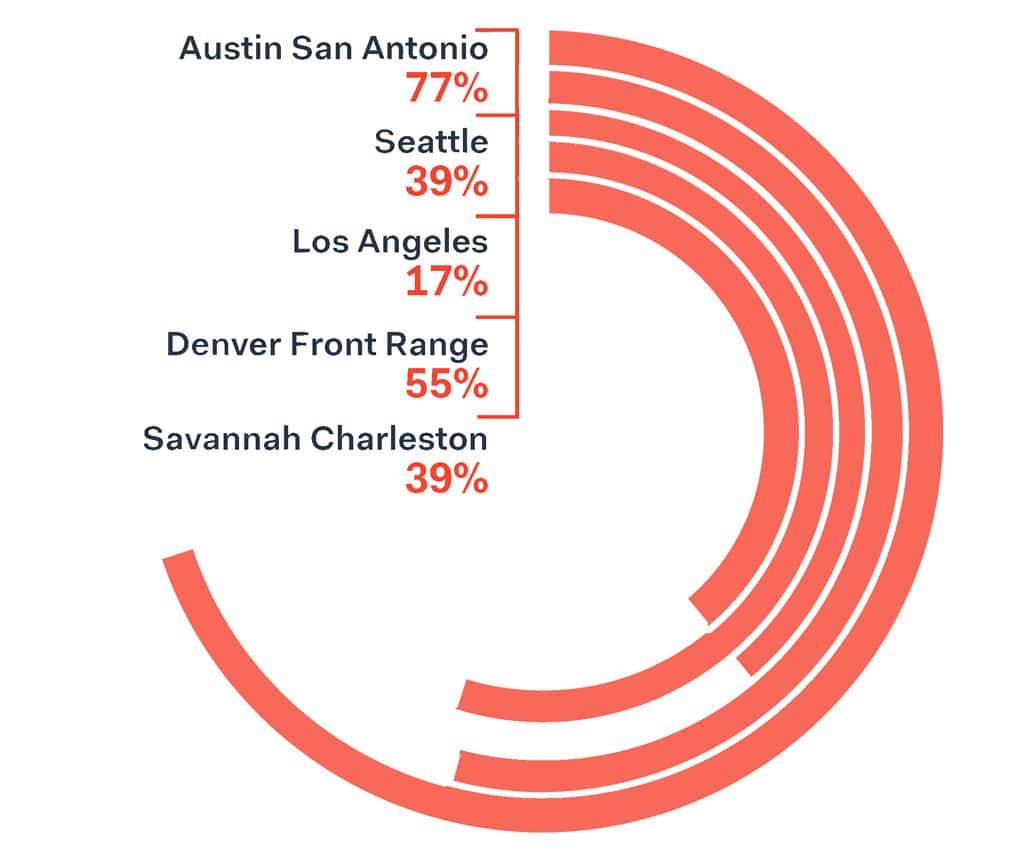
City growth volumes as percentage of maximum
Radar chart index relative to city growth indicators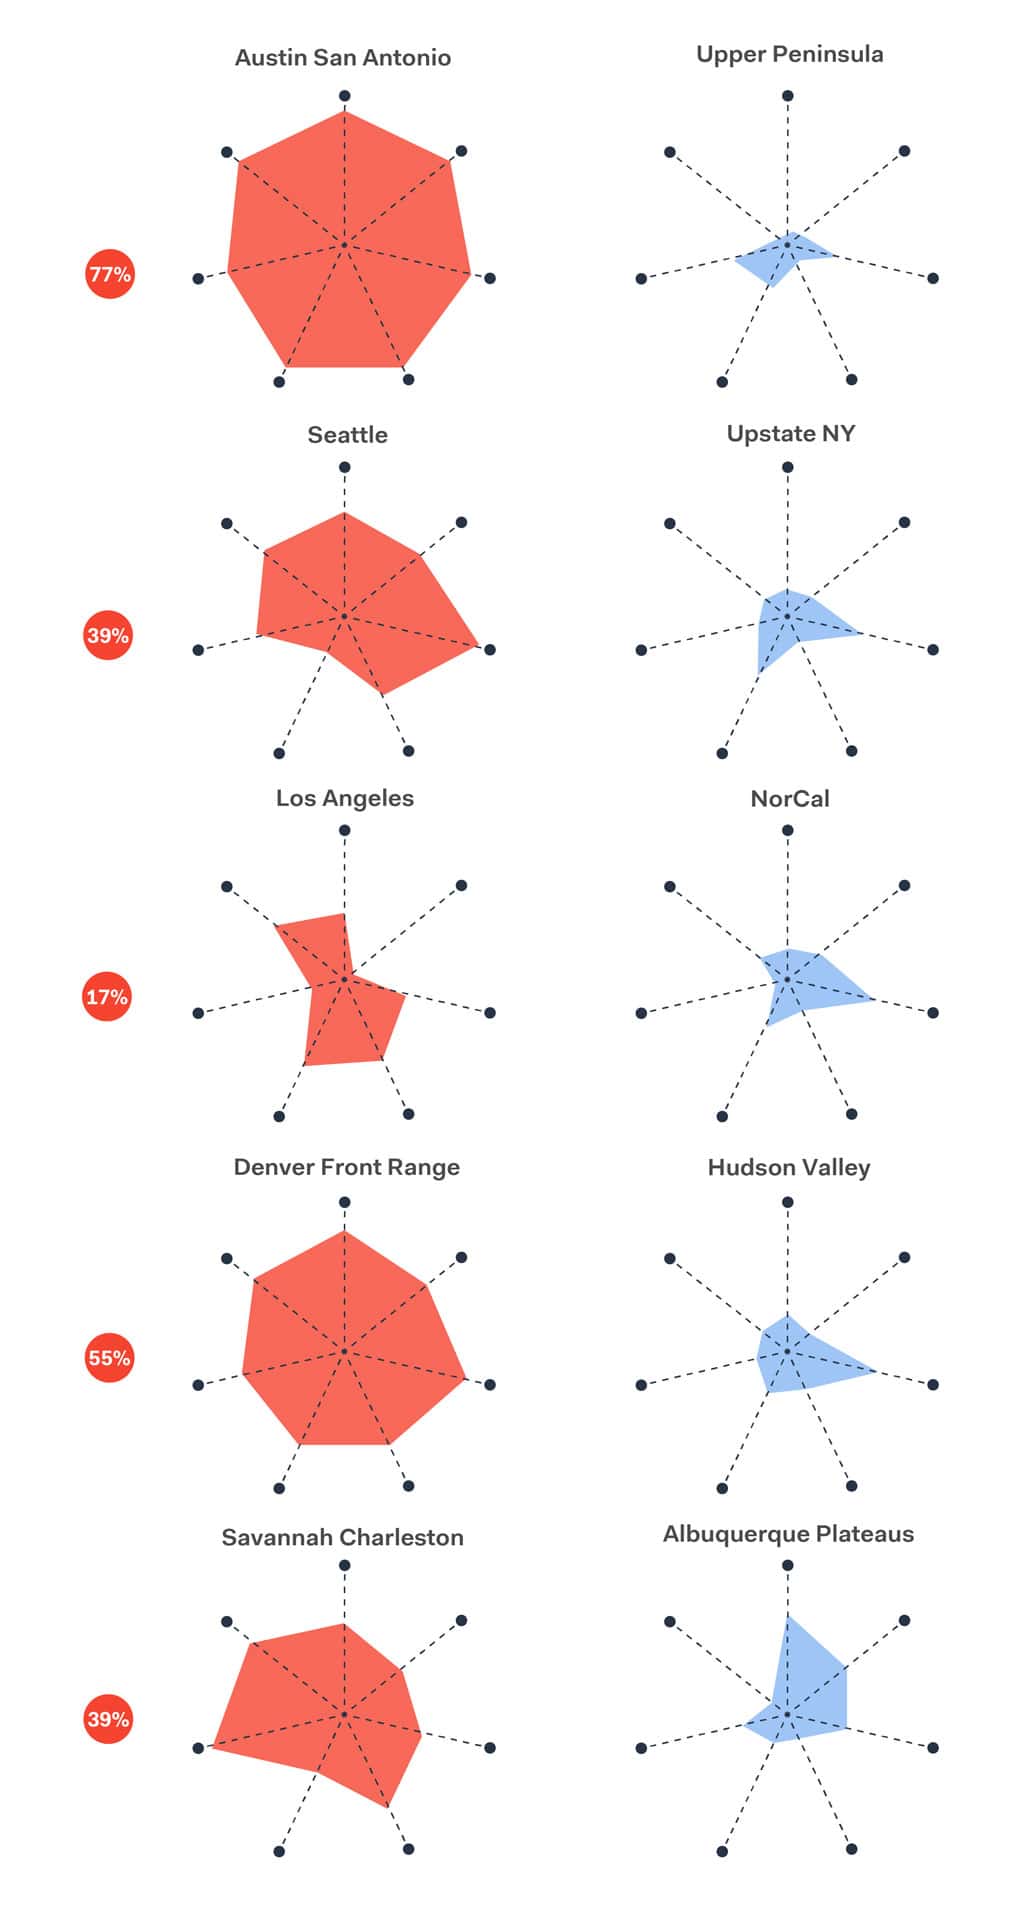
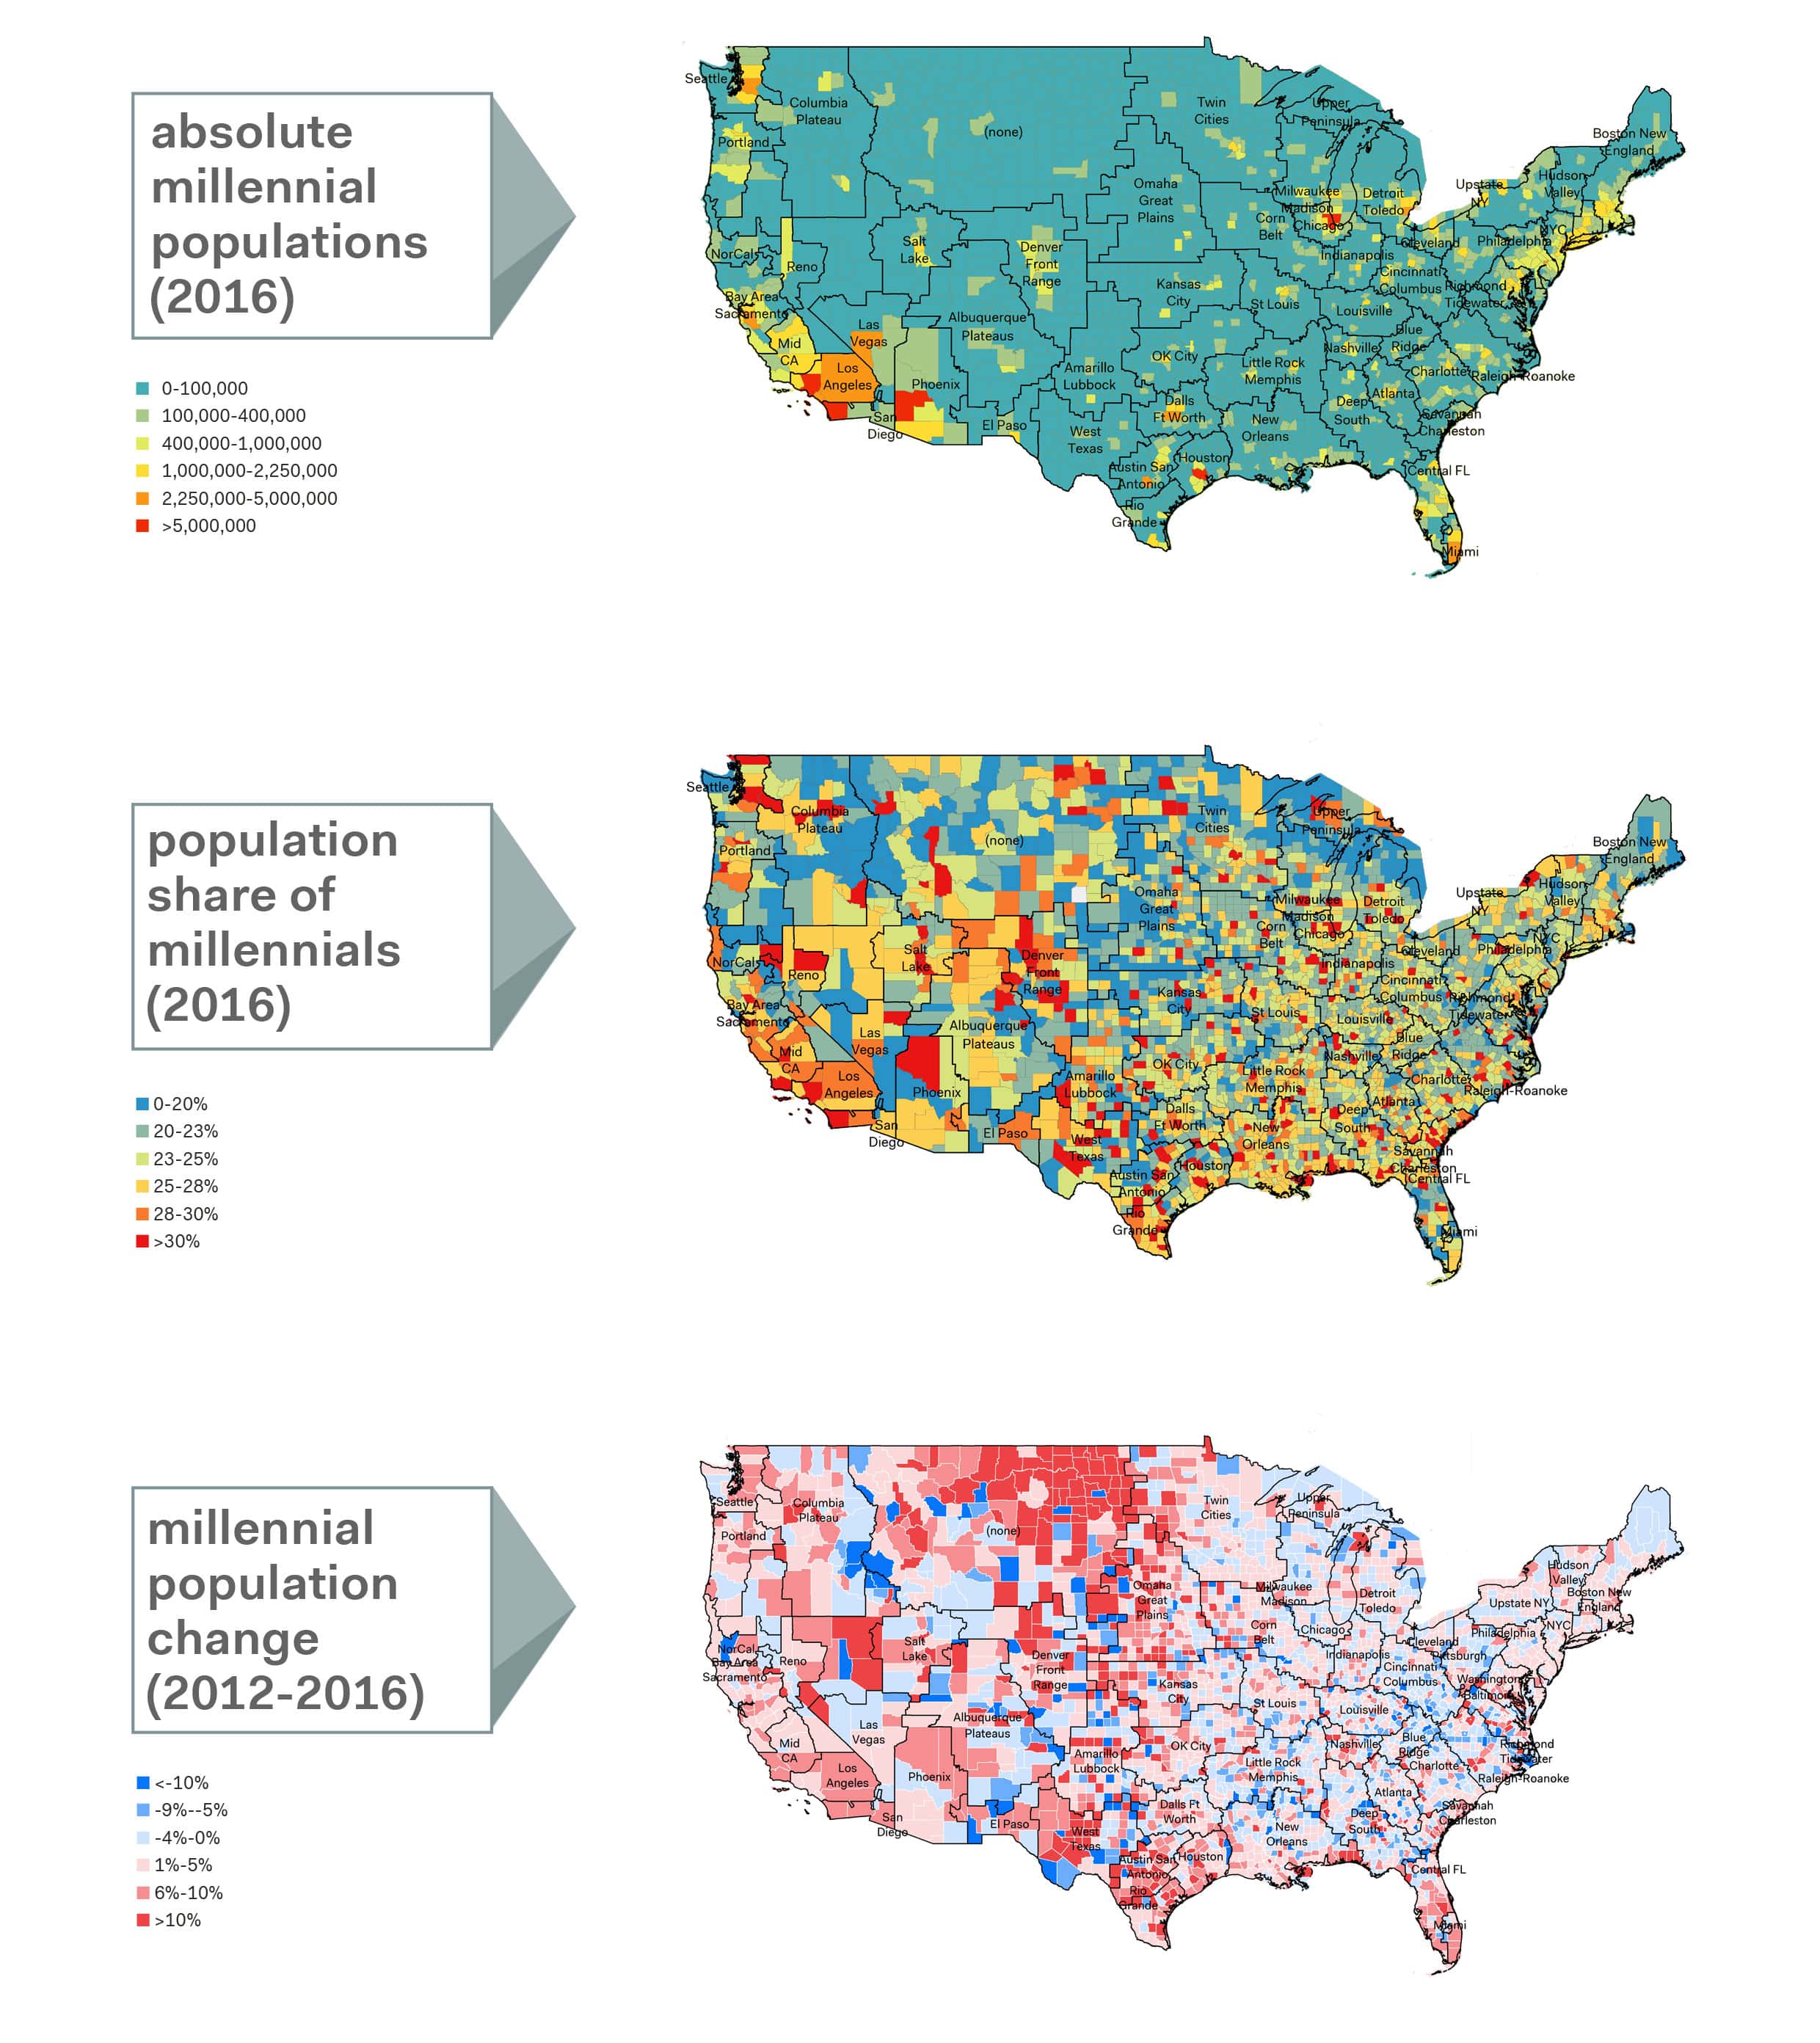
Strength in numbers: where are millennial populations growing?
Data clearly shows population surges in America’s Rocky Mountains and Southwest regions
In this study, the geography of the United States is segmented into 55 megaregions, redefining regions as areas with commuting and economic relations. The megaregional map is based on a superimposition of visual and logarithmic computations of megaregions; ensuring it is grounded in empirical analysis but refined using interpretive cartographic methods.
A general reading of the millennial population (defined at the time of the study as those falling between the ages of 25-44) in the United States in absolute numbers based on 2016 census data highlights higher concentrations in the coastal regions. This trend is in keeping with general population figures. According to the United States Census Bureau, about 30 per cent of the population lived in counties directly on shorelines by 2017; a 15 per cent increase since 2000.
Popular studies and readings on the habits of millennials tend to suggest a clear demarcation from previous generations, and particularly in the United States. Among other things, it is suggested that they are more transit-oriented, less car-oriented and more open to alternative forms of mobility than their predecessors. Looking at the shares of millennials relative to total populations across the country, we find that this share is generally above 20% in most regions today. Comparing this data with the situation just 4 years prior, we find that millennial shares rose in most regions across the United States, with profound increases particularly in parts of central and western America, where increases are recorded at 10% and above. The highest increases in millennial populations are all concentrated in the state of Texas, where three of the five most attractive cities for millennials are located (as previously shown in Chapter Two).
What do these demographic changes mean for American mobility trends? The following section studies a number of mobility trends in cities of diverse demographic and economic patterns as a way of investigating emerging mobility cultures. By interpreting data from the most recent census figures, we explore whether these surges in millennial populations are accompanied by any mobility shifts in America’s urban areas.

Sharing mobility: a differential upsurge
Diverse growth trends as new mobility options set their course
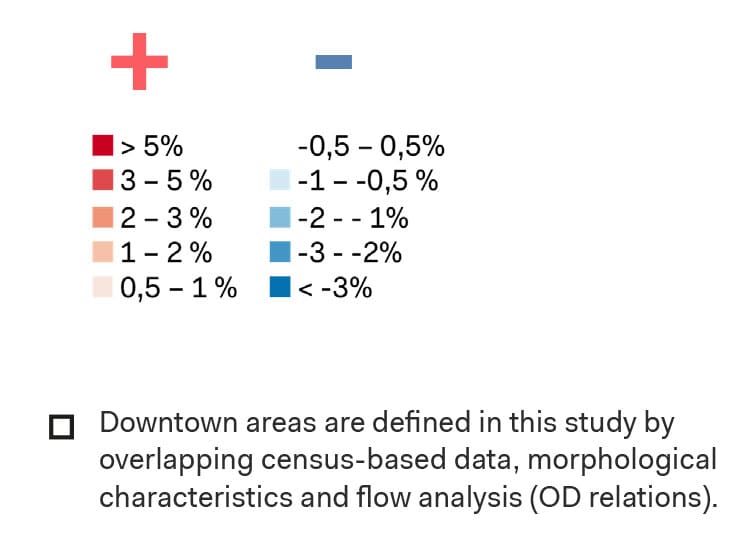
From carsharing to bikesharing and scootersharing, much has progressed in the U.S. mobility landscape in the past decade or so. New shared mobility services have been exponentially growing in the past years, with various trends across the country. As the opposite maps show, bikeshare systems, which have been growing since 2010, today range from less than 1000 bikes in some cities to 10,000 bikes in others. Scootersharing, in retrospect, has only been around since 2017. Yet, a number of cities have rapidly surpassed the 10,000 scooter mark. Likewise, the carsharing market has seen a continuous upward trend in the decade 2006-2016, growing by 15 times the number of registered members across North America in 10 years (as shown below).
This diverse uptake of shared mobility services is evident in the cities under study. Taking bikeshare as an example, we find that Denver’s B Cycle system is ahead of the race, dating back to 2010. Los Angeles’ Metro bikeshare system on the other hand has only been around since 2015. Even newer, Seattle’s bikeshare system, which as of 2019 is composed of two private providers (JUMP and Lime) and is only just beginning to find ground after failed pilot attempts in 2015/2016.

The selected cities vary in their offerings of shared mobility services. Bikeshare trends are one example: while Denver’s B Cycle system has been around since 2010, Seattle’s bikeshare program only began in 2016 and companies are still changing year on year.
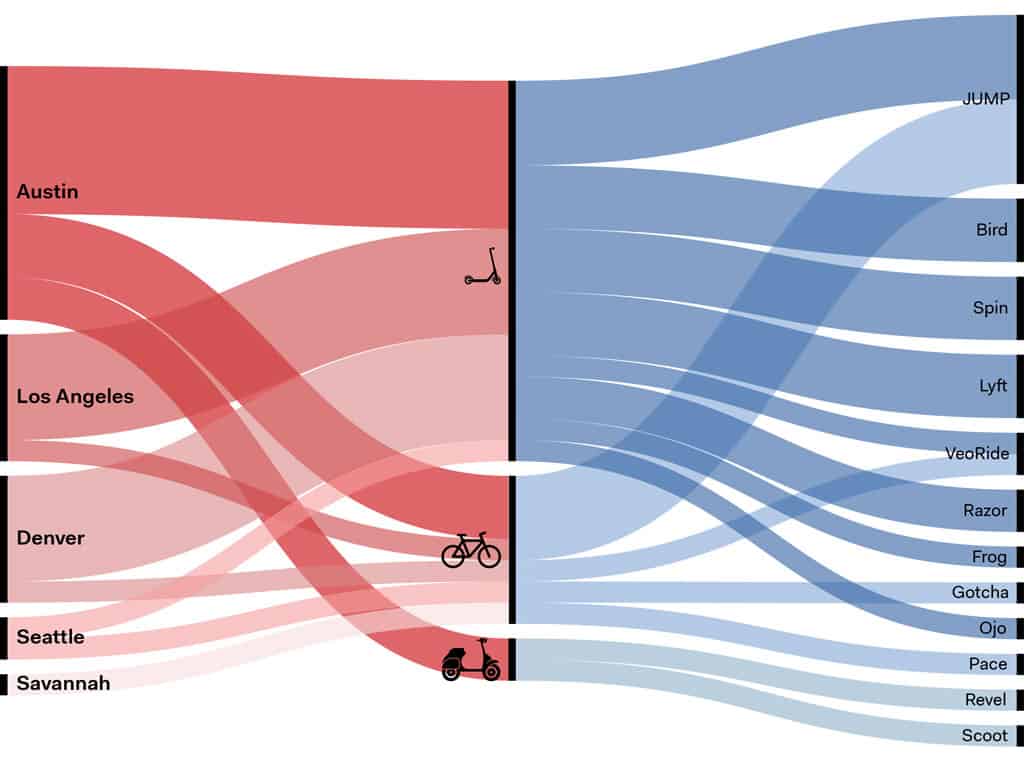
Micromobility services available in selected cities by type and provider. Data source: NUMO (New Urban Mobility Alliance)
Telecommuting on the rise
Prior to the large-scale adoption of home working across the U.S. during the 2020 pandemic situation, a clear rise in telework popularity was already in motion. Between 2001 and 2016, the share of full-time teleworkers more than doubled in the U.S., suggesting that it was already gaining popularity before there was a direct need for it.
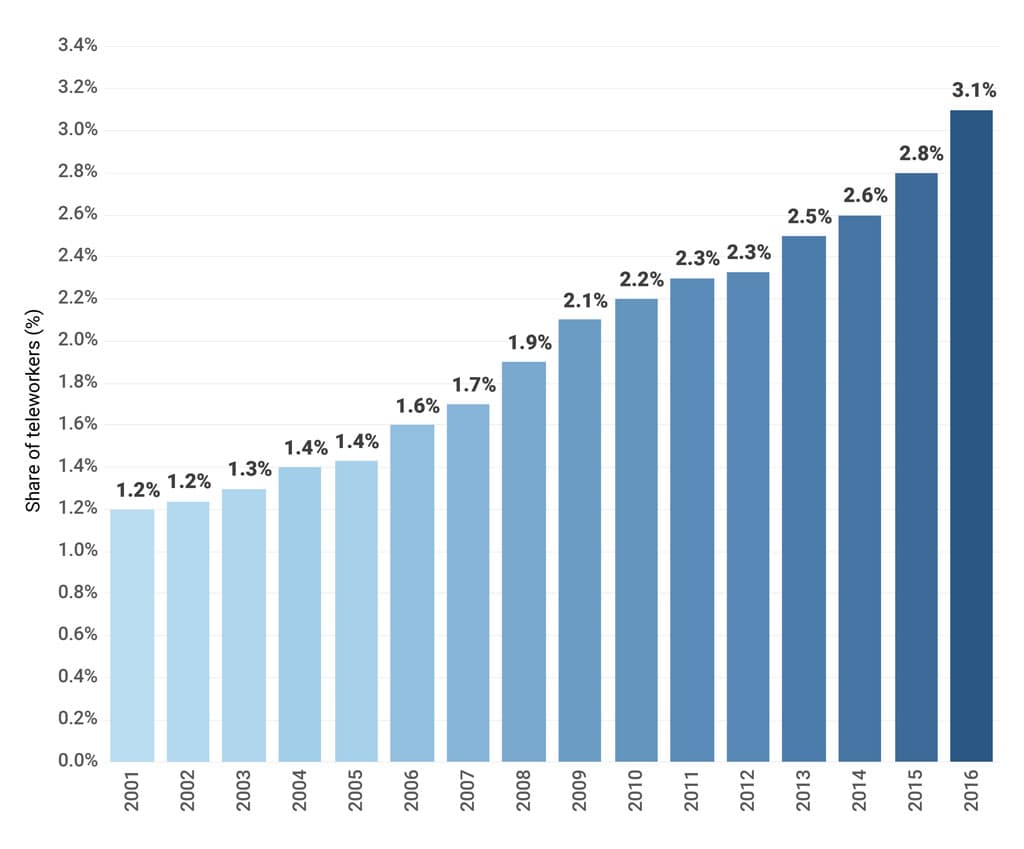 Share of full-time teleworkers in the US, 2001 to 2016. Data source: American Community Survey
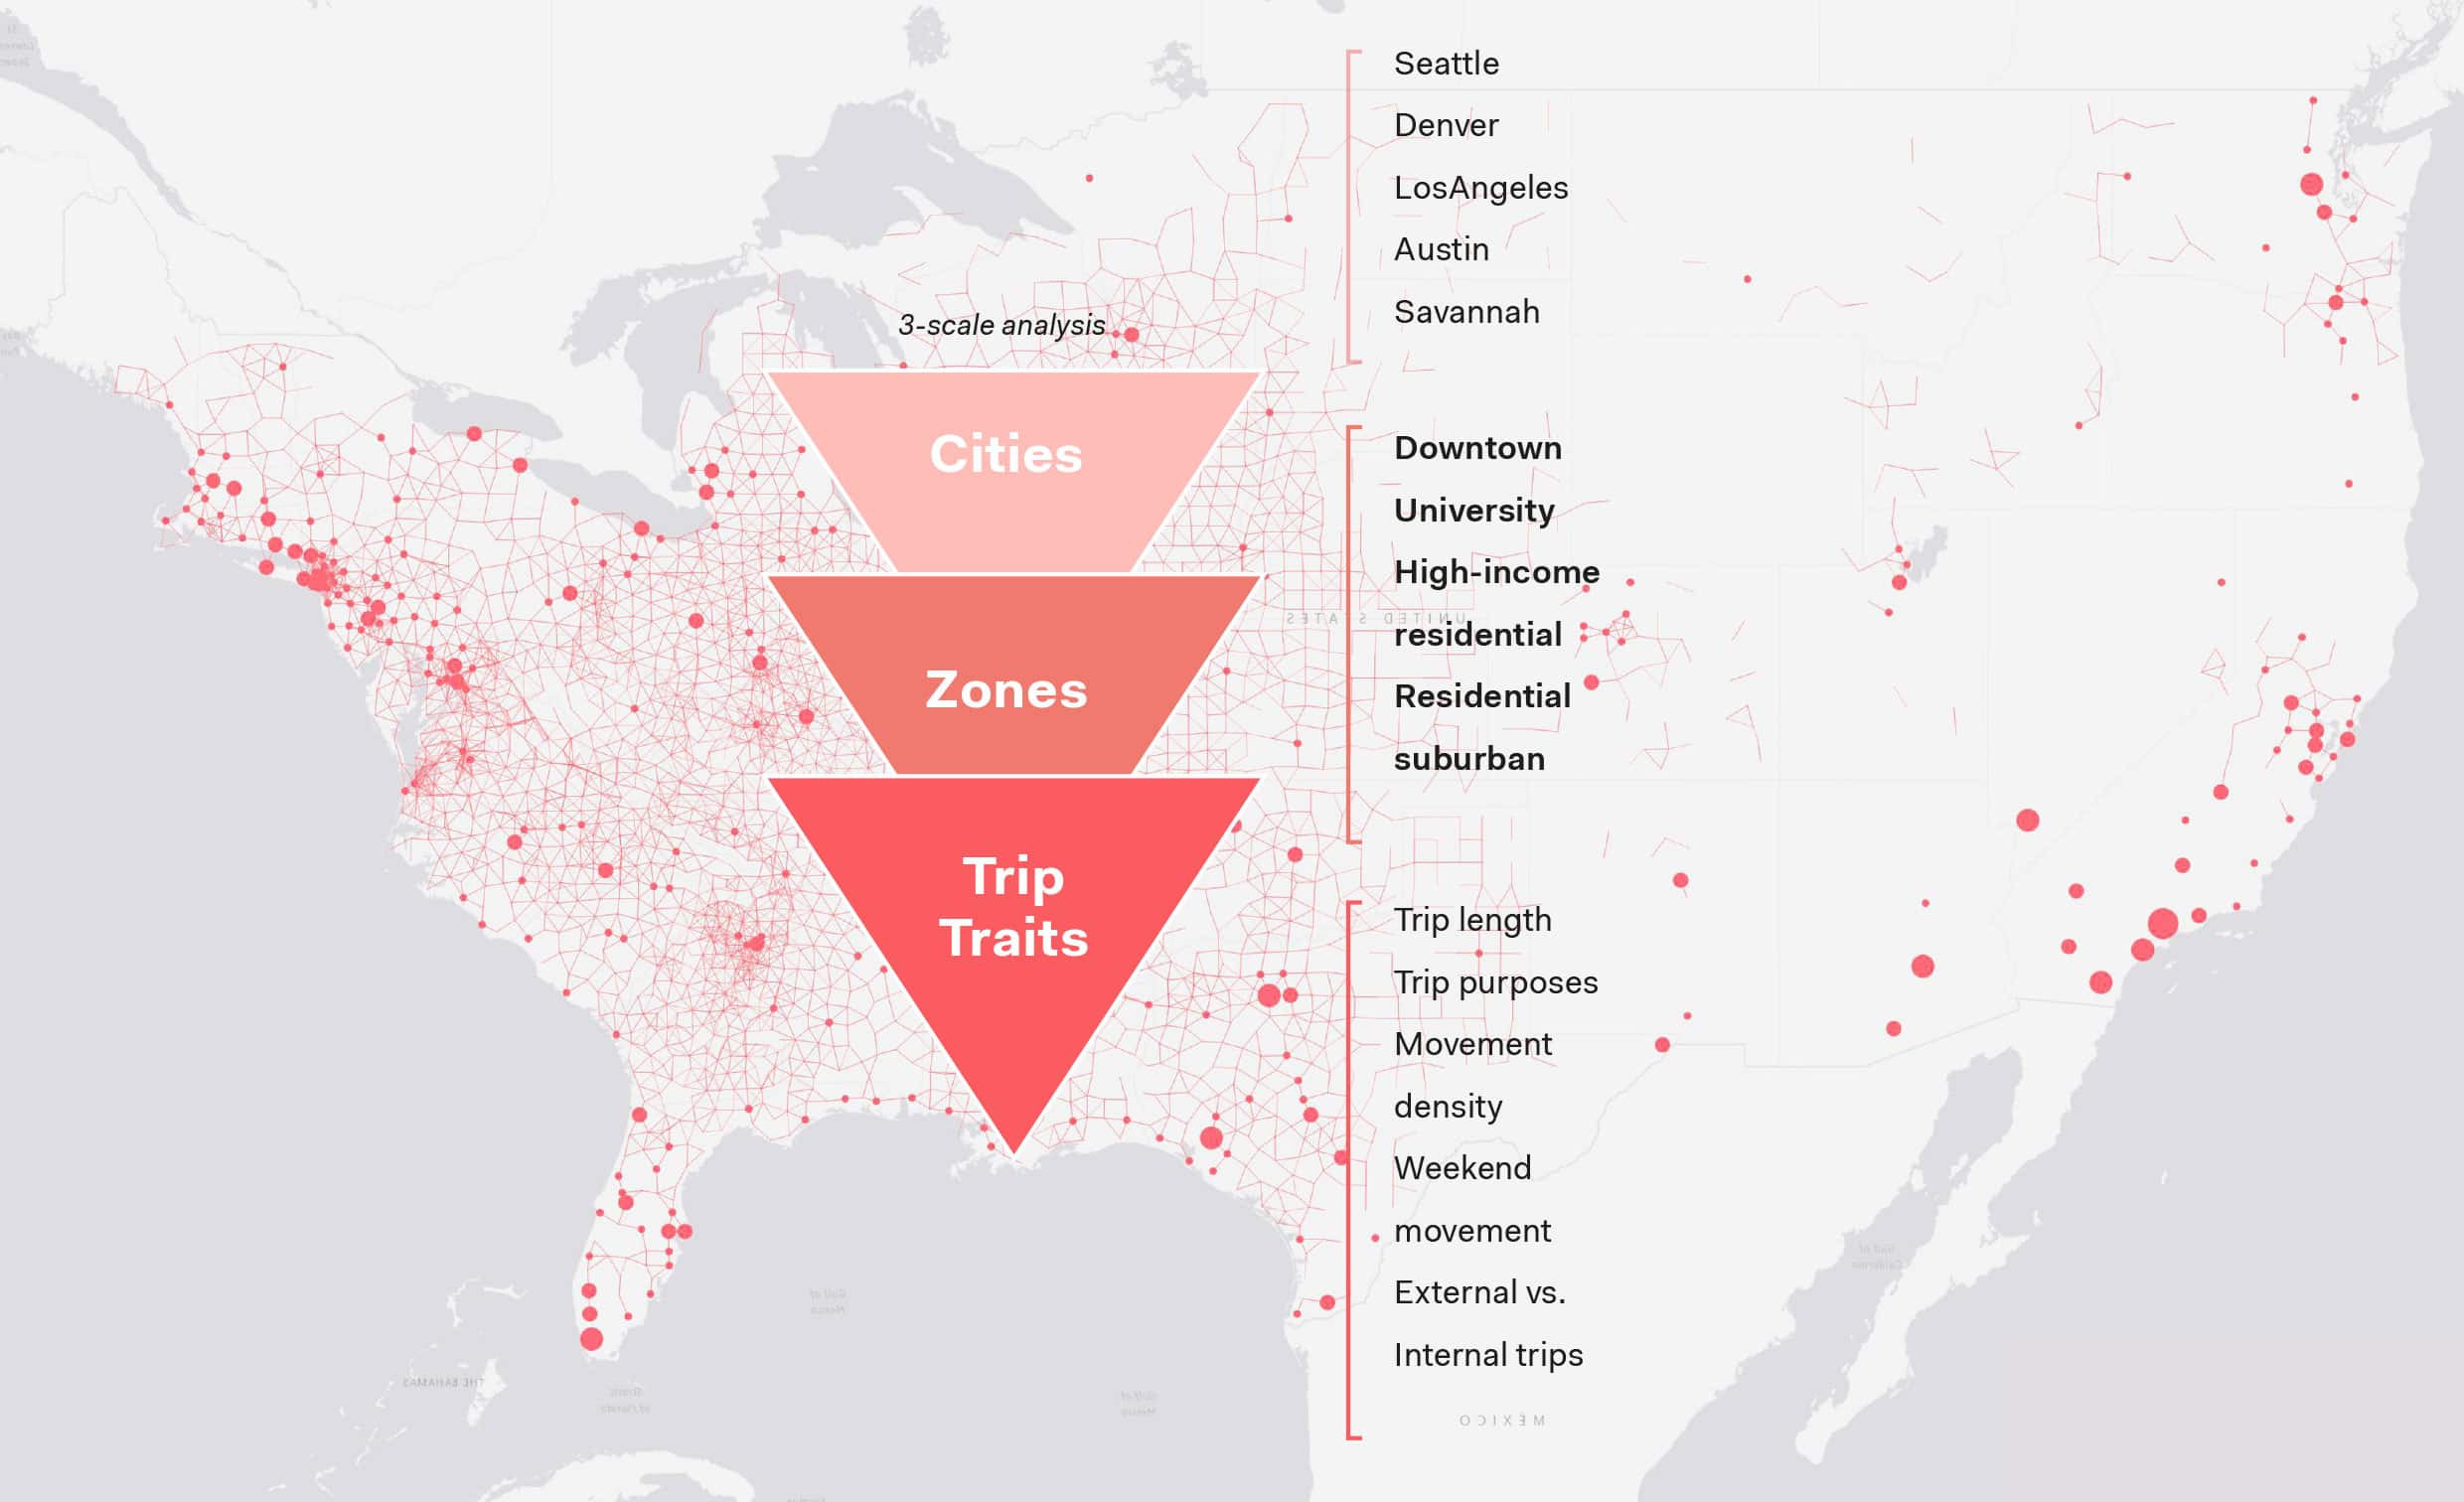

Trip trait 1: Trip Lengths, who’s counting? — What makes us most likely to spend more time moving around?

Trip trait 2: From-To — A purpose-driven trip analysis

Trip trait 3: The density dance — how are movements distributed within our cities?

Trip trait 4: The Sunday/Monday divide — what are we doing differently on the weekend?
