
What cross-cutting trip data from five cities in the U.S. tells us about the overarching tendencies to make shorter and longer daily trips
One of the biggest advancements allowed by trip information collected through big data is the affordance of 24-hour tracking. Analyzing trip distance trends throughout the day for a typical weekday can reveal critical information about overall mobility trends and commuting patterns. Our analysis thus concentrates on two dimensions: the spatial (through zone distinctions) and temporal (developments over time).
If further investigated, this type of data could supplement critical planning decisions. For example, learning that short trips happen more frequently during lunchtime in downtown areas can prompt city councils to invest in infrastructure for alternative travel modes in order to alleviate the energy and time cost burden placed by car traffic. At the same time, the understanding that trip distances made to and from a city’s university zone is higher than the average for similar zones in other cities can alert planners to the need to increase student housing options in that area.
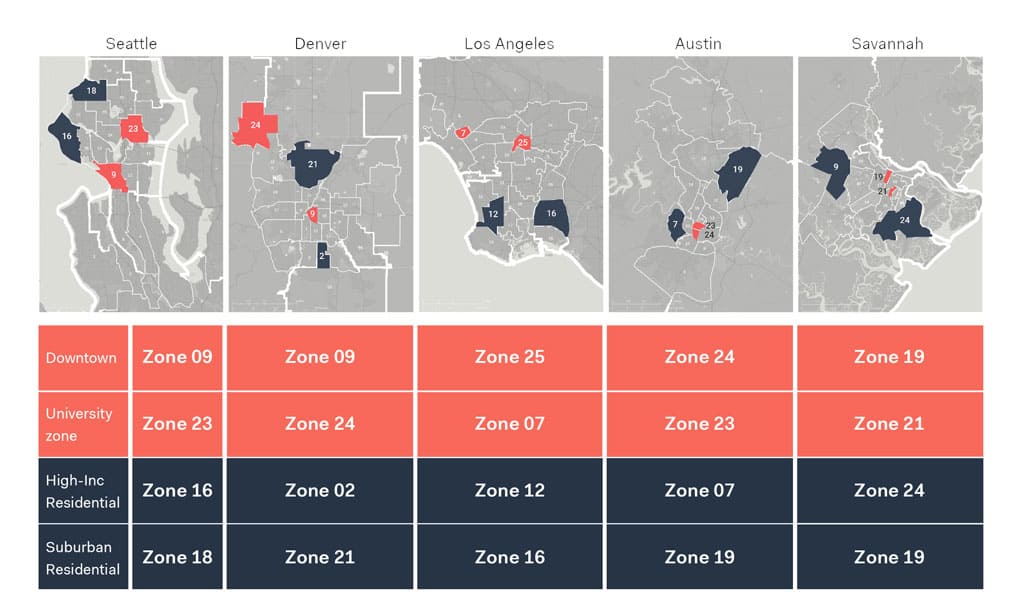
In the following analysis, zone distinctions were based on a number of factors. For each of the five cities under study (namely, Seattle, Denver, Los Angeles, Austin and Savannah), areas associated with distinctive socio-economic profiles and their corresponding travel patterns were identified to create a basis for studying movements in and out of -and between- these articulated zones. The fixed zone typologies identified for each city were two attractor typologies (downtown and university areas) and two generator typologies (high-income and suburban residential areas). These classified zones correspond to a careful synthesis between census-based boundaries and morphological features. The boundary-setting of each zone took into consideration existing physical barriers (such as highways, natural barriers, etc.) and functional organization differences such that each zone is a functional class of its own (e.g. residential, industrial, mixed-use), practically functioning as a continuous and homogeneous area.
Aggregate Mobility Trends
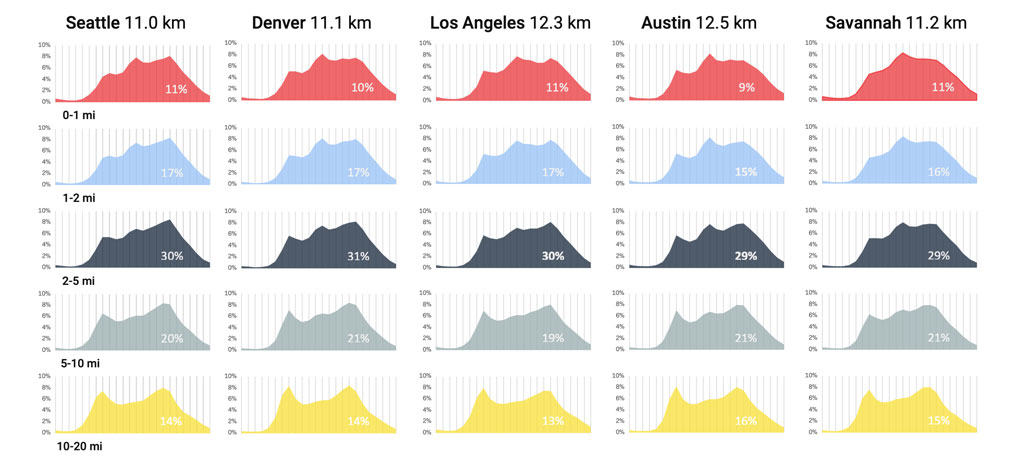
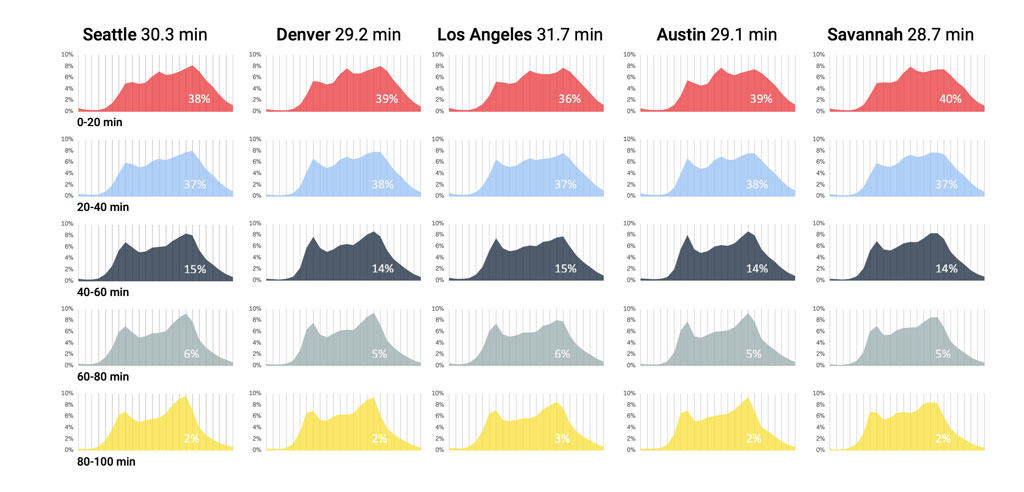
Despite contextual variances, it is interesting that trip profiles for each distance category (shortest: 0-1 miles to longest: 10-20 miles) have very similar trends in all cities throughout the day; as we move from short to long trips, the peak point in the graph gradually moves from center to ends. This means that the percentage of short trips are highest in the middle of the day while longer trips are more concentrated in morning and evening hours. The same trend holds for trip times. However, shorter trip times are more concentrated towards the evening segment of the day as opposed to midday. Trips travelled in Los Angeles and Austin tend to be longer in distance on average, while Los Angeles reserves the highest average trip time of the five cities. Savannah, on the other hand, being a much smaller city, maintains the lowest average trip time. A deeper look at internal variances by city zone allows us to distinguish further trends.
Geographic Variances
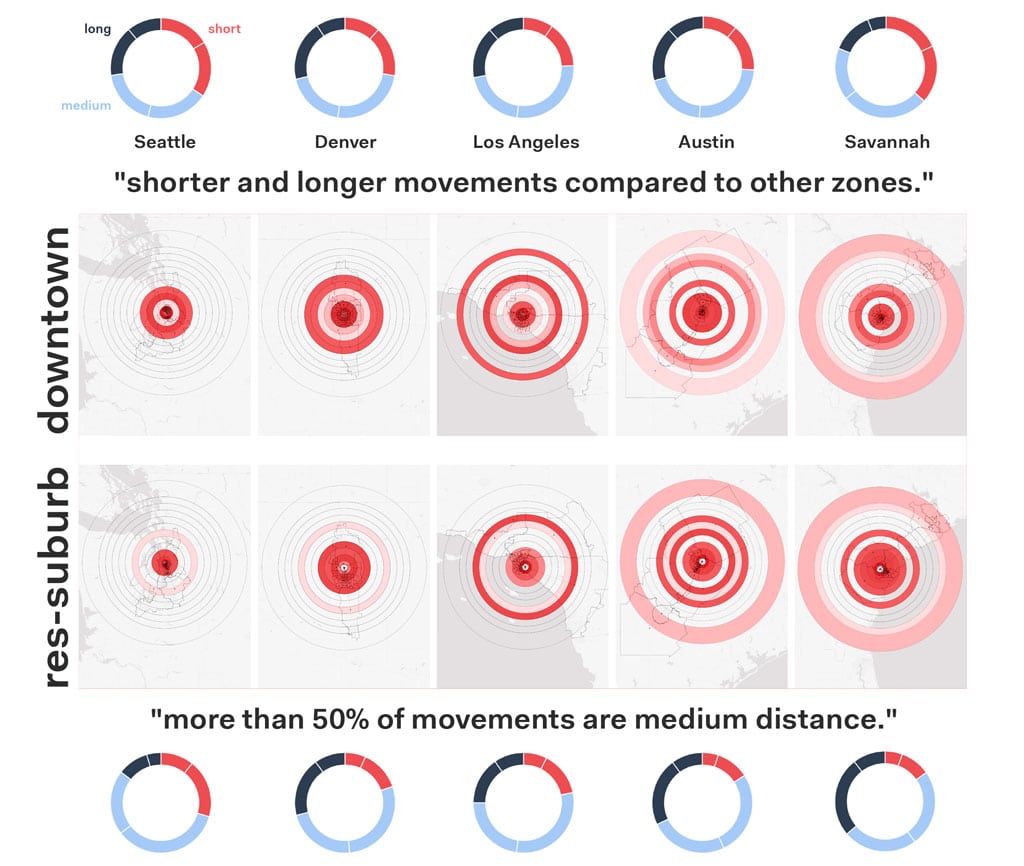
A zone-based analysis of average daily travel distances in each city exposes some pattern distinctions. Furthermore, it confirms the recurring phenomenon of longer distances travelled in the morning hours in all areas, whereas the afternoon trip concentration is more widespread. Additionally, the analysis shows that the greatest concentration of trips does not necessarily correspond to trips made to and from downtown areas in all cities. Though we expect that downtown trips are highest in length, since they attract more movements from farther away, the data reveals that this is only the case in the cities of Seattle and Los Angeles.
Looking specifically at short trips (those falling in the range of 0-2 miles), we deduce that the highest percentage of short trips occur in the midday hours, i.e. during lunchtime. Spatially, we see that this increase is less accentuated in residential areas than it is in downtown and university areas. To take an example, short trips in Seattle increase by factors of 2 and 3 in residential areas during lunchtime, whereas in university and downtown zones they multiply by factors of 5 and 7, respectively. In Austin’s university district, almost 50% of trips made during lunchtime are short trips, pointing to a high transformative potential to non-motorized transport.
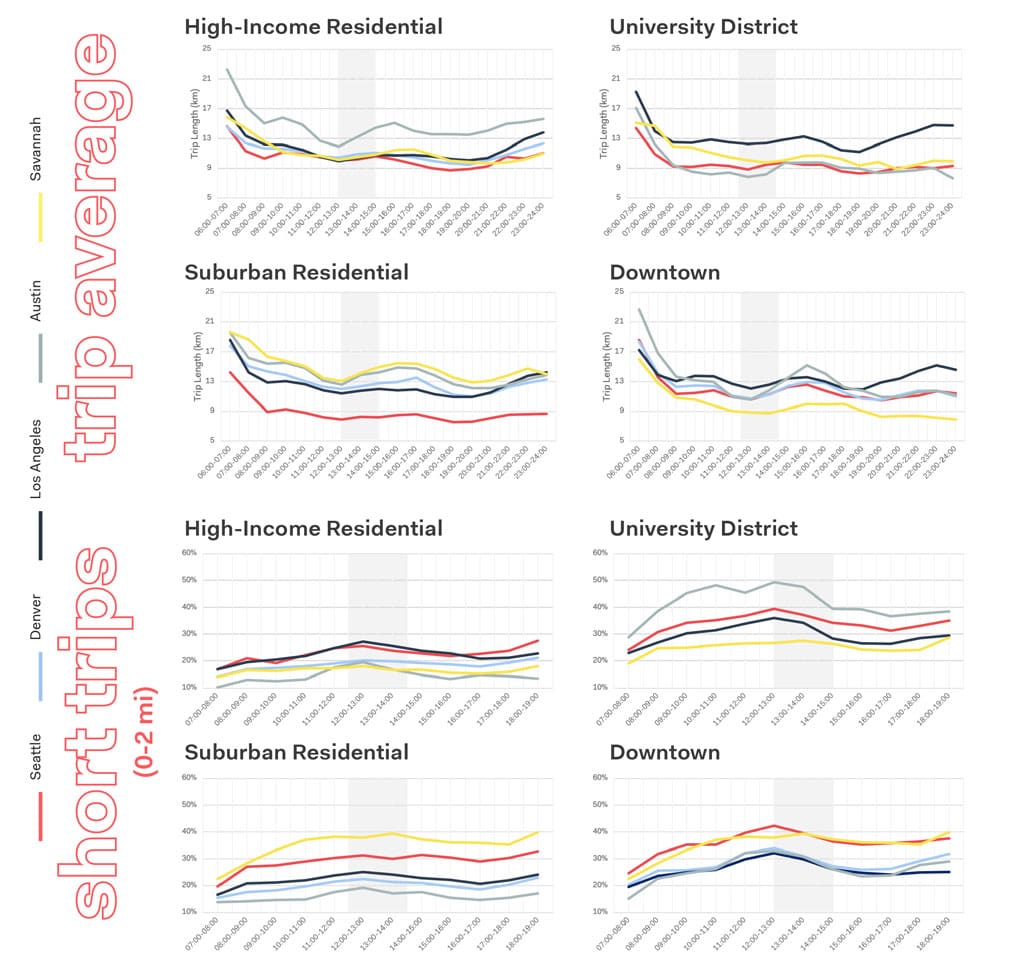
A comparative assessment of short, medium and long trips by zone reveals that downtowns have a higher concentration of short (0-2 miles) and long trips (10 miles and more) than other areas. Mid-length movements (2-10 miles) are conversely more pronounced in the residential zones, accounting for more than half of all trips in all five cities.
Demographic Variances
Studying the relationship between typical trip duration and diverse population groups can help us understand the positionality of each group based on their income levels. This also includes looking at where people of different income groups live to understand how urban form affects trip times.
Taking a closer look at the demographic distribution, we find that there are some clear correlations between certain socio-economic profiles of travelers and trip time distribution. Data shows that in most studied cities, longer trip times tend to be associated with larger households, lower-income households, and a high private modal share in these respective areas. In other words, with a few exceptions, trips tend to be longer for travelers from large household sizes, of lower income groups and in cities that rely most highly on private car trips. While the first two elements may be linked to suburbanization and longer trips travelled between the suburbs and the city (high trip time due to distance), the third trait may indicate car-induced traffic (high trip times due to congestion). Population groups in these categories are particularly time-deprived with respect to their counterparts.
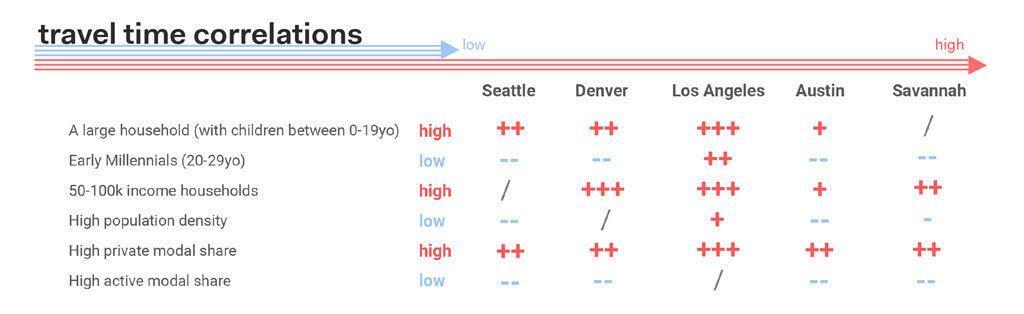
Moreover, city data analysis shows us that there is a negative correlation between trip times and younger travelers – particularly part of the millennial age group (20-29 years old) – as well as people living in areas with high population density, and high active modal shares. In line with the ‘Back to Downtown’ mobility trend, data shows that younger people who are more likely to live in the city and not be tied to larger families, are more likely to enjoy lower travel times. At the same time, almost counter-intuitively, travelers living in high-density areas travel faster. This could simply be due to home-work proximity, since jobs are mostly concentrated in dense city centers, and the wider offering of various transport modes in busy areas. In the same vein, high-density areas make travelling by active modes such as walking and cycling easier given the proximity of destinations and the higher degree of walkability owing to inner-city planning.
Out of the five cities, Los Angeles seems to stand in clear contradiction to the general trend on several accounts. In Los Angeles, travel times tend to increase with all factors, save active modal share with which there is no correlation. It is interesting to note that even younger travelers and high-density populations are more likely to sustain longer travel times. However, due to the polycentric morphology of Los Angeles city, movement patterns are more spatially varied than the other cities under study. With Denver as well, another polycentric city, there is no correlation between population density and travel times.

Image credits: Sean Pavone / Shutterstock.com