Electric Mobility:
towards zero emissions
Here we attempt to shed light on this rapidly evolving subject, identifying obstacles and highlighting the ways to overcome them as well as the opportunities that may arise along the way. In line with transport planning’s multifaceted nature, we address this theme dividing the book into focus areas defined by project scale, from regional infrastructure to micro-mobility. The environmental aspect obviously plays an important role throughout the entire discussion, as it is an inseparable component of the electric mobility revolution.
In an effort to be as unbiased as possible we look at this delicate and articulate topic with sceptic eyes, boldly questioning even the most widely accepted truths. The future of road transport will undoubtedly include more electric vehicles, which will constitute a fundamental element of the sustainable future we are working to build.
E-mobility today is mainly about vehicle-technology and battery efficiency
A Brief History of the Electrical Revolution
Given the low penetration of e-vehicles these days, it is hard to believe that electric vehicles were the dominant automobile form in many cities for some time.
The beginning of electric mobility dates back to the experiments of the American inventor Thomas Davenport, who in the 1830’s had a model of a rail vehicle driven by an electric machine. Steam power and electricity were the energy that got vehicles rolling in those days. Another milestone in the history of e-mobility came in 1900, first shown at the World Exhibition in Paris: the Lohner Porsche (50 km/h and 50 km range). The earliest record of an electric bicycle prototype dates back to 1895. Launched in 1915, the Autoped had wide appeal, with everyone from suffragettes to postmen using them. After the rise of the combustion engine with Henry Ford’s Model T, electromobility was pushed aside into a market niche. The mass-produced passenger car fabricated on the assembly line became instead the main mode of transport. As a result some prototypes of electric cars never went on sale. One example was the Amitron of the American Motor Corporation in 1967. This car became famous for models such as the Pacer (80 km/h and 240 km range) which was already following the technological demands familiar to nowadays. Only from the ‘90s did electric mobility gain new interest, mainly for the growing air pollution due to the mass distribution of combustion-powered vehicles, and increasing efforts to handle climate change. In 1999, the new icon of the modern wave of e-mobility hits the market: the Tesla Roadster – the first production car from Tesla Motors. The company founded by Elon Musk is currently preparing to revolutionize the world of mobility, just as Apple once revolutionized the tech industry with its Iphone.
The Rise of the Electric Car
Electric cars are not an invention of the 21st century – or the 20th – although they might be associated with the frontier of technological innovation.
The first electric car was built in 1884 by Thomas Parker using lead-acid batteries. In the early years of the ‘90s they represented 38% of all circulating vehicles, reaching 33,842 units in 1912. These vehicles prerogative to the higher classes had a max. speed of 20-30 kph and a range around 60 km. Interestingly enough, the main reasons to purchase an electric car at that time were entirely similar to nowadays’: reduced noise, simplicity of use, and improved comfort. The increase in oil prices and the growing environmental concerns are fueling a proper “electric rush” that started in the ‘90s and is now proceeding at full speed.
Electric cars today represent 2.5% of sales and 0.3% of the circulating fleet worldwide, with more than 7.0 million vehicles sold at the end of 2019. 55% of global electric car sales in 2018 happened in China. Sales globally took a downturn in 2019 as a result of the rolling back of incentives from some governments. It is not the first time that EV sales slow down, as it is common for sales to peak right before the ending of subsidies and diminish right after.
Why Go Electric?
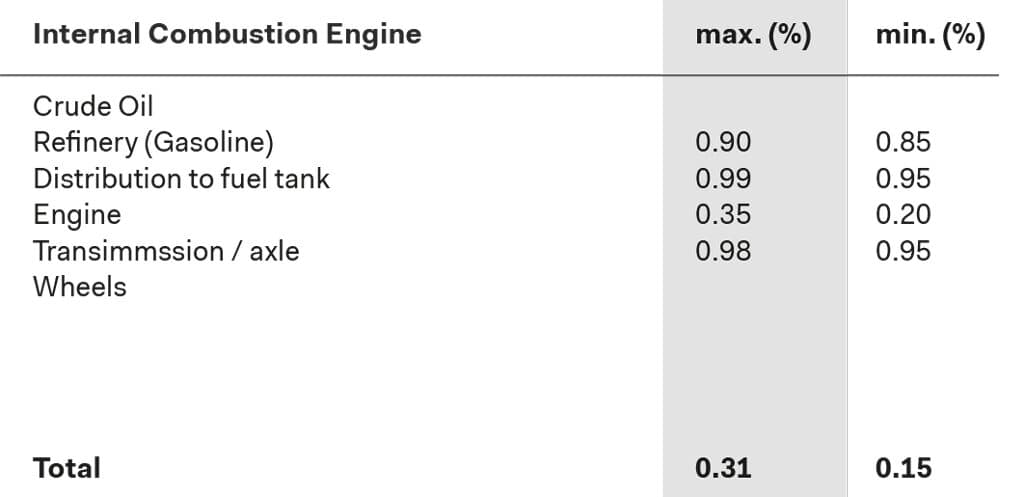
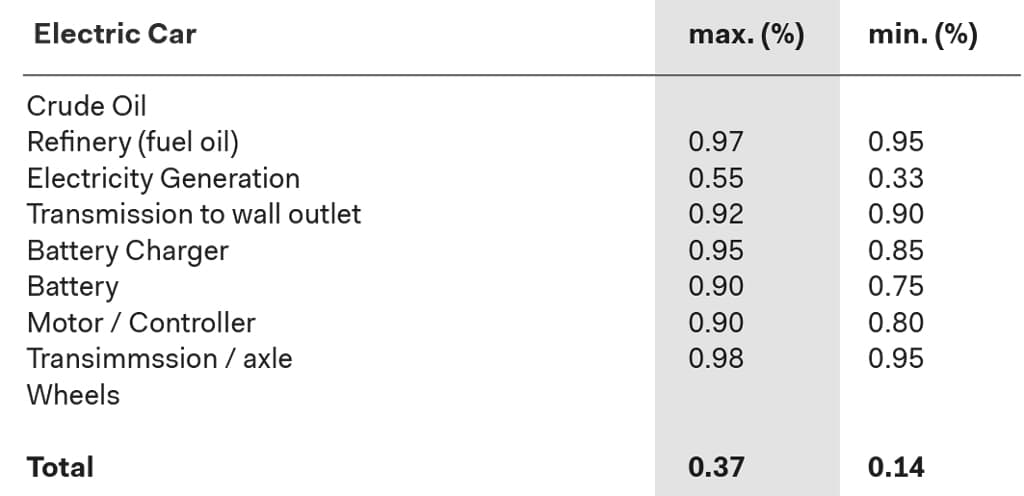
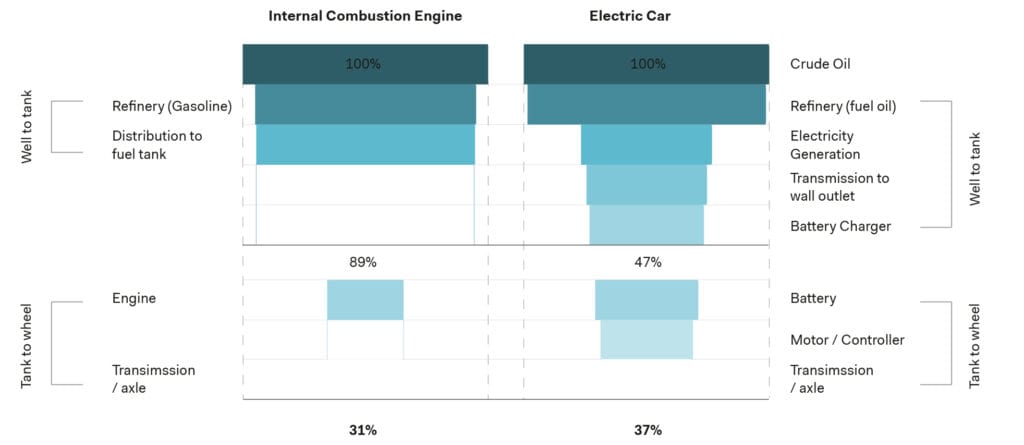
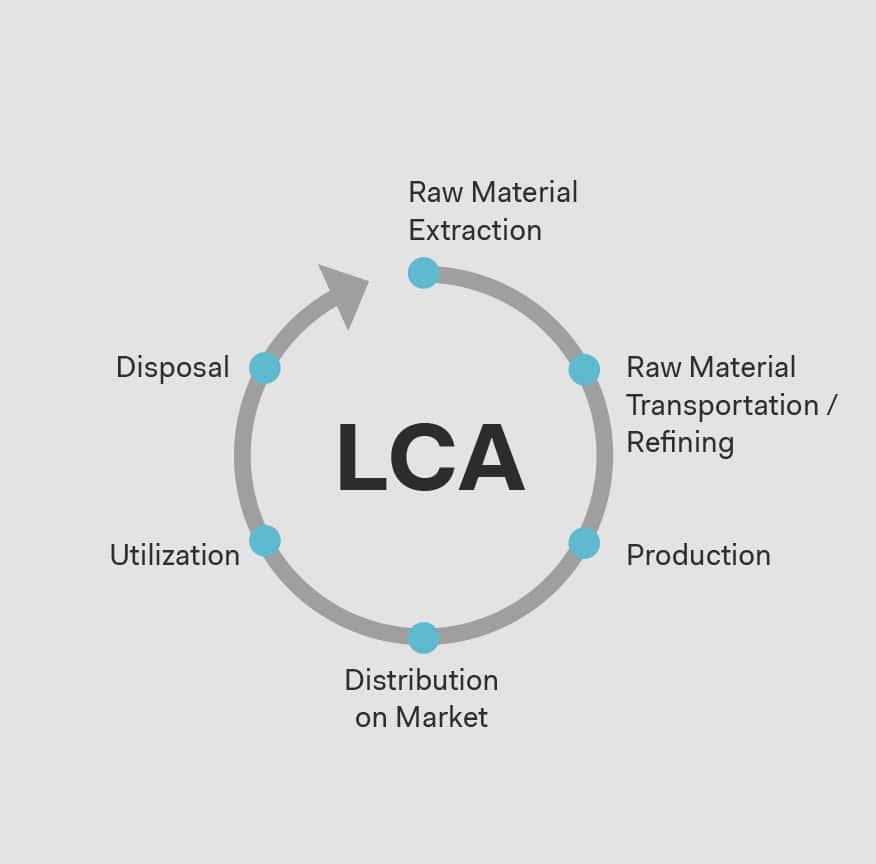
Electric motors on the other hand yield much greater efficiency, exceeding values as high as 80-85%. This means that given the same amount of energy, an electric vehicle will go twice as far as an ICE vehicle. The reason electric cars don’t provide the same range as gas and diesels lies in the low energy density of the batteries. Much progress has been made in battery technology but we are still far from the density of liquid fuels. After all fossil fuels are the result of enormous amounts of pressure and heat applied to organic material over millions of years, and therefore, contain a lot of potential energy. For reference, gasoline’s energy density is 12,500 Wh/kg, while lithium-ion battery energy density is 240 Wh/kg at best. Consequently, the vehicle will have to mount a very large and heavy battery to the vehicle in order to provide a satisfying driving range. Having said that, the efficiency of an electric vehicle is so much higher that it doesn’t need to load the same amount of energy to travel the same distance.From an energy point of view the most complete comparison between vehicles is the Well-to-Wheel analysis, which considers all energy expenses from the extraction / production of the main energy mean to its utilization.
The chain of processes for internal combustion vehicles starts with the extraction and refinement of oil, accounts for transportation, and ends with on-site consumption. All along this sequence of passages there are energy consumptions and inefficiencies that contribute to the final energy conversion rate. This means that even though burning one litre of gasoline always releases the same amount of energy, this is just the last step of a larger process that includes all the expenses that happened upstream, in addition to the inherent losses of combustion engines. Accounting for greater expenses means the overall efficiency will be lower. At the end the Well-to-Wheel efficiency for a combustion car hovers around 15-30%. The element exerting the biggest impact on the final efficiency is the thermal engine onboard the vehicle, with its 30% efficiency, while all other processes have efficiencies in the high ’90s.For electric vehicles the reasoning follows the same principle, but applied for electricity. It begins with the power plant’s efficiency, then follows electricity along all of its path: through power lines, transformers, the charger and the battery. Being comprised of mostly electrical equipment the average efficiency of components is generally high, the weakest point being the power plant.
The final Well-to-Wheel efficiency for electric vehicles is more or less in line with that of thermal vehicles, ending up between 14% and 37%.The biggest difference between the two systems is that one requires few passages (producing liquid fuels and delivering it) while in the other there are many energy transformations that eat into the overall efficiency.The highest and lowest values differ by quite some margin because of the relatively high degree of uncertainty surrounding the subject. Despite an effort to be as accurate as possible all values in the calculation are averages and assumptions to discount the fact that the same processes may be carried out in different ways across the globe. For example, different nations will produce electricity with different degrees of efficiency, depending on the nation’s technological progress. Electric power plant efficiency may be as low as 30% or as high as 60% depending on plant age and thermodynamic cycle. We therefore propose a minimum / maximum scenario to maintain perspective in such a complex task.
The Environmental Impact of Zero Emission
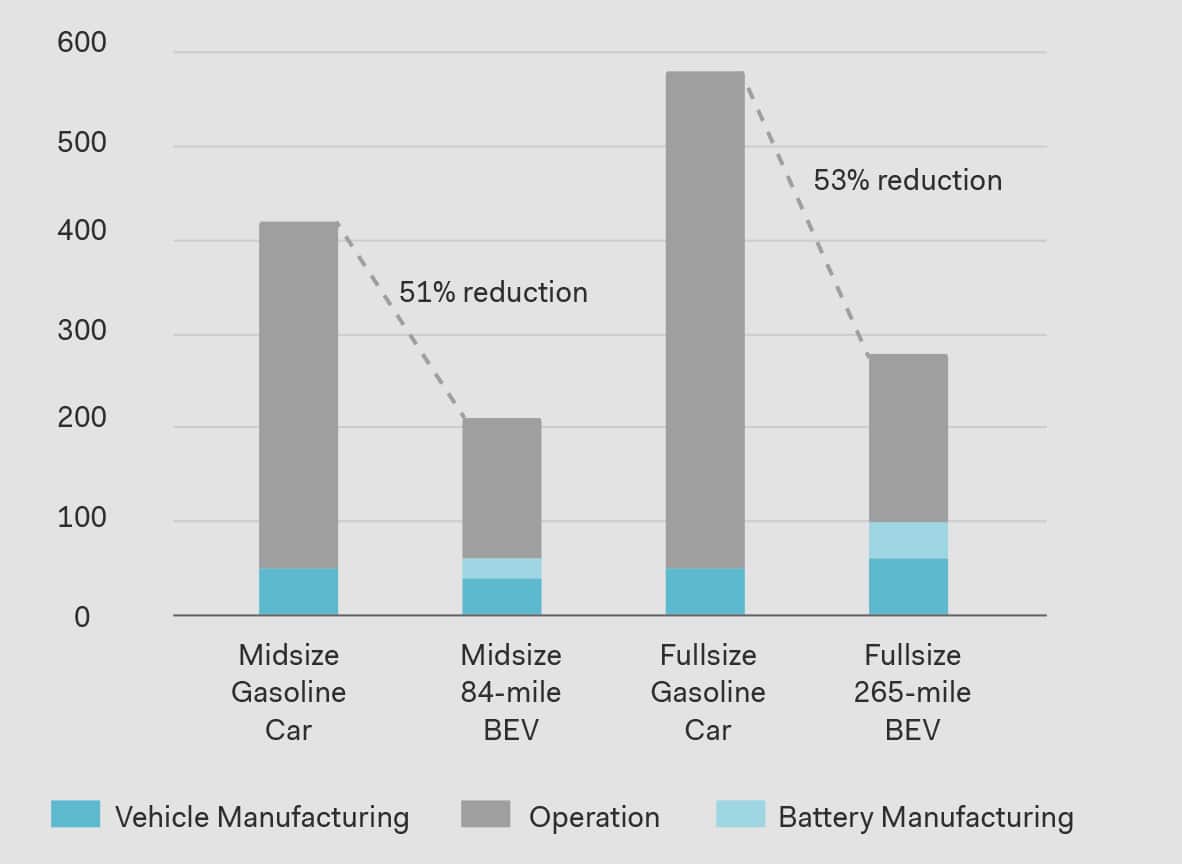
Nonetheless, there is something else to consider: while the pollution of ICE vehicles depends on the machine itself, for EVs it depends on the electricity grid’s energy mix. That is to say what primary sources are used to produce electricity. Renewables are the clear leaders here but fossil fuels still stand a chance provided adequate pollution-limiting strategies are implemented. As a consequence it is crucial to know every nation’s electricity source in order to correctly estimate the environmental impact of an electric vehicle. In China, for example, coal accounts for about two thirds of the total electricity production, an inheritance of a great expansion in the early 2000s. Even though it is investing heavily in clean sources like solar, wind and nuclear, coal firing is destined to maintain an important role in China’s energy supply for several years due to its inexpensive nature, and to some coal plants being recently built. Within the US itself there is great variance among individual states: for example, California’s electricity grid has a good share of renewables, while Hawaii still relies heavily on fossil fuels. Coal is a big deal in more than just China’s energy system: according to data from the IEA almost half of the world’s electricity is still generated from burning coal.

Average vehicle emissions with Hawaii’s electricity grid

Average vehicle emissions with California’s electricity grid
Data sources: Union of Concerned Scientists (2019)
The Bottom Line
From WtW to LCA
Implications of Lithium-Ion Battery Production
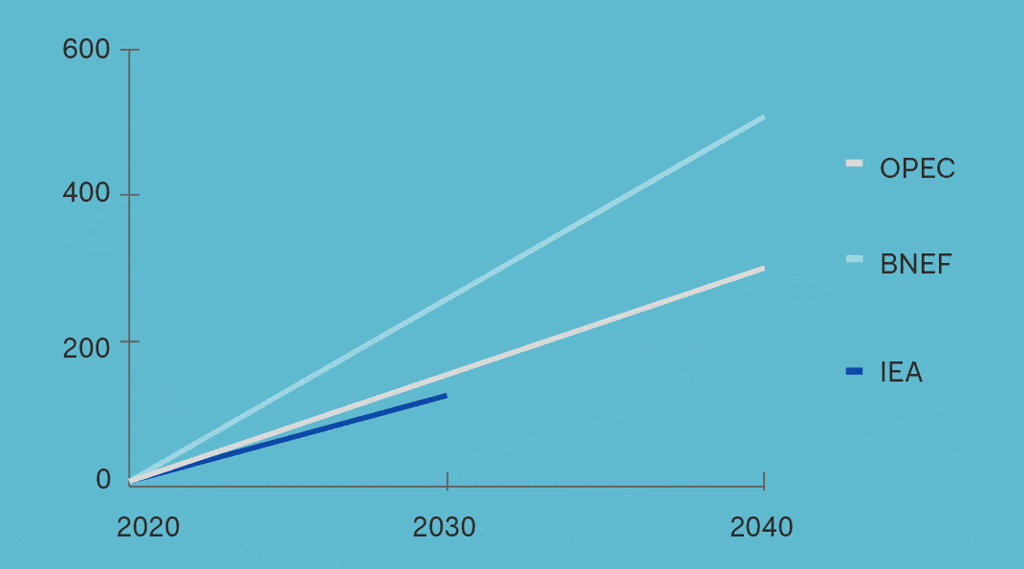
Expected Trends and Forecasts
In the search for new ways to store energy, the most abundant element in the universe could give us a hand.
We used to think of electric vehicles as powered by batteries, but this is not the only way to store energy. Hydrogen has been strongly advertised for years by the supporters of the so called hydrogen economy, a concept where hydrogen substitutes fossil fuels for uses such as transportation and heating.
The benefits of using hydrogen as an energy vector are considerable: if burned it produces no toxic gases or CO2, but only water vapor, which is also the only by-product of hydrogen fuel cells. Its use in thermal engine, though, is not a good use of this resource: the combustion of one unit of mass would release more energy than a fossil fuel, but because hydrogen is a gas its extremely low density actually leads to an inferior energy release. The use of hydrogen in electric vehicles is a lot more promising. To harness its power fuel cells are used. These are chemical devices that combine stored hydrogen with oxygen from the atmosphere to generate electricity.
Fuel cells are a lot more convenient than batteries, as a tank can be filled in a matter of minutes. For this reason hydrogen would be even better suited for long-haul truck use. Being so heavy and needing to travel such long distances, trailer trucks must be equipped with considerably large batteries, in the order of 500 kWh or more. Even with the fastest chargers commercially available it would take hours to replenish an entire charge. Were an electric truck to be equipped with a Hydrogen fuel cell it would only need around 15 minutes to refuel. This makes the case for hydrogen more compelling for trucks.
The reason hydrogen is not widely in use already is that producing it requires huge amounts of energy. There are two main processes for that: steam reforming and electrolysis. The former extracts hydrogen from natural gas at high temperature, but the chemical process creates large amounts of CO2, while the latter uses electricity to separate water into hydrogen and oxygen atoms. Hydrogen production through electrolysis would work best with renewable energy, as it wouldn’t make much sense to generate electricity to produce hydrogen only to convert it back to electricity. [more]
The Strange Case of The Orkney Islands
One remarkable example comes from the Orkney Islands, in the north of Scotland. Electricity production there is already entirely renewable (wind, tide and wave) and, instead of switching off power plants, the local administration opted to harvest the extra energy and store it in the form of hydrogen. The power to do this is provided by community-owned wind turbines, which also do much to create jobs and fund local services. The stored hydrogen will be available at a later time for such uses as heating and transport. The project, named BIG HIT (Building Innovative Green Hydrogen Systems in Isolated Territory), is co-funded by the European Union and aims to demonstrate the scalability of this technology and the possibility to replicate it in other isolated or constrained territories.
Regional Scale
Vehicles Consumption
A Database for Electricity Demand
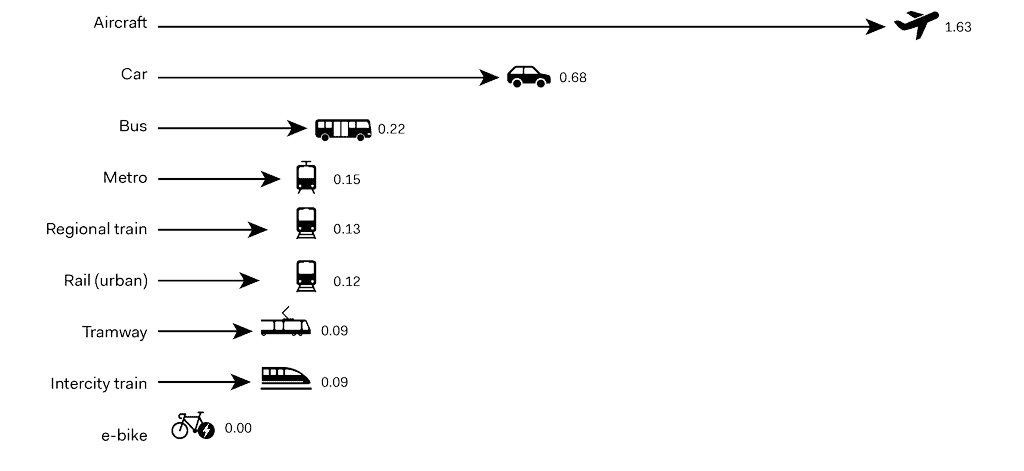
A fundamental change within the transport sector which is the largest consumer of oil, 53.4% of overall consumption, is essential in order to transition towards a low-carbon economy. Since road transport is responsible for 76.5% of the oil consumption, a wide scale deployment of electric vehicles charged with electricity produced from renewable sources can significantly contribute to the reduction of green house gas emissions and air pollution in long term and improve resource efficiency.
In order to meet the extra electricity demand, additional electricity generation infrastructure should be considered on local, regional, and national levels.
The diagram is a result of average electricity demand from different data sources for different modes of transport.
Electric Vehicles Impact on Emissions
The green gas house emissions of electric vehicles will continue to be lower than conventional internal combustion engine vehicles, but the extent ultimately depends on the power generation sources. Research shows that emissions savings are significantly higher for electric vehicles used in countries where the power generation mix is dominated by low-carbon sources; on the other hand in countries where the power generation mix is dominated by coal, hybrid vehicles have lower emissions than electric vehicles.
The diagram is a result of average CO2 emissions from different data sources for different modes of transport.
We’ve Talked About Vehicles, Now Let’s Talk About Cities
Taking the conversation to a broader level we expanded the scope of the analysis to an entire urban environment. As a testbed for this study we designated the city of Milan. Taking advantage of comprehensive data from our transport models we ran a simulation to estimate the practical implications of a complete public transport fleet electrification along with a growing share of private electric vehicles on the roads over a fifteen years timeframe. The situation presented is a “now and then” scenario in which we compare two portraits of the same city at different points in time.
Our focus is on the environmental aspect of the electrifying process, with an eye on the consequences for the urban realm. In particular we are looking at CO2 emission reduction and an attempt at monetizing the deriving benefits. Because expressing environmental benefits in terms of tonnes of carbon dioxide is far from the average person’s imagination, this last step acts as a middleman in the process of translating a seemingly abstract concept into something easier to visualise.
Milan’s public transport network already enjoys a significant amount of electrification. As of now, thanks to four subway lines and tens of tram lines, 70% (ATM, 2017) of passenger movement is currently electric. Now all attention is focusing on the bus fleet, the only non-electric piece of the puzzle, with the local transport operator, ATM, going through a complete overhaul of its road vehicles. It aims to only operate electric buses, and therefore operate 100% electric, by 2030. The first steps have already been taken, with 50 battery electric buses on the road, new generation trolleybuses being delivered and orders in place to complete the rest of the fleet. The aim is to provide Milanese citizens with a cleaner and quieter means of transport. To top it all off, the company is buying solely renewable electricity.
Milan traffic model, traffic flow chart, Morning peak
New Potential Uses
More Than Vehicles, Batteries On Wheels
Most electric vehicles are plugged to a charger whenever parked. The intention, obviously, is to keep the battery charged, but a great advantage of electric power is that it can be sent in both directions. If it was possible for parked vehicles to give energy back to the grid then they can be used as a distributed battery that can offer quick response to moments of peak demand, giving power plants the time they need to adjust their output. It also represents an opportunity for vehicle owners (both public and private) to generate extra profits, or recoup some expenses, by selling electricity at peak-time fares while charging at night with lower fees. The technology that allows this technique, known as vehicle to grid or V2G, is being tested worldwide, along with an evolution of the relative regulatory framework. V2G can also turn vehicles into storage capacity for renewable electricity, since renewable energy is not available at will and must be either used or stored.
Critics of V2G claim that the additional charging and discharging cycles will have a negative impact on battery life. However, a smart control algorithm with an objective of maximizing battery longevity can reverse this (Uddin et al., 2018). Although in its nascent phase, V2G technology should be considered in new developments as we shift our mindsets towards a dynamic, connected electric era.
Zero Emission Zones
Another way to take full advantage of pure-electric vehicles would be to create Zero Emission Zones in sensitive parts of the city. This is nothing revolutionary, as we’re seeing municipalities taking such action restricting access to the city centre, but why not extend the idea to other parts of the city?
According to recent claims most European cities want to ban fuel burning vehicles from their streets altogether, but the timeframe for these goals is decades away. And with good reason: a sudden ban would be simply outrageous. So as a transition strategy, while waiting to reach that condition, we could start tackling the most critical parts of our cities, or the ones we most care about.
If restricting traffic sounds like too harsh a solution, time-limiting could be an option. All traffic may be allowed during peak times to allow the movement of people and goods, while restrictions could take place at night to foster silence and wellbeing.
The United Kingdom is a leading example in the practice of Low and Zero Emission Zones.
In April 2019 the city of London introduced the Ultra Low Emission Zone that covers the same area of the previously enforced Congestion Charge Zone, with the purpose of charging fees on all vehicles that do not meet certain pollution criteria. The city saw a reduction in emissions of 20% in the period from April to July.
Oxfordshire County Council and Oxford City Council are taking the issue a step further, and and are proposing the creation of a Zero Emission Zone in the city centre. The area, called the Red Zone, consists of a few selected roads to which access is permitted toll-free to zero emission vehicles, while other vehicles will have to pay a charge that will be increasingly high through the years. The program is set to begin at the end of 2020 with an eight-week “soft launch” phase, during which no charges or penalties will be applied, to ensure a smooth transition during the city’s busiest period. Moreover, permanent exemptions and discounts are provided for residents and businesses.
Other Clean Air Zones have been established or are expected in several other cities in the U.K. These zones, born with the intention of improving air quality by discouraging the use of older, more polluting, vehicles. Five cities have been mandated by the Government to introduce a Clean Air Zone: Birmingham, Leeds, Nottingham, Derby and Southampton, while others have been required to conduct feasibility studies.
Parking Guidelines
EV parking spaces require special attention to make sure they are easy to find and operate.
When electrifying a parking lot or garage some questions arise naturally, for example: how many chargers should be provided? Where should they be placed? What power should they provide?
Trying to answer these questions is a complicated task by itself, let alone if this were in a young and rapidly evolving market. Still, an answer must be found. To do that we put together a series of principles that constitute the good practice of EV parking design.
Where to locate them?
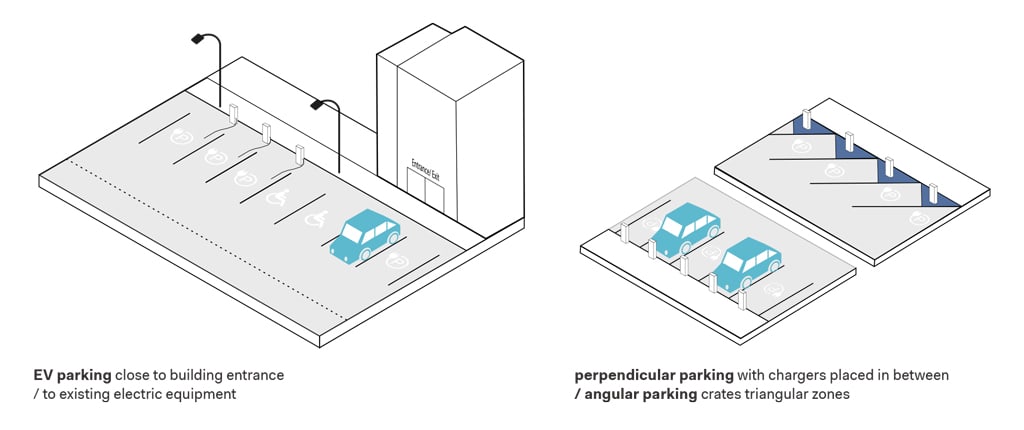
• To comply with disability requirements, EV parking places should be close to building entrance
• Protection from weather increases attractivity (indoor garage, solar panel canopy)
• To minimize installation costs, charging points should be clustered as close as possible to distribution cables and sources
• In perpendicular parking, chargers should be placed strategically to serve multiple vehicles and accommodate the vehicles’ different electric port positions
• Angular parking creates triangular zones between vehicle and curb than can be used to locate charger
How to minimize obstacles?
• Adequate space should be provided to the user to handle the charger
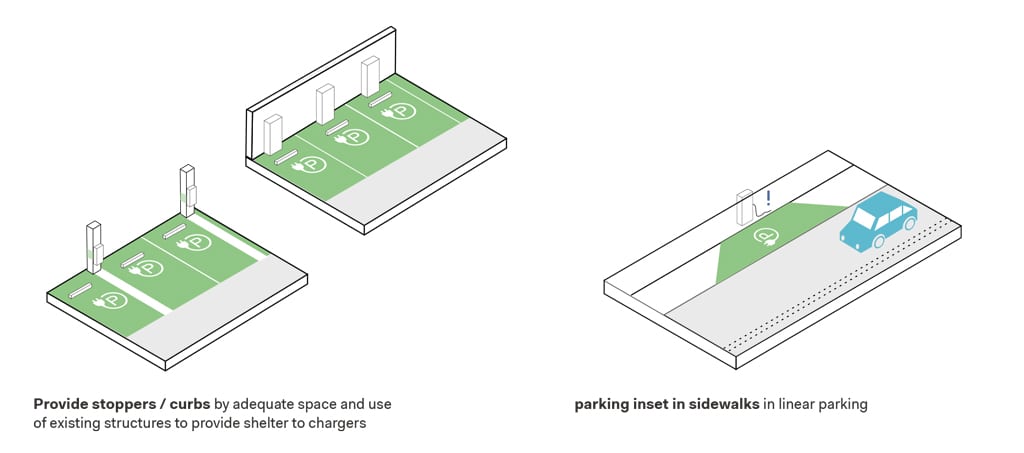
• Casings must be considered to protect charger from the vehicles (wheel stops, bollards)
• Existing structures such as columns and pillars can be used to provide shelter to chargers
• linear parking, electric port on the vehicle might be on the traffic side, exposing user to increased risk – when possible, create parking inset in sidewalk
• Electric cords could create tripping obstacle to pedestrians – retractable or ceiling-mounted cables will solve the problem but at higher costs
How to get people there?
• Appropriate signage has significant impact on driver and pedestrian behaviour: green is to be preferred to indicate EV charging place, as blue is perceived as a general indication
• Concentrating all chargers in one area is preferable for the landowner as it contains costs. At the same time, having them in one area will make easier to be found by users (if proper signage is provided)
When is it enough?
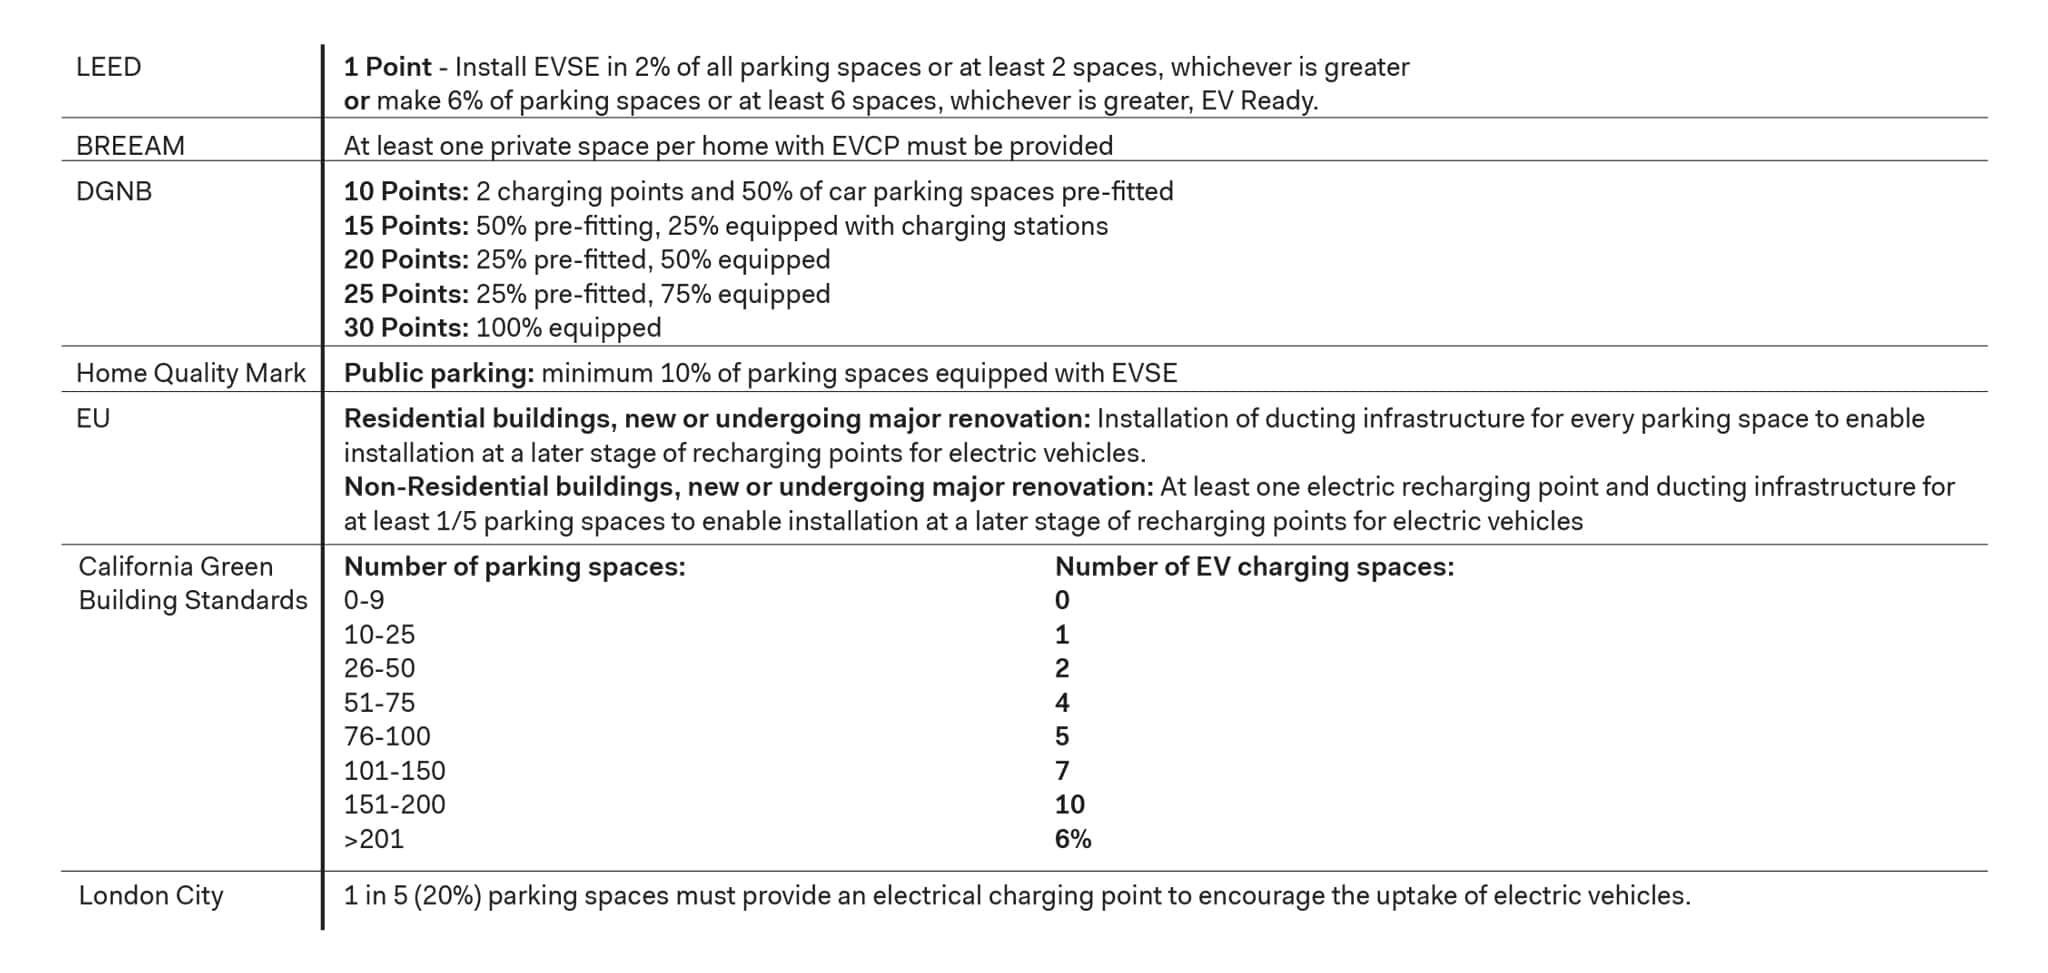
Providing adequate parking infrastructure for electric vehicles is crucial in allowing them to become everyday objects. Several surveys show that the possibility to charge at home and at work plays a huge role when deciding whether to buy an electric car or not. Indeed, an EV owner would prefer to be able to charge anytime, anywhere. Perhaps one day all parking spots will be equipped with a charging outlet but for now, in the transition phase, the focus is on the most desirable venues. Whether electric parking places are built with electric mobility in mind or retrofitted they involve unignorable costs. Since they can only be used by EVs, finding the correct EV/non-EV ratio is paramount to avoid ending up with unused assets.
Electric vehicles perceive parking time in a different way than conventional vehicles: it’s no longer an inconvenience, but a chance to recharge some of the battery. They want to stay parked. The actual time that they spend parked is the first determining factor in deciding how much power to store: the longer the stop the lower the power needed. For cost reasons it would be desirable to install the least powerful chargers. At the same time fast chargers are more attractive to users. Finding the right balance is what this problem is all about. To further refine the study the average travelled distance can enter the equation: knowing how far users have to travel after leaving the facility can give guidance into how much power to provide in order to replenish the batteries enough to allow for the return trip.
Considering average commuting distances and driving habits, providing enough charge to travel 50 kilometres would be a reasonable minimum requirement. With a median fuel economy of around 0.2 kWh/km this translates into delivering 10 kWh of electricity to the vehicle. Once this parameter has been fixed, and knowing how long the average vehicle will stay parked, it is possible to install the correct power on order to obtain the desired result.
The final charger type allocation can be of only one kind or any degree of mix as desired. The chart below shows an example of how the overall investment would change as a function of the share of fast chargers in the whole parking. To keep things simple only two types of chargers were considered, fast and slow. What is interesting to notice is that with only a small increase in the number of fast chargers the total investment is doubled.
The Urban Revolution of Lithium Batteries
What is Sharing Micromobility?
The term micromobility generally refers to small personal mobility vehicles that are either owned or shared, electric or conventional. This section primarily focuses on shared electric micromobility systems that have taken over cities across the globe – particularly in the United States and Europe, and parts of Asia – in recent years. In essence, the term is used to indicate markets of e-bikes, e-mopeds and e-scooters.
These systems have diverse market growth trends, with the oldest being the sharing bicycle market, which began in Europe in 2001, while more recent introductions of e-moped and e-scooter sharing systems first emerged in the United States in 2012 and 2017, respectively.
The first wave of bikesharing began in Europe in 2001 when there were only 5 systems operating in European countries. Electric bike sharing is a more recent development that is gaining momentum globally due to its fast and flexible operations. As of 2018, electric bikes constituted about 10% of the sharing market.
The e-moped sharing systems market has grown globally at remarkable rates since 2015, more than doubling in 2019 worldwide. Today, 82% of moped sharing cities are in Europe with Spain and France being the European frontrunners. Outside of Europe, India established itself as the largest emerging market in 2019.
Scooter-sharing systems have achieved massive growth in just a few short years, the peak of which was in 2019. The year 2020 began on the prediction that the trend would ebb towards a consolidation of markets through acquisitions and increased regulation. Many countries were adjusting traffic laws to incorporate shared e-scooters, and many forefront cities, such as Paris were limiting the number of operators and fleet sizes in their cities (which in Paris had exceeded 20,000 in 2019). The developments of the global pandemic situation of course changed the tides on the entire market and as of the writing of this book, it was yet to become clear whether the micromobility market would survive this disruption, or in the most optimistic views, thrive because of it.
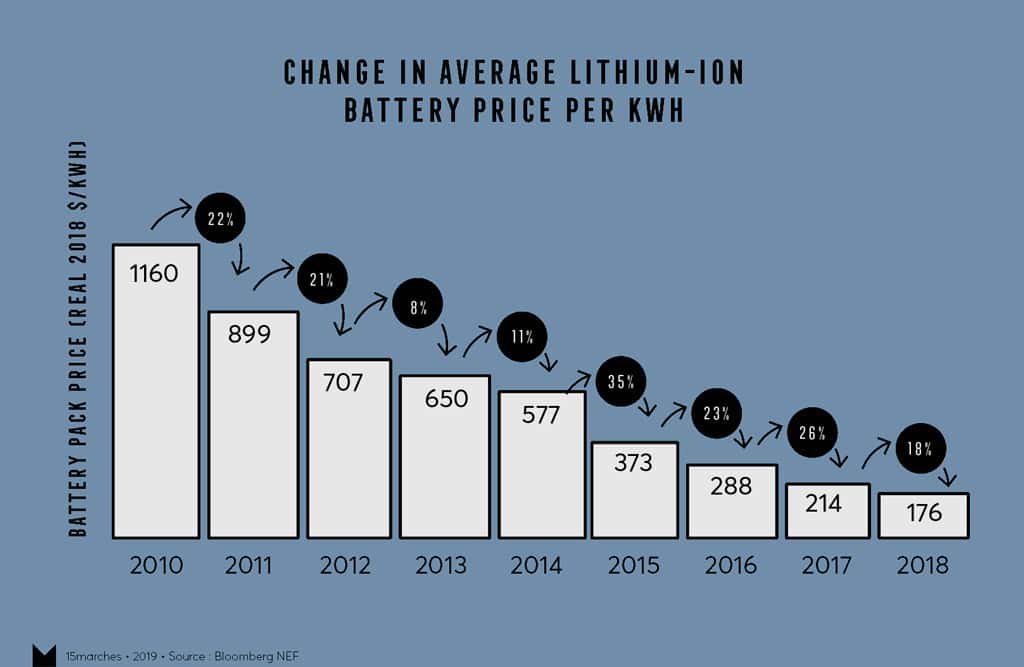
Short battery innovative cycles and the rise of sharing micromobility
These market developments would not have been possible had it not been for the constant developments and price reductions of lithium ion batteries, which have essentially eliminated the industrial entry barriers of these devices and made it easier to travel faster with small physical and environmental footprints.
Operating Models
In a few short years, the number of electric micromobility sharing providers have multiplied across the globe. How do companies maintain price competitiveness?
Optimising operations and the life cycle
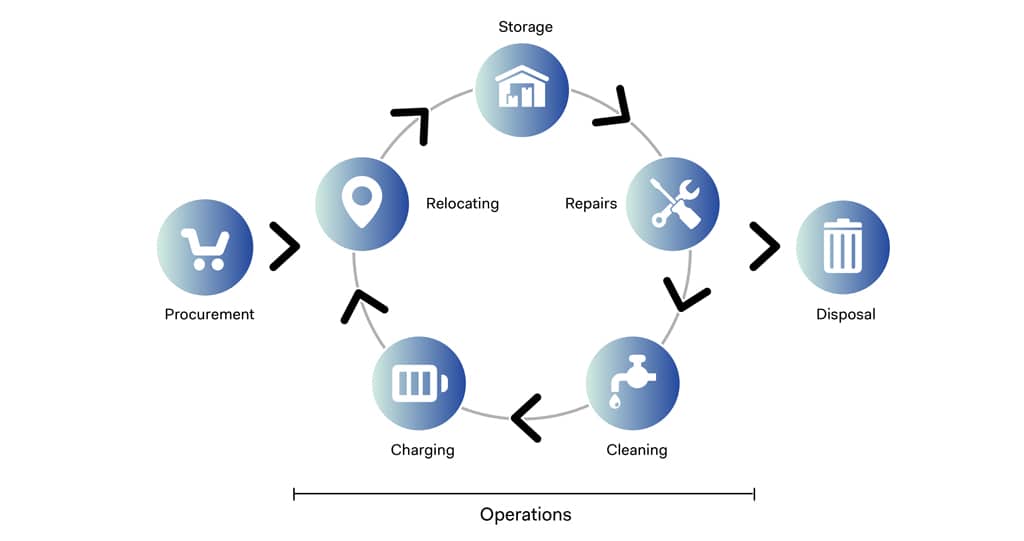
Each device in an operator’s fleet undergoes the same life cycle; the aim of any operator is to extend the distance from procurement to disposal as much as possible, while making sure that each component in the operations phase is as efficient and economically and environmentally sound as possible. Each element of the cycle comes with its challenges. However, several studies of the electric sharing micromobility market have shown that Charging and Relocation are the most financially burdensome areas. These areas along with Procurement and Disposal are the most environmentally costly areas and have placed operators under a lot of public heat in recent times. Operators that are able to employ innovative strategies to reduce these mounting costs are spared a seat in the jungle.
Carbon Emissions
One of the driving forces of the micromobility movement has been centered around its low energy consumption per traveled kilometer in comparison to alternative private mobility vehicles such as the car. However, such analyses fail to take into account carbon emissions produced when the vehicles are at a stop, i.e. the enviornmental impact of the operational phases.
The following diagram comparing average carbon emissions by transport mode provides a breakdown of these emissions by category. We find that e-bikes, while they are slightly more costly than conventional bikes, are still fairly low on the scale, as are Vespa-like e-scooters (mopeds), which are significantly more environmentaly friendly that their gasoline-run counterparts. However, e-kick-scooters, and particularly in dockless systems, are high up the scale amid heavier and gasoline run vehicles. At a closer look, we find that the two main components driving up carbon emissions are maintenance, manufacturing and disposal. Given their short life cycles, vandalism and the oversupply of vehicles that come with dockless systems, it is no surprise that these categories drive up the negative economic impact of these vehicles.
Operational costs
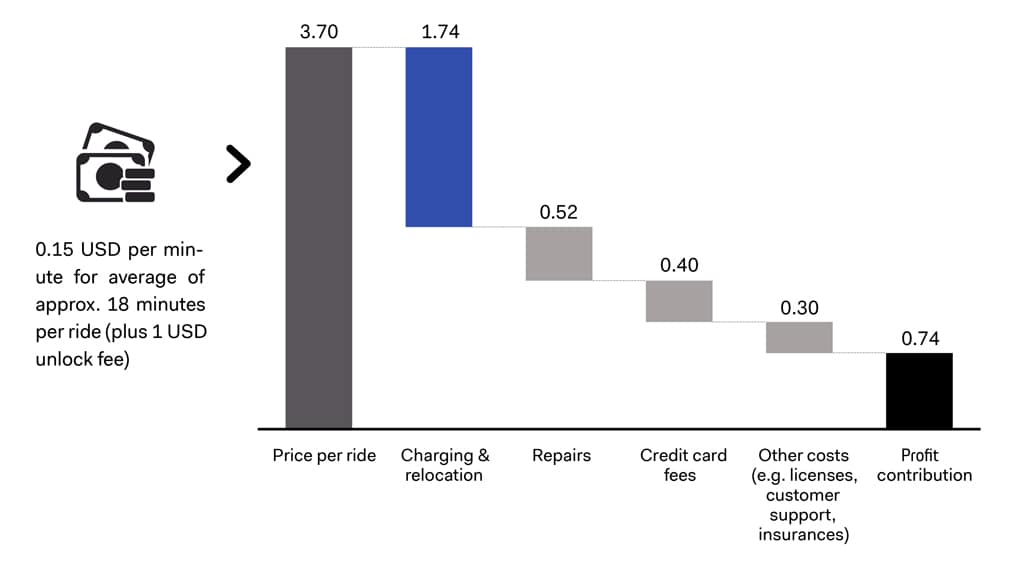
The unit economics of e-scooters give a sense of how costly charging and relocation activities are to an operating company. The analysis by Porsche Consulting shows that for every US dollar paid by the consumer, 47 cents go directly into operating these items. It is the single largest expense of shared scooter operations and makes up about 60% of total cost. As a result, a significant portion of the sector’s innovational capacity goes into developing winning models to improve the unit economics of these two elements. Some of these models will be discussed in the next pages. But first, a summary of the main operational types and the differences between them is essential.
 Charging Modes
How are sharing micromobility providers charging their fleets?
One of the pivotal areas in the operating model of sharing micromobility systems is charging. Unlike carsharing and other older models of shared electromobility, this market strategy relies primarily on the concept of reducing fixed costs, including infrastructure builds, which require great initial investments and lobbying efforts with host cities to approve station locations. Alternatively, crowd-charging models ranging from device pickups and delivery to off-site warehouses, and developing into the now-commonplace on-site charging by ‘juicers’ or hired personnel, come the advent of swappable batteries. Sometimes, this also includes relying on the gig economy or ‘crowd-charging’ models, as they are called to eliminate fixed personnel salaries. In the ever-evolving and still relatively volatile world of sharing micromobility, the keyword is risk reduction, should the operator have to pull out of a city or market suddenly. This is not a homogenous monolith. Naturally, each market operates on its own conditions and resources, and some alternative stories will be discussed in the case studies.
Battery Swap Stations
Some international cases shed light on the possibilities of alternative battery charging models that yield great benefits to the system. The success story of battery swap stations is one that relies on multiple co-factors, intrinsic and extrinsic to the model.
Taiwan best practice: home of the Scooter Waterfall
When it comes to motorized two-wheelers, Taiwan is an established powerhouse, with several leading home-based companies under its wing. Peak sale volume in 2017 reached nearly 1 million sold units across the nation. In 2018, a shift to alternative fuels led to a drop in sales and made way for electric scooters, which gradually took the market by storm. The fact that several policy schemes incentivize the use of electric scooters helped the market develop into what it is today, with more growth projected in the coming years.
The massive governmental support for electric scooters in Taiwan has led to the subsidization of the needed scooter infrastructure: user-based charging stations. Taiwan’s market is traditionally focused on the private market. Yet, leading companies such as Gogoro, which has already dominated the national private market are looking into extending a sharing service in several cities across the country as well. In this way, Gogoro could capitalize on their existing station network and circumvent the heavy toll of high infrastructure costs.
Taiwan: a robust battery station network
Policies & Regulations: a Global Patchwork
Around the world, the approach to sharing micromobility is varied: systems are either proactive, reactive or outlawed depending on local laws. The situation is constantly evolving and more and more global cities are updating their regulatory frameworks.
From March to November 2019, the number of European cities with shared e-scooter systems increased from 32 to 112. By March of 2020, this number had reduced slighting to 97 cities due to several retractions, yet the overall growth is undeniable and the rate of adoption is high relative to just 12 months prior.
Elsewhere in the world, the adoption of shared micro-mobility is also growing. Since the early onset of these new modes, debate has been fueling over their safety, their environmental impact and their place on the urban streetscape. Naturally, the openness to these schemes has not been the same everywhere. Depending on the rigidity of existing traffic laws, the openness of local markets to new, unpredictable modes of transport and local perceptions towards them, the course of action has been very different. As of the beginning of 2020, e-scooters are not yet allowed on Dutch and British roads. For the countries that do allow it, the process to organize roadspace, parking and riding rules, etc. is a long one. It will take time to establish new laws to regulate these vehicles, ensure optimum serviceability to the public and integration with overarching transport networks.
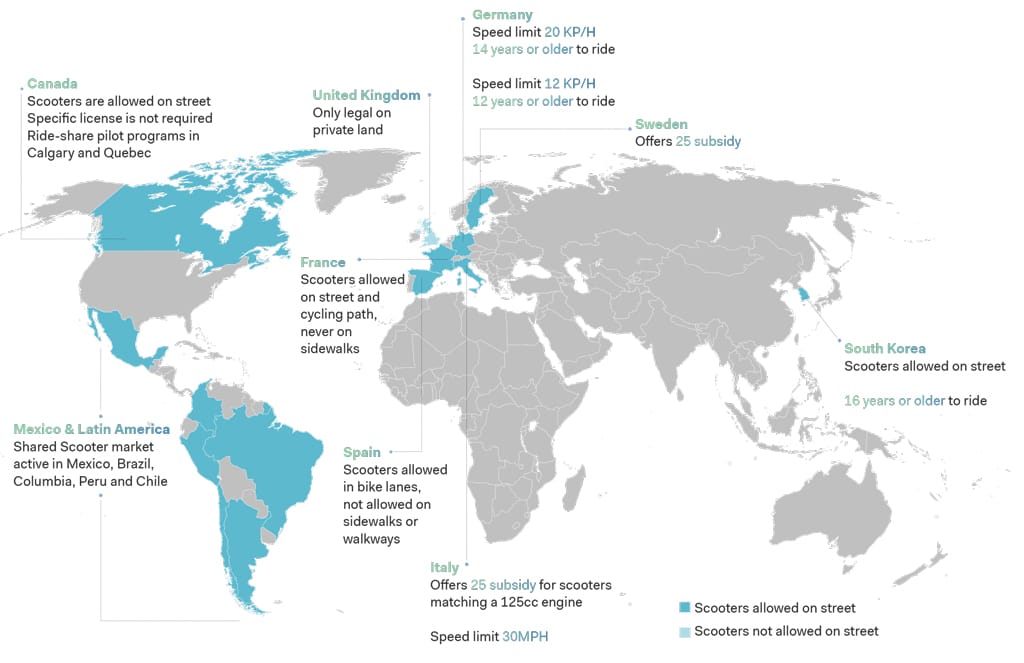 Electric scooter legal frameworks in various countries globally (2019)
(Data source: Unagi Scooters blog)


 Life Cycle Global Warming Emissions