
Pedestrian thermal comfort is a quantitative and qualitative measure of how comfortable the average pedestrian is when walking, sitting, or standing in an outdoors environment. Factors that influence outdoor thermal comfort can be grouped in environment-based and human-based ones. Quantifying the compound influence of each factor is a great challenge, tackled with numerous approaches. This research aims at summarizing multi-disciplinary efforts to determine pedestrian thermal comfort in outdoors environments. The case study of Milano is analyzed at multiple scales, using the Urban Multi-scale Environmental Predictor (UMEP) tool to compute the Physiological Equivalent Temperature (PET). The PET index is first used to analyze comfort levels at the city scale for four average days in 2019, representing the four seasons. Then, it is analyzed against pedestrian footfall data to research the relation between pedestrians’ behavior under multiple heat conditions. Outlined methodologies aim at developing practices to increasingly integrate thermal comfort sensing into urban modeling and planning.
Introduction
Walkability is a measure of the extent to which the built environment encourages people to walk (Wang & Yang, 2019). The level of walkability in cities is of increasing importance in urban planning, as it is strictly linked to physical and mental health of citizens and balanced development of urban areas (Yue et al., 2022). Together with spatial factors, pedestrian walking behavior, expressed as attendance of outdoor spaces, walking rates, and walking speeds, is also associated with multiple perceived components, such as the level of crowding, noise, and climate. According to Savvides (2016), a rise in air temperature by 10°C causes a rise in the percentage of people who choose to walk in the shade by 15%-20%. Furthermore, walking in the sun is considered on average 16% longer as compared to the same distance in the shade (Balakrishnan, 2014). Single climatic factors affecting outdoor pedestrian movements and willingness to walk, such as air temperature and shade, can be summarized by indices representing pedestrian thermal comfort levels.
Pedestrian thermal comfort is a quantitative and qualitative measure of how comfortable the average pedestrian is when walking, sitting, or standing in an outdoors environment. Factors that influence outdoor thermal comfort (OTC) can be grouped in environment-based and human-based ones (Aghamolaei et al., 2022). At the environment level, these include physical factors (e.g., geometry, materials, natural elements, etc.) and meteorological/ climate factors (e.g., radiant temperature, wind speed, humidity, etc.). At the human level, these include social factors (e.g., cultural, and economic aspects, etc.) and individual ones. These can be grouped further in psychological (e.g., available choice, thermal history, etc.) and physiological factors (e.g., metabolism rate, clothing rate, age, gender, etc.). Quantifying the compound influence of each factor is a great challenge, tackled with numerous approaches.
In steady-state models, thermal comfort is treated as the direct result of a set of parameter inputs related to environmental stimuli and physiological responses of the body to them. It is assumed that people react to thermal conditions the same way throughout their journey. The Physiological Equivalent Temperature (PET) index, derived from the human heat balance model, combines weather and thermo-physiological parameters (clothing and human activities). It is used to measure the thermal comfort of an individual in given situations by comparing average physiological responses to those expected in the reference environment (Höppe, 1999).
In this context, this research focuses on evaluating Physiological Equivalent Temperature (PET) levels in Milano (Italy). The first goal is to quantify how comfortable the city is to walk in for four days in 2019, presenting average climate conditions for each season, to obtain an understanding of which actions are needed to assist the improvement of streets’ thermal comfort and walkability levels (Koetse, 2009). Urban morphology is one of the main factors influencing microclimate conditions; for example, the amount of direct radiation received on the street is determined by the street width, while street orientation affects the time of the day when the radiation is received. Thus, urban planning and design actions can help to mitigate the impact of uncomfortable climate conditions. (CLEAr, 2023). The second goal is to perform fine grained analyses with the aim to correlate PET levels with registered pedestrian volumes, targeting specific actions in micro environments. In particular, the case study of Corso Buenos Aires in Milano (Italy) is chosen to determine how video analytics could be used to collect evidence on how pedestrian behavior is affectedunder multiple heat conditions.
Enabling Data and Methodology
Enabling Data and Tools
Meteorological Data
Throughout this research, multiple climate variables were studied to derive overall trends in Milano in 2019. Analyzed meteorological data include:
- Solar data
- 2-meter temperature (°C): it represents the air temperature measured at a height of 2 meters above the ground surface.
- Surface solar radiation: it refers to the amount of solar energy that reaches the Earth’s surface from the Sun.
- Total sky direct solar radiation at surface: it determines the amount of energy available for heating and cooling the human body.
- Precipitation data
- 2 meter relative humidity (%): it refers to the amount of moisture present in the air compared to the maximum amount possible at a specific temperature.
- Total precipitation (mm): this is a meteorological variable that represents the amount of precipitation that falls over a specific area during a specified period.
- Total cloud cover (%): it refers to the extent or percentage of the sky that is covered by clouds.
- Wind data
- Wind speed (m/s): it affects how heat is transferred from the human body through convection.
- Wind direction: it affects the exposure of individuals to different environmental conditions.
Physiological Equivalent Temperature Data and Tools
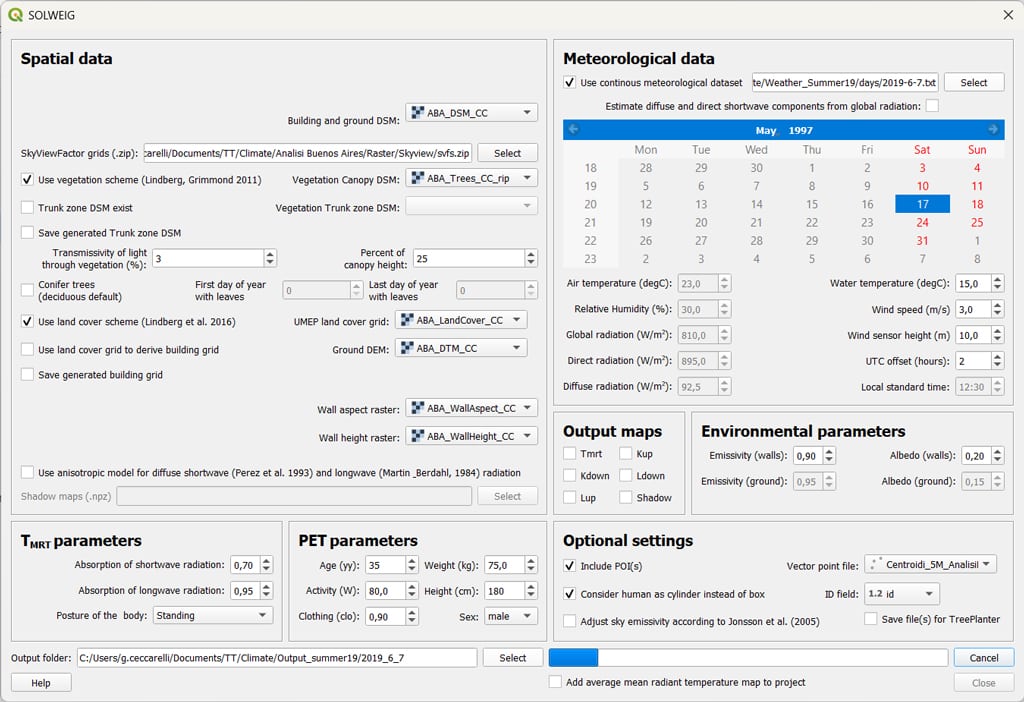
The main enabling tool used throughout the research is the Urban Multi-scale Environmental Predictor (UMEP). UMEP is an open source city-based climate service tool, that combines models and tools essential for climate simulations (Lindberg et al., 2018), developed as a QGIS plugin. In this research, the SOlar LongWave Environmental Irradiance Geometry model (SOLWEIG) analyzer is used to compute Physiological Equivalent Temperature (PET). SOLWEIG estimates spatial (2-D) variations of 3-D radiation fluxes and the mean radiant temperature (Tmrt) in complex urban settings. (Lindberg et al., 2018). Input dialog parameters and data for PET calculation relevant to this study are shown in Figure 2. These include:
- Spatial data:
- Digital Surface Models (DSM), representing ground and building heights and tree canopy heights, structured in grids with dimension 5m x 5m;
- Sky View Factor, representing the ratio at a point in space between the visible sky and the analyzed location;
- Walls height and aspect, needed to calculate the ratio of the height of the wall segment to its length measured parallel to the wall line.
- Meteorological data:
- Time series data, including the 2 meter temperature (C°)
- Environmental parameters:
- Albedo and emissivity of building walls and roofs, defining the amount of energy reflected by vegetation and the built environment.
- Optional settings:
- Points of Interest (POIs) added to the calculation to compute thermal comfort values around each specific POI.
- Consider humans as a cylinder, according to Holmer at al. (2015).
- Human parameters settings:
- Mean radiant temperature (Tmrt) settings, including the amount of longwave and shortwave radiation that the human body absorb and the position of the person (i.e., standing or sitting)
- PET calculation parameters, including the age, gender weight, height, activity levels (W) and clothing levels (clo) of the reference person.
Pedestrian Footfall Data
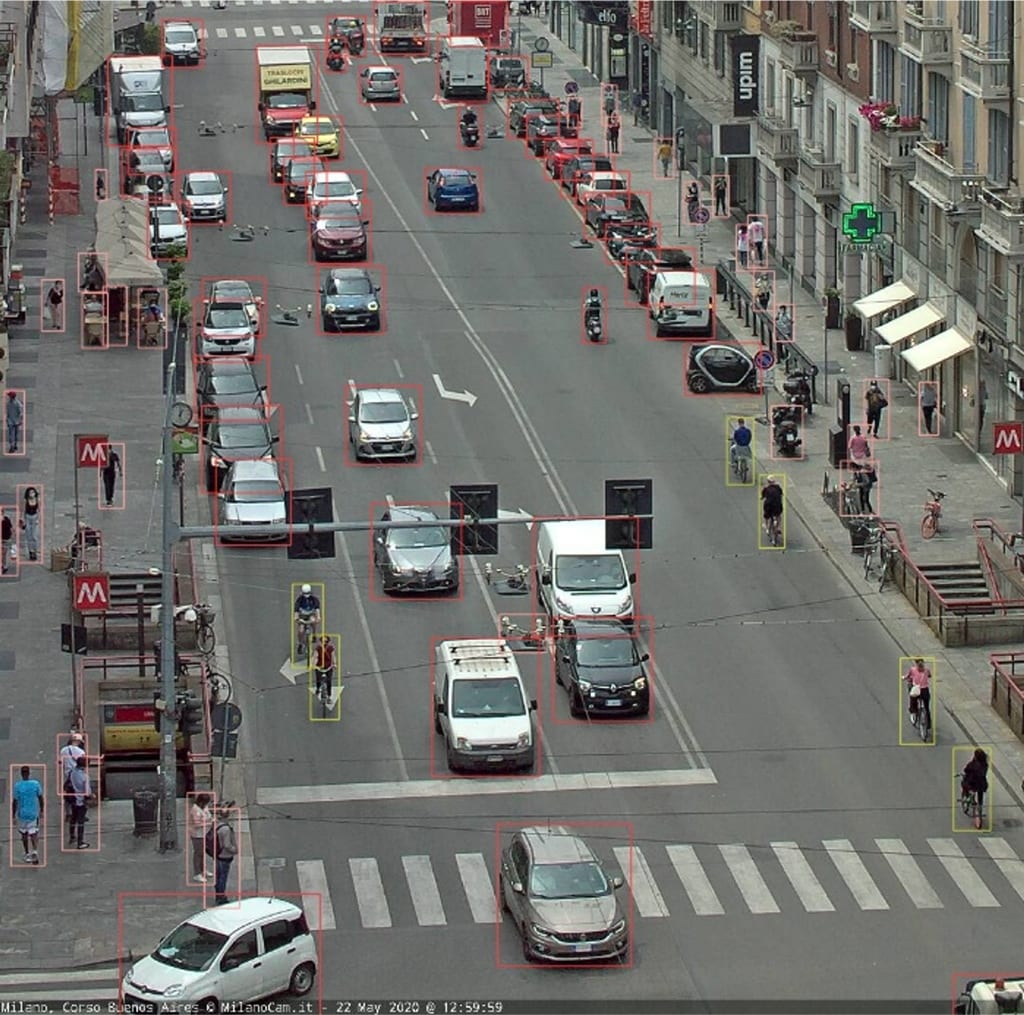
Data used to analyze pedestrian footfall against thermal comfort levels was gathered through an extensive collection of images of Corso Buenos Aires (Milano), between Piazza Lima and Via Redi (MilanoCam.it). 552 images were collected, representing 6 daily time slots (12 – 17) between June 2019 and August 2019 (Figure 3). As Corso Buenos Aires presents a north-south orientation, the sun and shadow position change among the two sidewalks between 14 and 15. Thus, the case study aims at analyzing how the distribution of pedestrians around two sidewalks changes throughout the day.
Methodology
City-wide Analyses
Analyses carried out for Milano are structured as follows:
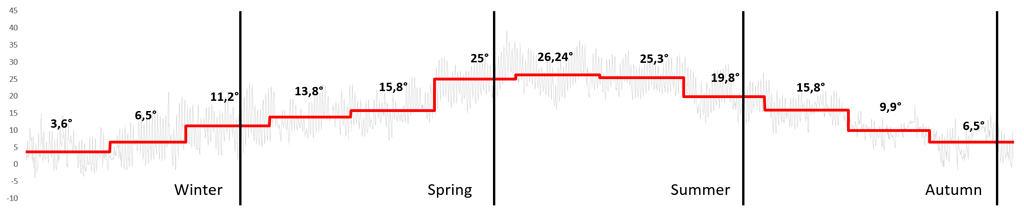
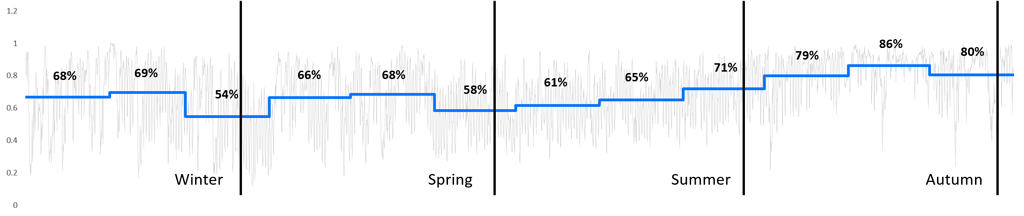
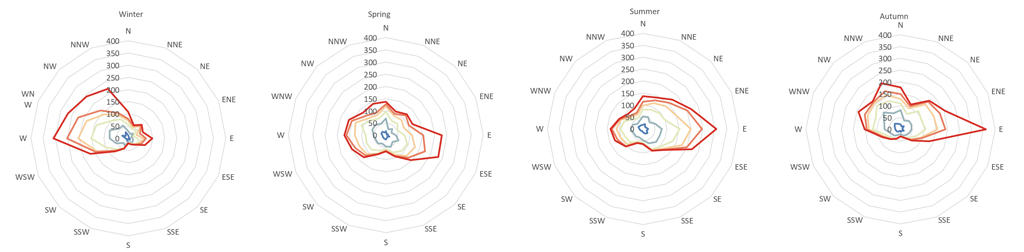
1. Days selection: four reference days, representing the average seasonal patterns in 2019, were selected through a descriptive analysis of meteorological trends. Solar, precipitation and wind related variables listed above were analyzed in a compound study to determine average seasonal characteristics.
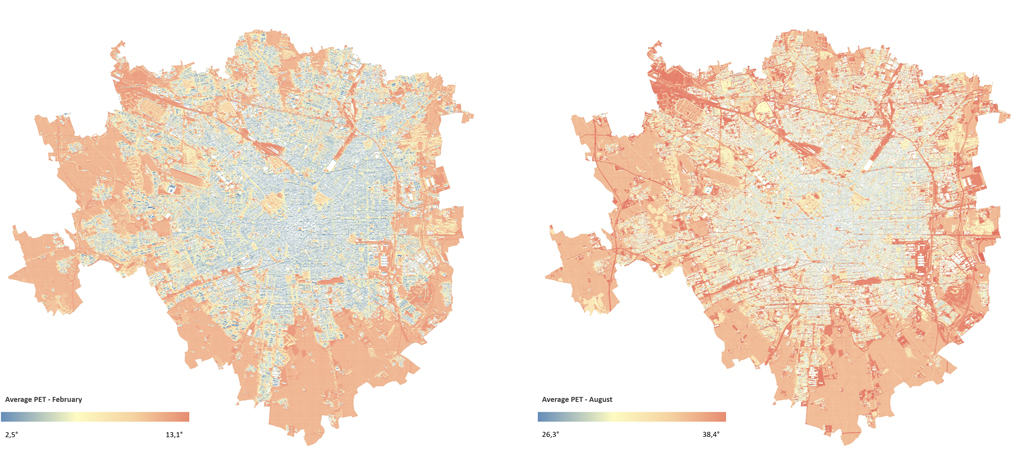
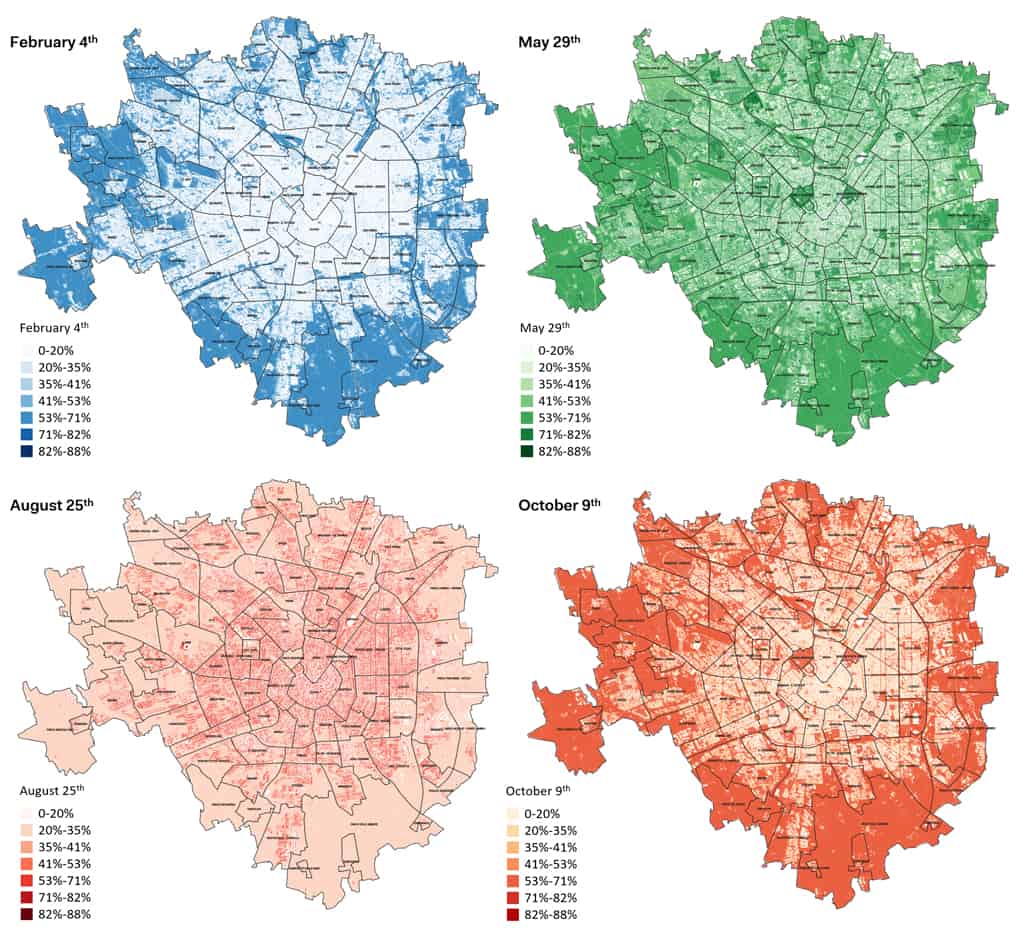
2. PET computation: Using the UMEP tool with the parameters and input described above, PET values were computed for four days, showing average seasonal characteristics in 2019. These are February 4th, May 29th, August 25th, October 9th.
3. Descriptive analysis: Descriptive analyses summarize thermal comfort conditions associated with each season. First, output from UMEP was filtered to retrieve information on day time hours PET values (Table 1).

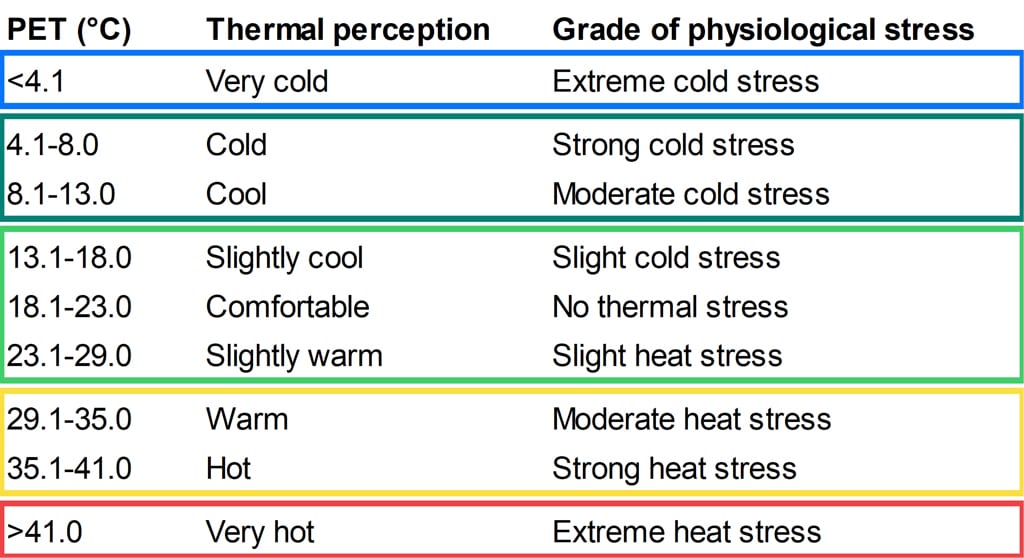
Second, thermal comfort levels were grouped following the definition of Matzarakis (2008) (Figure 4). These groups indicate the relationship between PET values (°C), thermal perception and the grade of physiological stress. Last, the number of hours in comfortable thermal conditions (13.1-29 °C) were calculated at the city level.
4. Clustering analysis: Multivariate clustering analysis is a statistical technique used to group or classify objects or entities based on multiple variables or attributes. The aim is to find groups or clusters of entities that are similar or related in some way based on their values across several variables. In this research, K-means clustering technique was used, with the aim to group areas presenting similar thermal comfort conditions during day time hours according to thermal comfort groups shown in Figure 4.
Neighborhood Analyses
Analyses carried out for Corso Buenos Aires are structured as follows:
- Image analytics: The image dataset was analyzed using Yolov5 (You Only Look Once) (Jocher et al., 2021) as an object detection algorithm. The goal was to recognize pedestrians and locate them in an image. To this end, an open-source model was used, which was trained on CCTV cameras in Montreal (City of Montreal, 2021).
- PET computation: Using the UMEP tool with the parameters and input described above, PET values were computed for each day between June and August 2019, in the timeslots 12-17. Then, the corresponding average PET value for each sidewalk was computed.
- Correlations: Linear correlations were calculated between the distribution of pedestrians around the two sidewalks, defined as the percentage of people, and the corresponding average PET values for each sidewalk. Multiple exercises were carried out, to test correlations results changes based on temperature variations.
Results
City-wide Analyses
Meteorological data analysis
The first step of this research aimed at selecting four reference days, representing the average seasonal patterns in 2019. To this end, a descriptive analysis of meteorological trends was carried out. Solar, precipitation and wind related variables were analyzed in a compound study to determine average characteristics. Figures 5, 6, 7 outline the yearly trends of the main variables analyzed.
Descriptive analysis
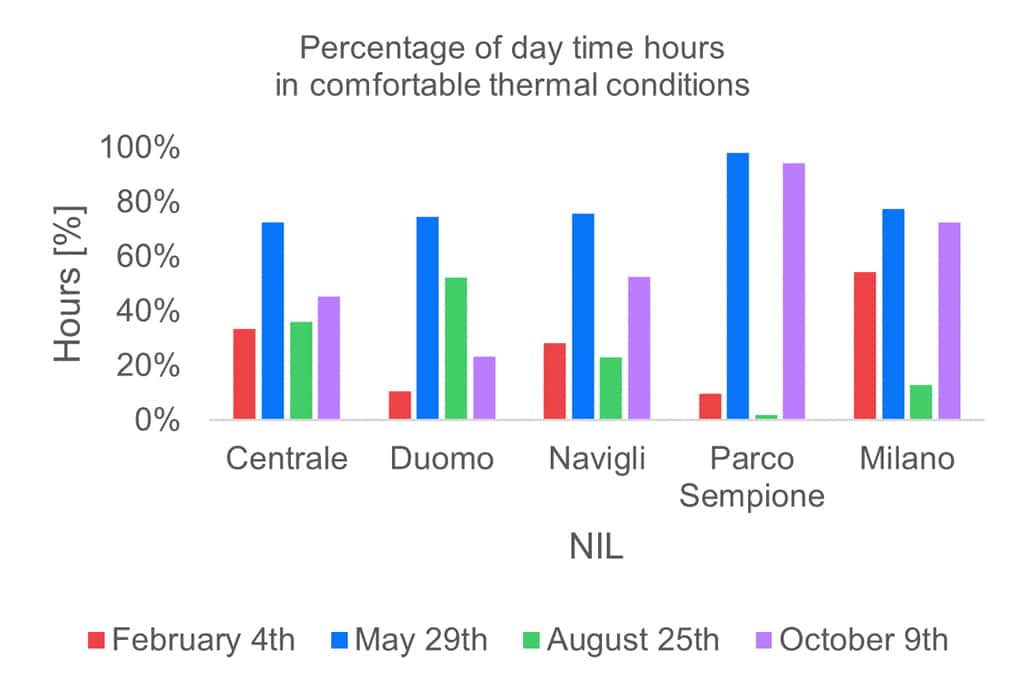
Descriptive analyses aimed at summarizing thermal comfort conditions associated with each season, calculating the number of hours in comfortable thermal conditions (13.1-29°C) at the city level. Figure 8 shows the results of the analysis:
- On February 4th, 54% of the city was in a comfortable thermal condition for more than 50% of daytime hours.
- On May 29th, 77% of the city was in a comfortable thermal condition for more than 50% of daytime hours.
- On August 25th, 13% of the city was in a comfortable thermal condition for more than 50% of daytime hours.
- On October 9th, 73% of the city was in a comfortable thermal condition for more than 50% of daytime hours.
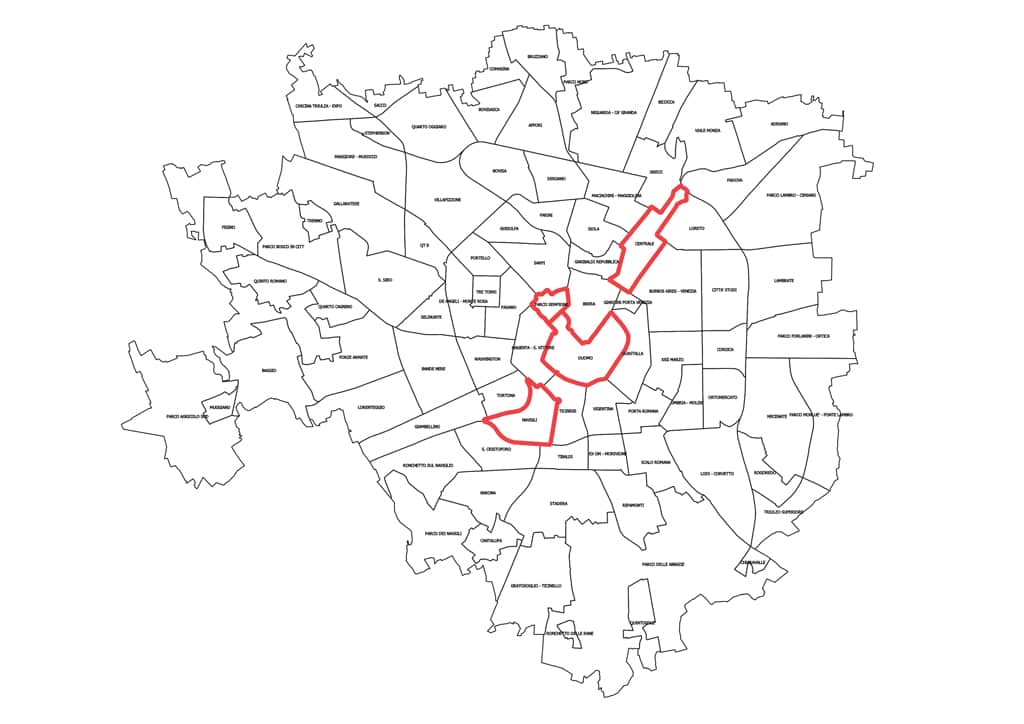
Thermal Comfort values vary however based on multiple factors, as land use. Graph 1 outlines how the average PET values vary for each representative day in four zones (NIL): Centrale, Duomo, Parco Sempione and Ticinese.
Clustering analysis
In the third phase of the study, K-means clustering technique was used, with the aim to group areas presenting similar thermal comfort conditions during day time hours. Four clusters were identified. These are:
- Big open spaces: large open spaces characterized by high temperature range, without any tree[1], characterized by:
- Winter: more than 55% of hours in comfort condition
- Spring: between 50% and 56% of hours in comfort condition
- Summer: less than 29% of hours in comfort condition
- Fall: 58% of hours in comfort condition
- Sunny roads: open areas or heavily sunlit non-tree-lined roads, characterized by:
- Winter: between 18% and 36% of hours in comfort condition
- Spring: between 50% and 56% of hours in comfort condition
- Summer: between 29% and 43% of hours in comfort condition
- Fall: between 42% and 59% of hours in comfort condition
- Trees realm: streets and parks heavily shaded by tree cover, characterized by:
- Winter: between 9% and 27% of hours in comfort condition
- Spring: more than 75% of hours in comfort condition
- Summer: between 29% and 50% of hours in comfort condition
- Fall: 33% of hours in comfort condition
- Shaded roads: heavily shaded roads and cohorts, characterized by:
- Winter: less than 18% of hours in comfort condition
- Spring: between 56% and 69% of hours in comfort condition
- Summer: between 50% and 57% of hours in comfort condition
- Fall: 33% of hours in comfort condition
Results are summarized in Table 2.
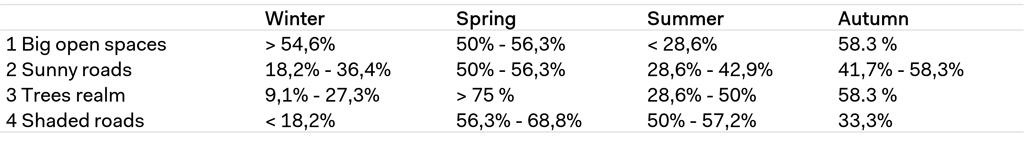
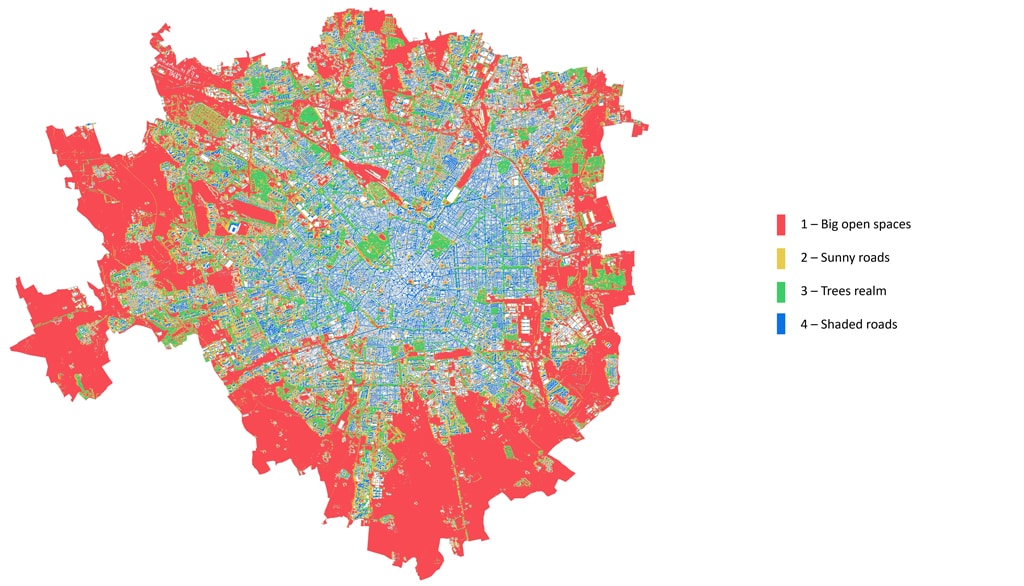
Figure 3 outlines the spatial distribution of each cluster. Cluster 1, Big open spaces, covers the greatest area of the municipality (52%), followed by Cluster 2, Sunny roads (18%). Cluster 4, Shaded roads, and Cluster 3, Trees realm, cover an area equal to 15% of the municipality respectively.
Neighborhood Analyses
The last section of this research aimed at analyzing the relation between thermal comfort and pedestrian footfall for the case study of Corso Buenos Aires, Milano. Graph 2 shows the results of the image analytics process, which aimed at detecting people in each image and calculating the distribution (%) of pedestrians among the two sidewalks of Corso Buenos Aires. Graph 2 outlines how the distribution of pedestrians varies throughout the hours. Furthermore, it shows how, generally, the distribution presents a change between 14 and 15, following the sun path.
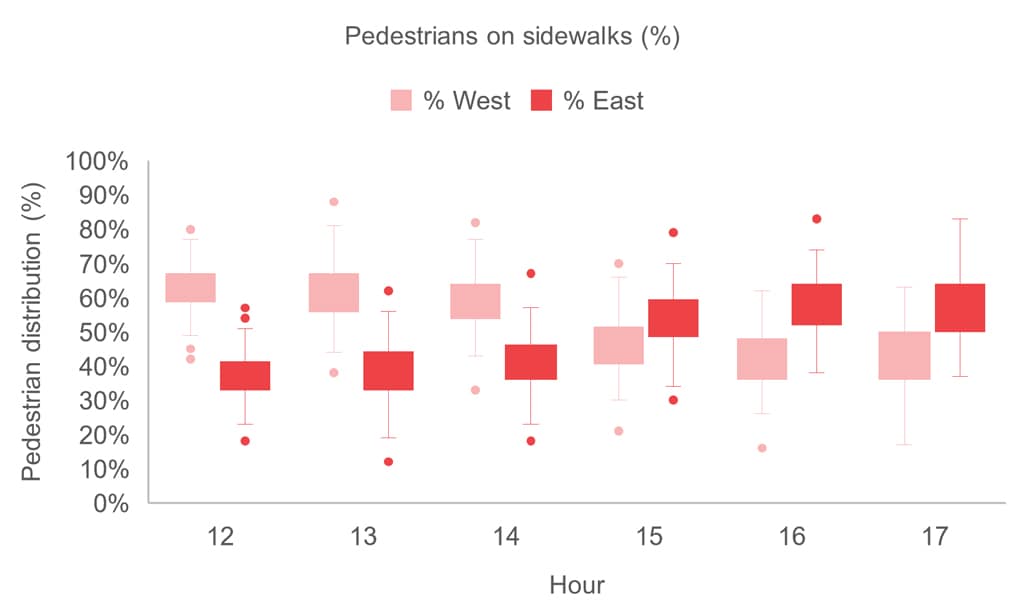
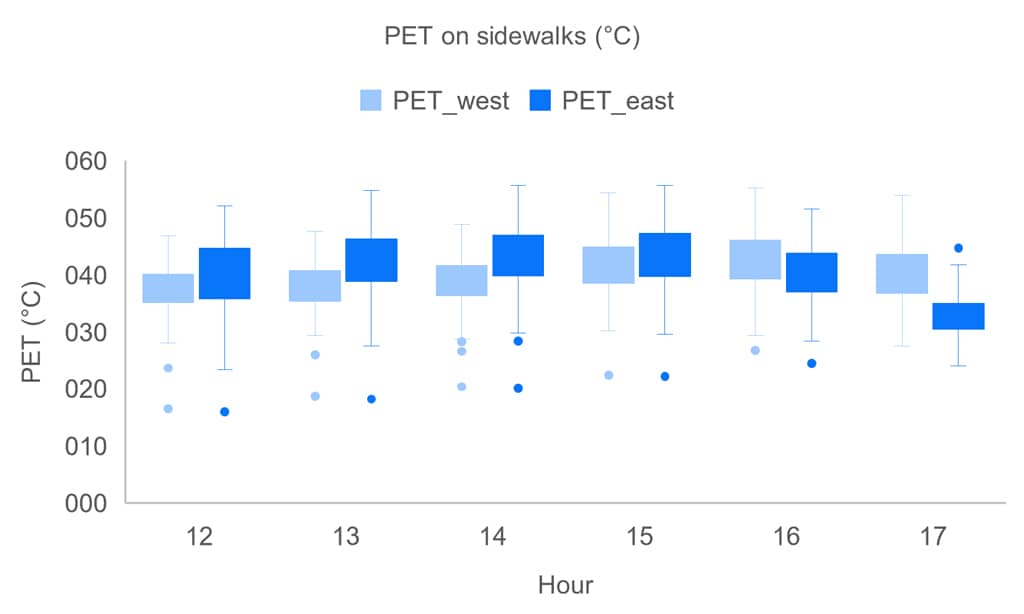
Using the UMEP tool, PET values were computed for each day between June and August 2019, in the timeslots 12-17. Then, an average PET value for each sidewalk was computed. Graph 3 visualizes the distribution of PET levels for different moments of the day (12-17). Comparing Graph 2 and Graph 3, it can be seen how pedestrian and PET distributions present different trends. In particular, the pedestrian distribution and the average PET for the east sidewalk values differ.
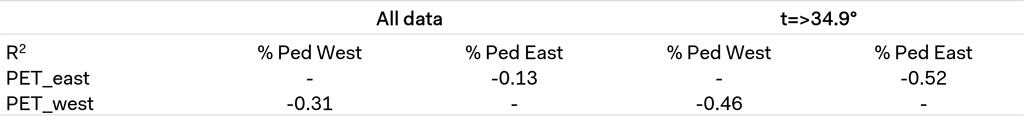
Linear correlations were calculated between the distribution of pedestrians around the two sidewalks, and the corresponding average PET value for the sidewalk. Multiple exercises were carried out, to test correlations results changes based on temperature variations. Table 1 outlines the R2 obtained in the correlation exercise between the average PET levels on each sidewalk and the corresponding pedestrian percentage. In general, very weak, or weak negative correlations can be seen between the two variables for “All data” analyses. These become stronger when the temperature is rising. A temperature equal to 34.9 °C represents the 90th percentile of registered temperatures for the months of June, July, and August 2019. Filtering registered pedestrian footfall for temperatures above or equal 34.9 °C, R2 obtained improves for both sidewalks, leading to medium strong results.
Final Remarks and Future Work
This research aimed at summarizing multi-disciplinary efforts to determine pedestrian thermal comfort in outdoors environments. The case study of Milano was analyzed at multiple scales, using the Urban Multi-scale Environmental Predictor (UMEP) tool to compute the Physiological Equivalent Temperature (PET). Results from this research outline seasonal and spatial patterns in thermal comfort, structuring Milano into four clusters, based on thermal conditions and city morphology. Then, pedestrian footfall data was gathered to research the relation between pedestrians’ behavior in Corso Buenos Aires, Milano, under multiple heat conditions. PET values and the choice to walk in a shadowed area show weak correlations levels, however the relation is stronger when temperature is rising. Data availability represents a great challenge in the integration of climate research into urban planning. Data is of crucial importance to collect evidence of pedestrians’ path preferences, considering multiple pedestrians’ typologies (e.g., tourists vs commuters) and how different thermal conditions lead to building up thermal stress levels. This information is needed to validate path choice input weights, furthermore it could be used to develop a dynamic assignment model, where path choice is repeated to include thermal stress. To this end, video analytics techniques could enable the collection of human-based and environment-based information at multiple scales, fostering the understanding of how climate conditions affect the human body and relate to peoples’ activities. Further research should revolve around the development of surveying practices through video analytics and the integration of multiple pedestrian comfort indicators into route choice models.
Acknowledgements
The analyzed data were treated according to the GDPR-General Data Protection Regulation (EU, 2016/679). This research received no specific grant from any funding agency in the public, commercial, or not-for-profit sectors.
The results of this research were presented at the European Transport Conference 2023, 6-8 September 2023, Milan (Italy).
Zuretti, M., Pedrazzoli, A., Ceccarelli, G., De La Hoz, A. (2023). Multi-Disciplinary Perspectives on Pedestrian Thermal Comfort and Walkability. In: 51th European Transport Conference 2023 (ETC 2023), 6-8 September 2023, Milan (Italy)
References
Aghamolaei, R., Azizi, M. M., Aminzadeh, B., & O’Donnell, J. (2022). A comprehensive review of outdoor thermal comfort in urban areas: Effective parameters and approaches. Energy & Environment, 0(0). https://doi.org/10.1177/0958305X221116176
Balakrishnan, P. (2014, novembre 16). Cool spots in hot climates: A means to achieve pedestrian comfort in hot climates. https://doi.org/10.13140/RG.2.1.2115.2808
Comfortable Low Energy Architecture (2023). Available at: https://www.new-learn.info/packages/clear/thermal/buildings/configuration/open_spaces_and_built_form/street_widths_and_orientation/index.html
City of Montreal (2021). Annotated images taken from the video stream of traffic cameras. Information Technology Department. Available at: https://donnees.montreal.ca/ville-de-montreal/images-annotees-cameras-circulation
Höppe, P. (1999). The physiological equivalent temperature—A universal index for the biometeorological assessment of the thermal environment. International Journal of Biometeorology, 43(2), 71–75. https://doi.org/10.1007/s004840050118
Jocher, G., Chaurasia, A., Stoken, A., et al. (2021). ultralytics/yolov5: v5.0 – YOLOv5-P6 1280 models, AWS, Supervise.ly and YouTube integrations (v5.0). Zenodo. https://doi.org/10.5281/zenodo.4679653
Lindberg, F., Grimmond, C.S.B., Gabey, A., Huang, B., Kent, C.W., Sun, T., Theeuwes, N., Järvi, L., Ward, H., Capel-Timms, I., Chang, Y.Y., Jonsson, P., Krave, N., Liu, D., Meyer, D., Olofson, F., Tan, J.G., Wästberg, D., Xue, L., Zhang, Z. (2018) Urban Multi-scale Environmental Predictor (UMEP) – An integrated tool for city-based climate services. Environmen tal Modelling and Software.99, 70-87 https://doi.org/10.1016/j.envsoft.2017.09.020
Lindberg, F., Grimmond, C.S.B., Gabey, A., Järvi, L., Kent, C.W., N Krave, T Sun, N Wallenberg, HC Ward (2019) Urban Multi-scale Environmental Predictor (UMEP) Manual. https://umep-docs.readthedocs.io/ University of Reading UK, University of Gothenburg Sweden, SIMS China
Koetse, M. J., & Rietveld, P. (2009). The impact of climate change and weather on transport: An overview of empirical findings. Transportation Research Part D: Transport and Environment, 14(3), 205–221. https://doi.org/10.1016/j.trd.2008.12.004
Matzarakis, A., & Amelung, B. (2008). Physiological Equivalent Temperature as Indicator for Impacts of Climate Change on Thermal Comfort of Humans. In M. C. Thomson, R. Garcia-Herrera, & M. Beniston (A c. Di), Seasonal Forecasts, Climatic Change and Human Health: Health and Climate (pp. 161–172). Springer Netherlands. https://doi.org/10.1007/978-1-4020-6877-5_10
Savvides, A. (2016). An examination of environmental design parameters affecting walkable route choices in Cyprus. 599–609. https://doi.org/10.2495/SDP160501
Yue, X., Antonietti, A., Alirezaei, M., Tasdizen, T., Li, D., Nguyen, L., Mane, H., Sun, A., Hu, M., Whitaker, R. T., & Nguyen, Q. C. (2022). Using Convolutional Neural Networks to Derive Neighborhood Built Environments from Google Street View Images and Examine Their Associations with Health Outcomes. International Journal of Environmental Research and Public Health, 19(19). https://doi.org/10.3390/ijerph191912095
Wang, H., & Yang, Y. (2019). Neighbourhood walkability: A review and bibliometric analysis. Cities, 93, 43-61. https://doi.org/10.1016/j.cities.2019.04.015
[1] Results are influenced by trees distribution in the Patrimonio del Verde dataset