
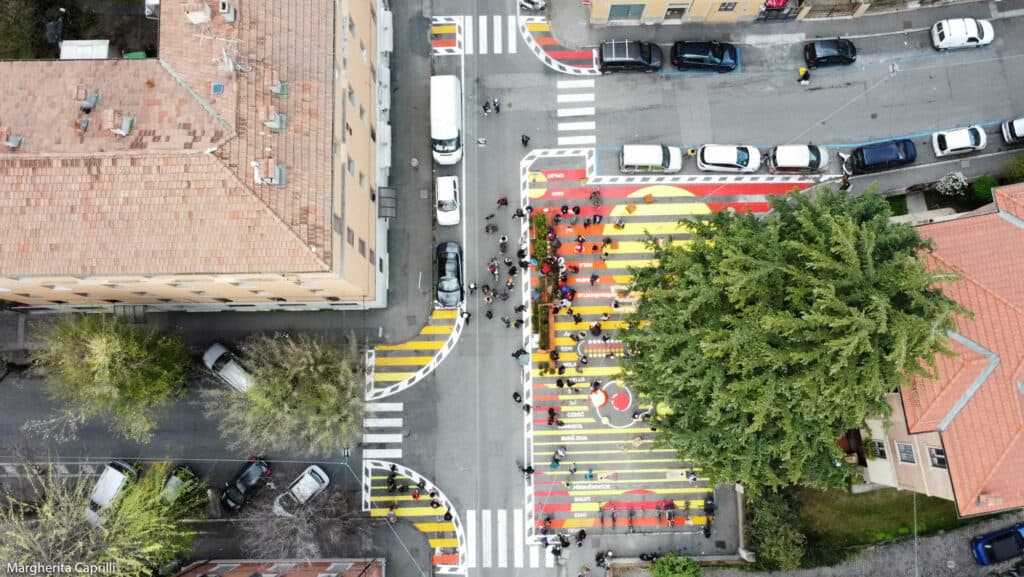
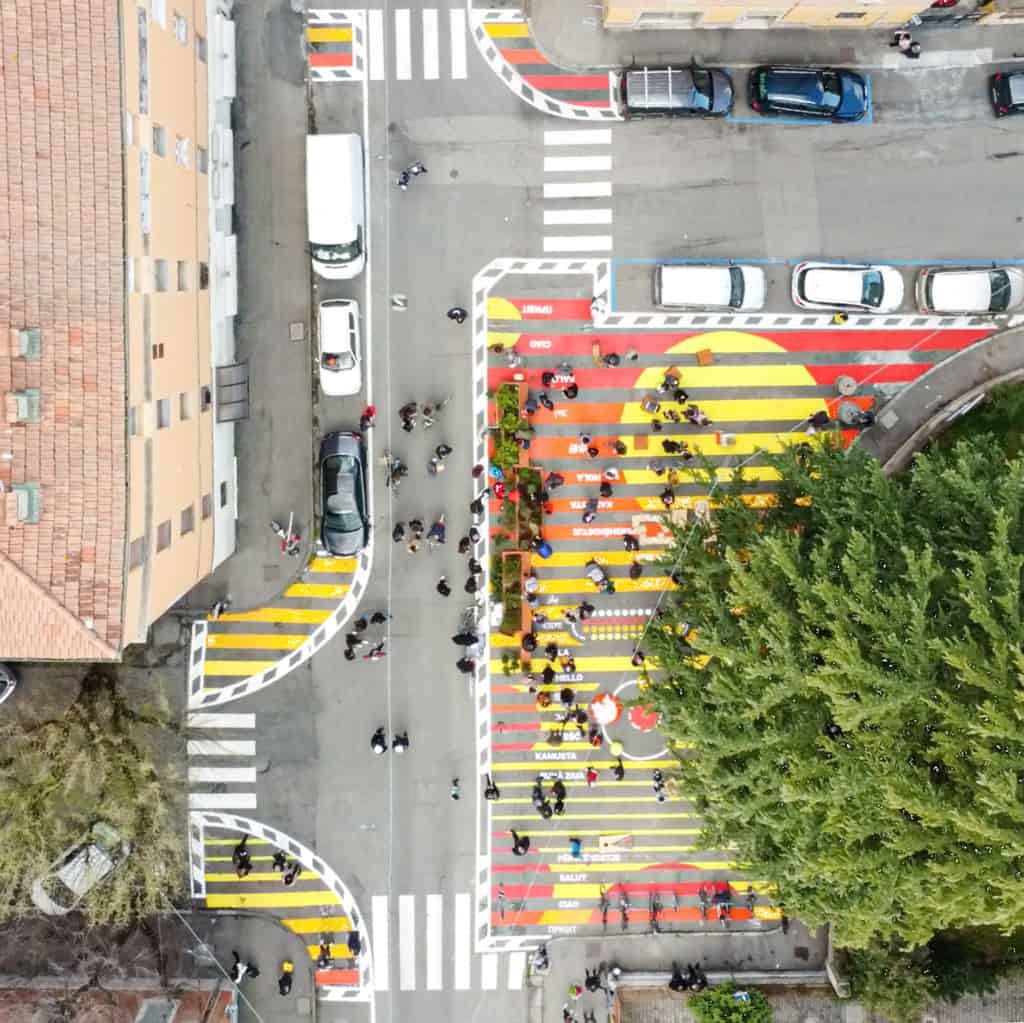
In March 2022, Fondazione Innovazione Urbana and the Municipality of Bologna built a new public space for children in Via Procaccini (Bologna) near a middle school (see Figure 1), using the approach of tactical urban planning and participatory design. The area chosen to build the new square was the subject of a mobility study conducted by Systematica and Transform Transport. The objective of the study was to monitor pedestrian and vehicular flows, with the aim of detailing specific patterns of space use. The monitoring was carried out through observations supported by a camera and video analytics techniques. The research produced a series of analyses related to observed flows in the area during the pre/ post-intervention phases. This was meant to support the iterative design process based on the tactical urbanism approach.
Introduction
Planning infrastructures and services for sustainable urban mobility is one of the main challenges for European cities (Buhrmann, S., Wefering, F., Rupprecht, S., 2019), which are increasingly facing problems of traffic congestion, road safety, energy dependence, and air pollution (United Nations, 2016). In this context, planning efforts are focusing on walkability (Abley & Hill, 2005; Speck, 2013), namely how friendly the urban environment is for walking or spending time in public spaces. Improving the level of walkability of an urban area implies the presence of a comfortable, safe, and barrier-free pedestrian infrastructure, as well as people-friendly environments that allow opportunities for social interaction (Gehl, 2013).
The focus on walkability, which began with the principles highlighted in the European Charter of Pedestrian Rights issued by the European Parliament in 1981, has become even more evident given the unprecedented effects of the Covid-19 pandemic on urban mobility (Transform Transport, 2022). In July 2020, the European Commission (European Platform on Sustainable Urban Mobility Plans, 2020) provided guidelines for the implementation of pedestrian mobility planning interventions (e.g., extension of sidewalks, queue management in transportation infrastructure, creation of temporary public spaces, etc.) aimed at ensuring that citizens can access basic services on foot (i.e., 15 Minute Cities) (Moreno et al., 2021).
Although traditional approaches to the study of pedestrian mobility tend to focus on the spatial dimension (Annunziata & Garau, 2020; Steinfeld, 2011), the individual characteristics of pedestrians have a significant impact on the perceived level of walkability. As highlighted by the 2030 Agenda for Sustainable Development adopted by the United Nations Member States (United Nations, 2016) (i.e., SDG 11.2-Sustainable Transport for All), urban mobility should be designed to be more inclusive with respect to the needs of those in vulnerable situations, such as the elderly, children, and people with disabilities.
In this context, the research focuses on evaluating walkability for children aged 5-13 years, mainly middle school students. The study is part of recent efforts in designing safe, comfortable, and livable streets and public spaces for children (Peyton, 2019; Aerts, 2018; Danenberg, Doumpa & Karssenberg, 2018). Indeed, walkability for children includes the opportunity to play freely in the open air, walk independently and safely, and develop a sense of belonging to their neighborhood (Krysiak, 2020).
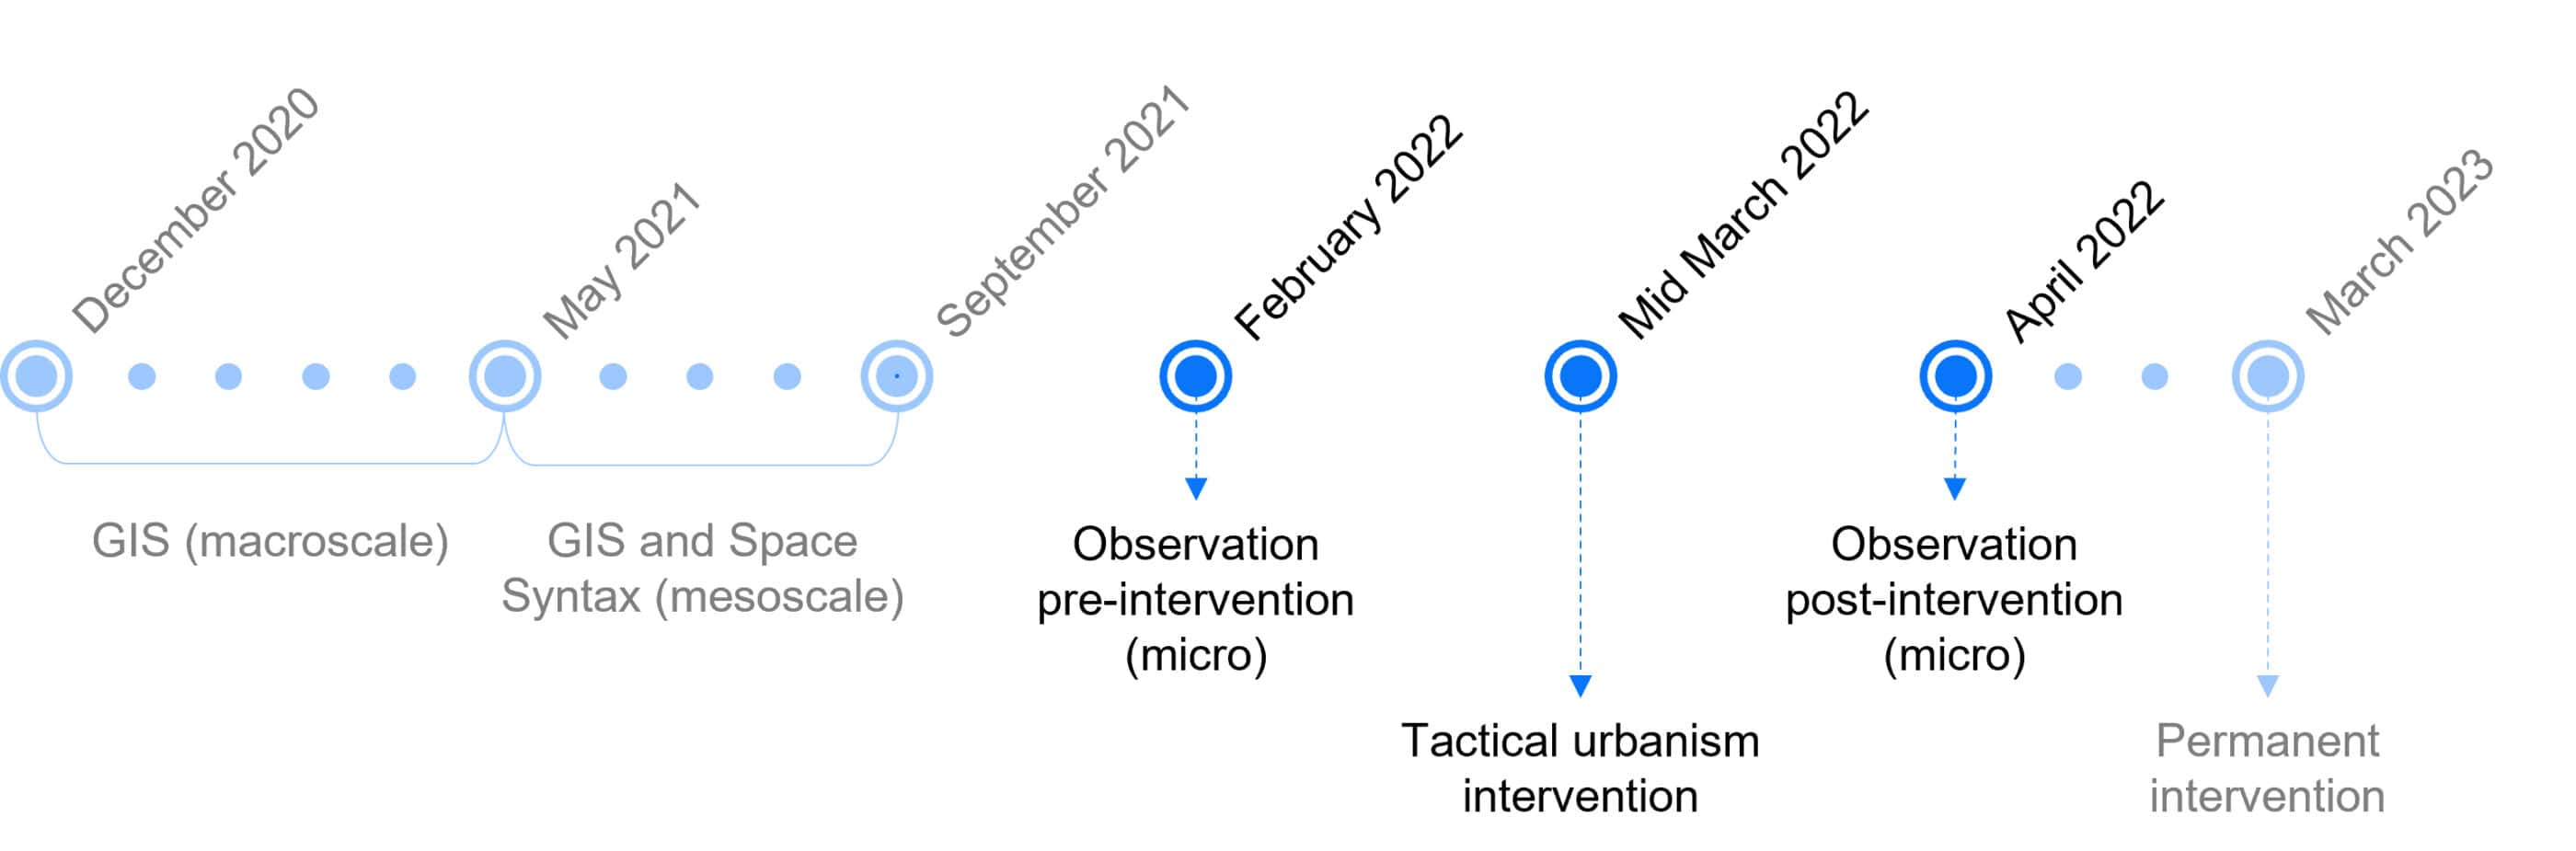
The study was conducted by Systematica and Transform Transport, in collaboration with the Fondazione Innovazione Urbana and the Department of Urban Planning, Housing and Environment of the Municipality of Bologna, with the aim of supporting the planning of sustainable and inclusive mobility strategies in the city of Bologna (see Figure 2). The first phase of the research (i.e., macroscopic scale) began in December 2020 with the objective of assessing the level of pedestrian accessibility of public services dedicated to children’s needs through GIS analysis of georeferenced data made available by the Geoportal of the city of Bologna. The results of this phase of the research were then presented on May 13, 2021, at the 6th Biennale dello Spazio Pubblico (Abdelfattah et al., 2021).
The second phase of the research (May to September 2021) focused on assessing the level of walkability for children in the city of Bologna, according to the following criteria: (i) accessibility of services; (ii) comfort of pedestrian infrastructure; (iii) road safety; and (iv) attractiveness of public spaces. The results of this GIS analysis (Gorrini et al., 2022) focused on the Navile neighborhood (i.e., mesoscale), selected by the Municipality of Bologna for the design of a new public space for children.
The third phase of the study (February to April 2022) involved Fondazione Innovazione Urbana and the Municipality of Bologna for the design of a new square (i.e., microscale), which was implemented in March 2022 through the approach of tactical urbanism and participatory design. In particular, the new square was built in an area used for unregulated parking located in Via Procaccini (Navile), nearby a middle school.
The area was the subject of the study conducted by Systematica and Transform Transport, aimed at monitoring pedestrian and vehicular flows during the pre and post-intervention phases. The monitoring was carried out through camera-supported observations and automated image analysis techniques (Ibrahim, Haworth and Cheng, 2020; Barthélemy et al., 2019; Zhao et al., 2019). The study produced a series of temporal and spatial analyses related to the observed flows in the area (e.g., density maps, space use, average speeds, road crossing behaviors, etc.), with the aim of supporting the iterative design process based on the tactical urbanism approach.
Enabling Data and Methodology
Data Collection Planning
As part of the redevelopment of the area in Via Procaccini, a video data collection campaign was carried out with the aim of conducting a quantitative analysis of the use of the space during the pre- and post-intervention phases. Specifically, the data collection campaign involved monitoring the area for about two months, as follows:
- Pre-intervention: from 07/02/2022 to 04/03/2022;
- Post-intervention: from 02/04/2022 to 31/04/2022.
Video data collection was focused on three daily time slots, with the aim of analyzing space use and activation characteristics in relation to:
- 7 am – 9 am: school entrance;
- 1 pm – 3 pm: school exit;
- 5 pm – 7 pm: spontaneous use of the area.
Data Collection Tools and Placement
Video data were collected using an EXIR camera with a wide-angle lens, an image quality equal to 1280×720 pixels, and a frame rate equal to 15 FPS (Frames Per Second).
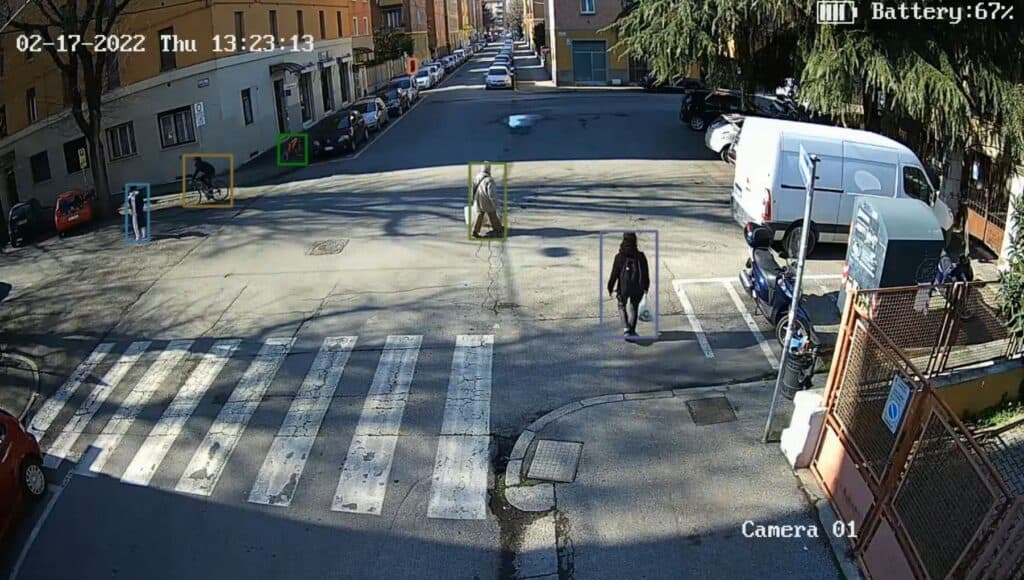
The placement of video data collection equipment was guided by principles of flexibility and reproducibility of the study related to the possibility of relocating the equipment to new areas of intervention. In addition, it was determined by the need to obtain an overall shot of the space to determine its uses (see Figure 3).
Following these principles, the camera was installed on a pole at the corner of Via Procaccini and Via di Vincenzo (north side), at a height of about 3m and with a mean axis of framing parallel to Via Procaccini facing the area of intervention.
Data Analysis Process
The data collected by the camera were processed in four stages:
- Recognize and track objects in the videos using deep learning algorithms;
- Transpose the recognized objects from perspective view to 2D view through a process of geo-referencing the frames;
- Process the geo-referenced data and develop summary metrics for characterizing and quantifying the recognized object events in the area;
- Visualize and map the developed metrics using GIS.
Object Recognition and Tracking
The first phase of the analysis was carried out using deep learning algorithms for object recognition and tracking to quantify pedestrians and vehicles in the area. In particular, two open source algorithms were used: YOLO v5 and Deep Sort.
YOLO-You Only Look Once (Jocher et al., 2021; Gutta, 2021) is an object recognition algorithm based on convolutional neural networks (i.e., CNN). In the context of this study, an open source model of Yolo v5 was used, trained on images taken from CCTV cameras in the city of Montreal.
Deep Sort is an object tracking method based on a recursive application of the Kalman filter, which allows a unique ID to be assigned to the same object recognized in multiple images. More specifically, the Kalman filter uses estimated information about an object’s position and velocity to make predictions about its future location.
The result of the object recognition and tracking process is the creation of a text document in which information about the objects is made explicit in an anonymous form. Each line of the document describes the video frame, object ID (expressed in numeric characters), object class (i.e., pedestrian, vehicle), pixel X, and pixel Y.
Geo-referencing
The second phase of the analysis focused on translating the image coordinates related to the objects identified in the videos (i.e., pixel X, pixel Y) into geographic coordinates (i.e., latitude, longitude). The objective of this phase is to eliminate perspective distortion of the images by locating pedestrians in the target area.
The methodology uses the QGIS implementation of the Thin Plate Spline algorithm as a transformation technique, with Ground Control Points selected to anchor points in the perspective image. The procedure is repeated through an automatic matching algorithm in each frame of the video.
Data Preprocessing and Metrics Development
The third phase of analysis included data validation/ preprocessing and the development of summary metrics designed to quantify and characterize the observed area. In this phase, data from individual videos were merged and spatially discretized on a 1m x 1m grid.
The merged data were then filtered, with the aim of mitigating the influence of factors that systematically prevent object recognition in certain areas of space (i.e., under-sampling) or that promote repeated object recognition (i.e., over-sampling). These may be related to geometric framing configurations or weather and lighting conditions.
To this end, cells that had a cumulative value of recognized objects below the first percentile or above the ninety-ninth percentile of the data distribution were filtered out of the analysis at each time level.
In addition, for the analyses on average pedestrian speeds observed in the area, an additional data validation process was carried out by filtering out objects with a speed greater than the ninety-eighth percentile from the distribution of values.
GIS Analysis and Mapping
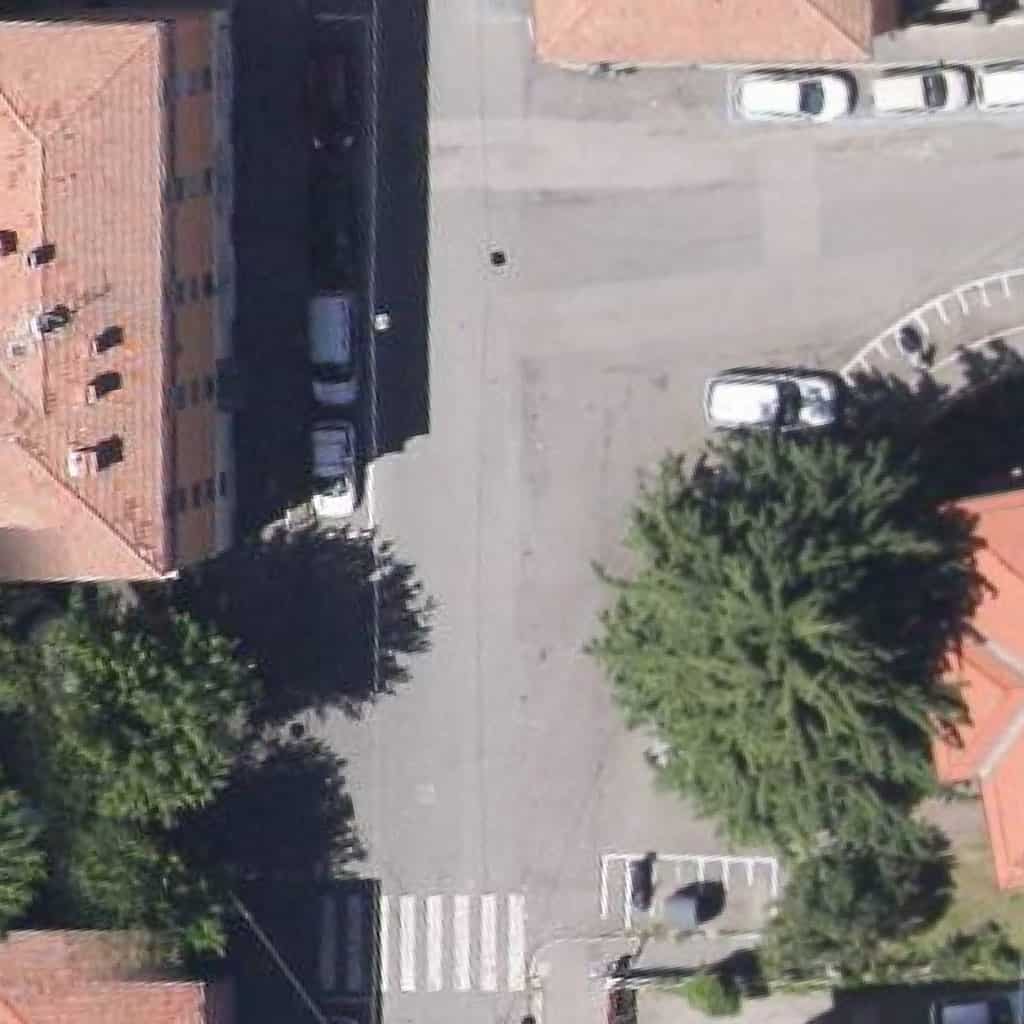
The fourth phase of the analysis focused on the production of maps and graphics obtained through the open-source software QGIS v3.26. Maps describing the average use of the area observed in the phase before and after the tactical urbanism intervention were elaborated (see Figure 4).
Data Analysis Metrics
Data metrics were then implemented, describing the use of the new public space in Via Procaccini. These are discretized spatially and temporally as follows:
- Spatial discretization aims at aggregating pedestrian patterns in the study area on a 1m x 1m grid with the following classification of cells:
- Public Space:
- Games;
- Seating;
- Benches.
- Public Space:
- Temporal discretization aims at identifying cumulative and granular use patterns with a logic of progressive disaggregation such as:
- Average pre-/ post-intervention days;
- Weekdays/holidays;
- Time slots (7:00-9:00 am, 1:00-3:00 pm, 5:00-7:00 pm);
- 15-minute intervals.
Metrics
Cumulative Permanence Time
Cumulative permanence time, expressed in equivalent minutes, quantifies the total number of minutes spent in the study area, discretized on a 1m x 1m grid. This metric made it possible to identify the most heavily trampled areas, hierarchizing the intervention area in relation to its uses. Cumulative dwell time is calculated as the sum of detected pedestrians in a cell, cumulated at different temporal disaggregation.
Average Speed
Analyses of average speeds have made it possible to describe how pedestrians and vehicles use urban space, providing spatial and behavioral classification into:
- Places of rest and play;
- Crosswalk areas;
- Areas of vehicular circulation.
Average speed is a cell-based metric, calculated as the mean velocity in a cell at different temporal disaggregation. Velocities were computed through the Python library MovingPandas which enabled the extraction of trajectories’ attributes for the detected pedestrians.
Results
Times of Activation
The first phase of analysis focused on the study of activation times of Via Procaccini in the phases before and after the tactical urbanism intervention. This analysis focused on weekdays and holidays, divided into three time slots identified as moments characterized by entry to school (7:00 am – 9:00 am), exit from school (1:00 pm – 3:00 pm), and spontaneous use of the area (5:00 pm – 7:00 pm). The three time slots were then divided into 15-minute intervals with the aim of characterizing at a granular level the patterns of use and frequentation of the area.
The level of use was quantified as cumulative dwell time, expressed in equivalent minutes with the aim of estimating the number of minutes spent in the study area. More specifically, equivalent minutes correspond to the sum of minutes spent on each cell of the 1m x 1m grid onto which the area is discretized at each time interval.
Charts 1 and 2 summarize the results of the analysis for weekdays and holidays, depicting the cumulative occupancy time in the period before and after the redevelopment intervention, and the percentage difference in the time intervals. The cumulative occupancy time increases in most of the time intervals following the intervention, confirming the transition from a crossing area to a rest and play area.
Chart 1 shows the trends for weekdays. Significant percentage use level differences are shown between 7:30 am – 7:45 am (+87%) and between 2:15 pm – 2:30 pm (+88%). These results denote a tendency to stop more in the area during the times before and after school hours. In addition, there is a strong percentage increase in the 5:00 pm – 7:00 pm time slot (+77%), in which the area, following the redevelopment, is activated in relation to dynamics no longer related to school functions.
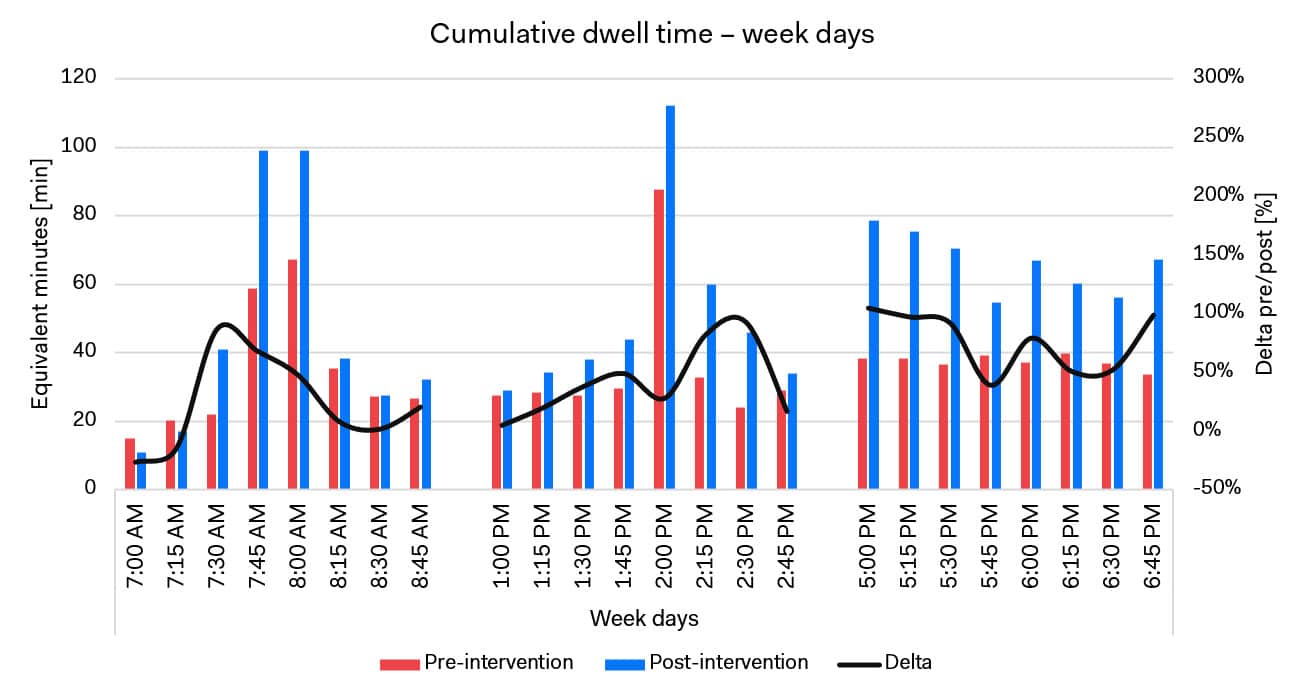
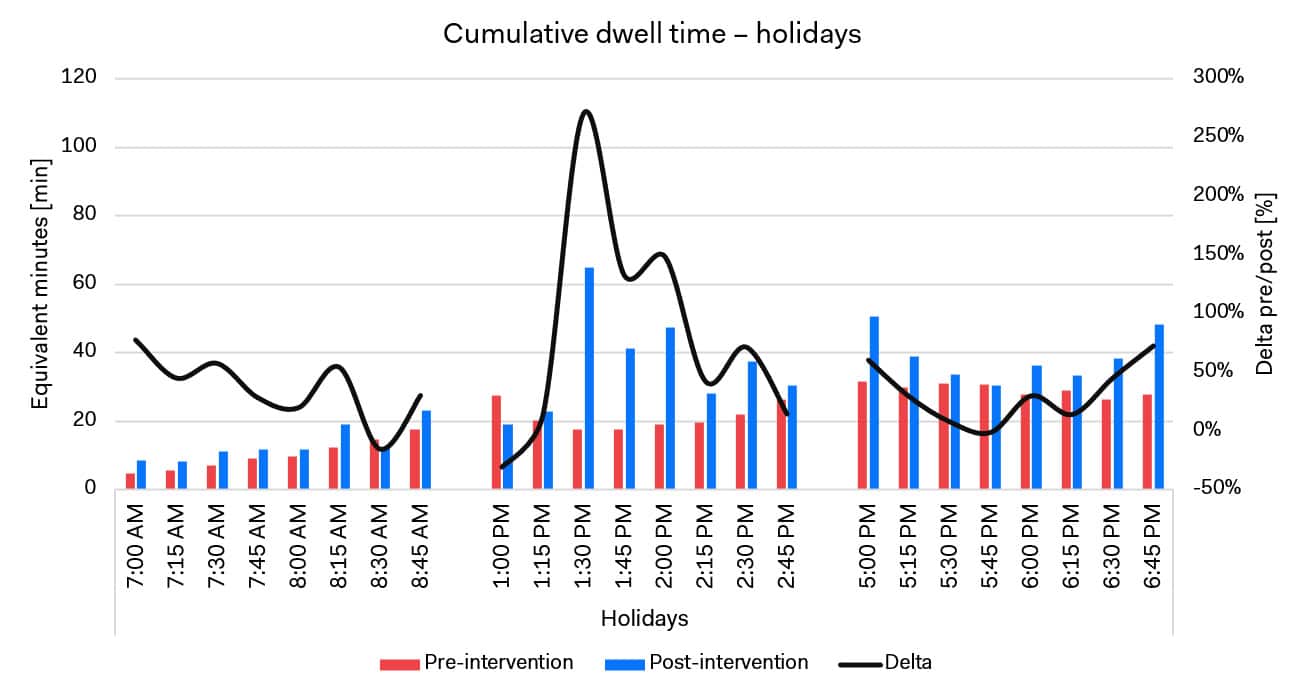
Chart 2 summarizes the results of the analysis for holidays, highlighting patterns of use not related to school functions. Growth peaks in cumulative dwell time emerge, reaching +270% in the 1 pm – 3 pm range. There is also an increase in dwell times in the afternoon slot, with an average increase of +33%. In contrast, the percentage differences related to the morning describe an increase in use related to minimal dwell times and may be related to the seasonality of data collection.
Space Utilization
The space utilization of the new public space in Via Procaccini was quantified through metrics describing cumulative dwell time and average speeds. The cumulative dwell time, expressed in equivalent minutes, made it possible to quantify the number of minutes spent in the study area discretized on a 1m x 1m grid and identify the most trampled areas, thus hierarchizing the intervention area in relation to its uses and describing the overall change in space use by its users.
In particular, the analysis of pedestrian flows was aimed at quantifying the presence of pedestrians and the new spatial configurations defined because of the redevelopment. The results show 43% growth in the cumulative dwell time recorded in the area following the redevelopment intervention. Strong changes in the spatial distribution of pedestrians in the study area are also highlighted.
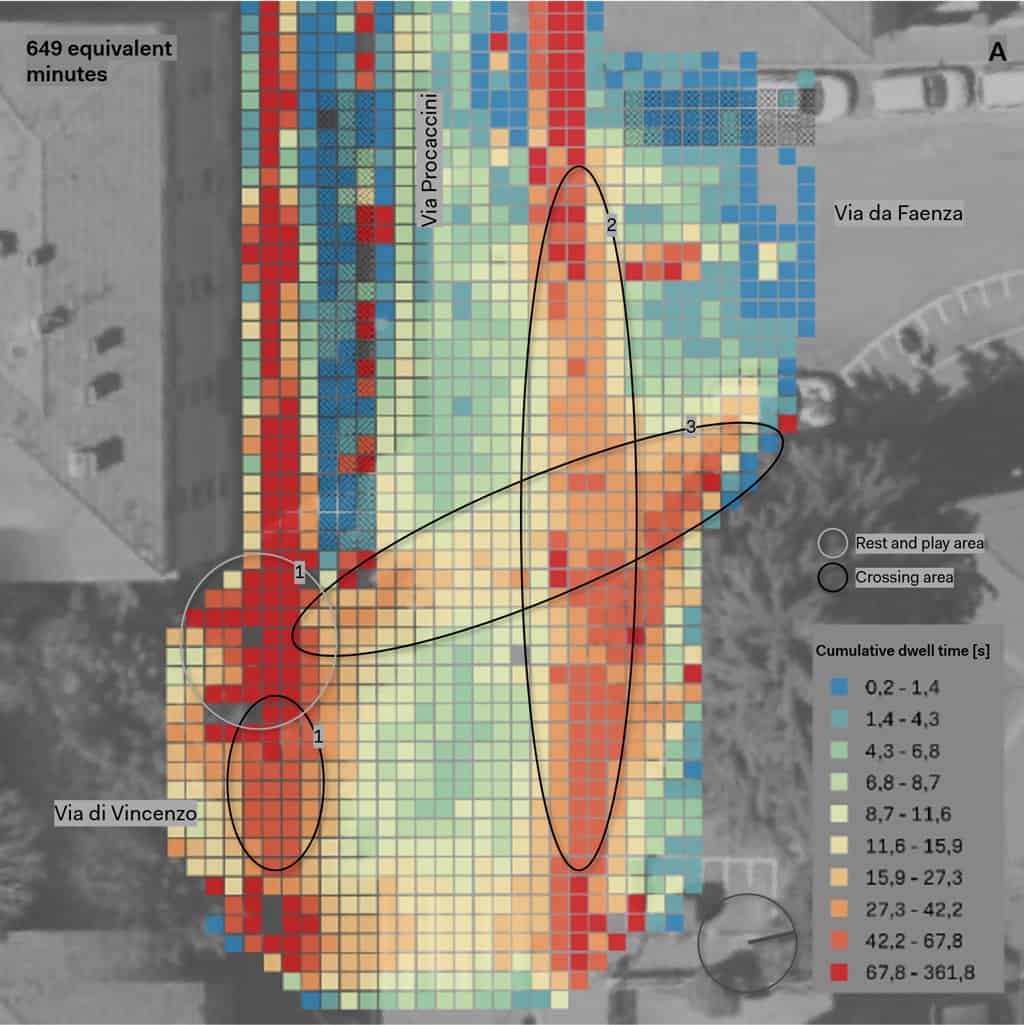
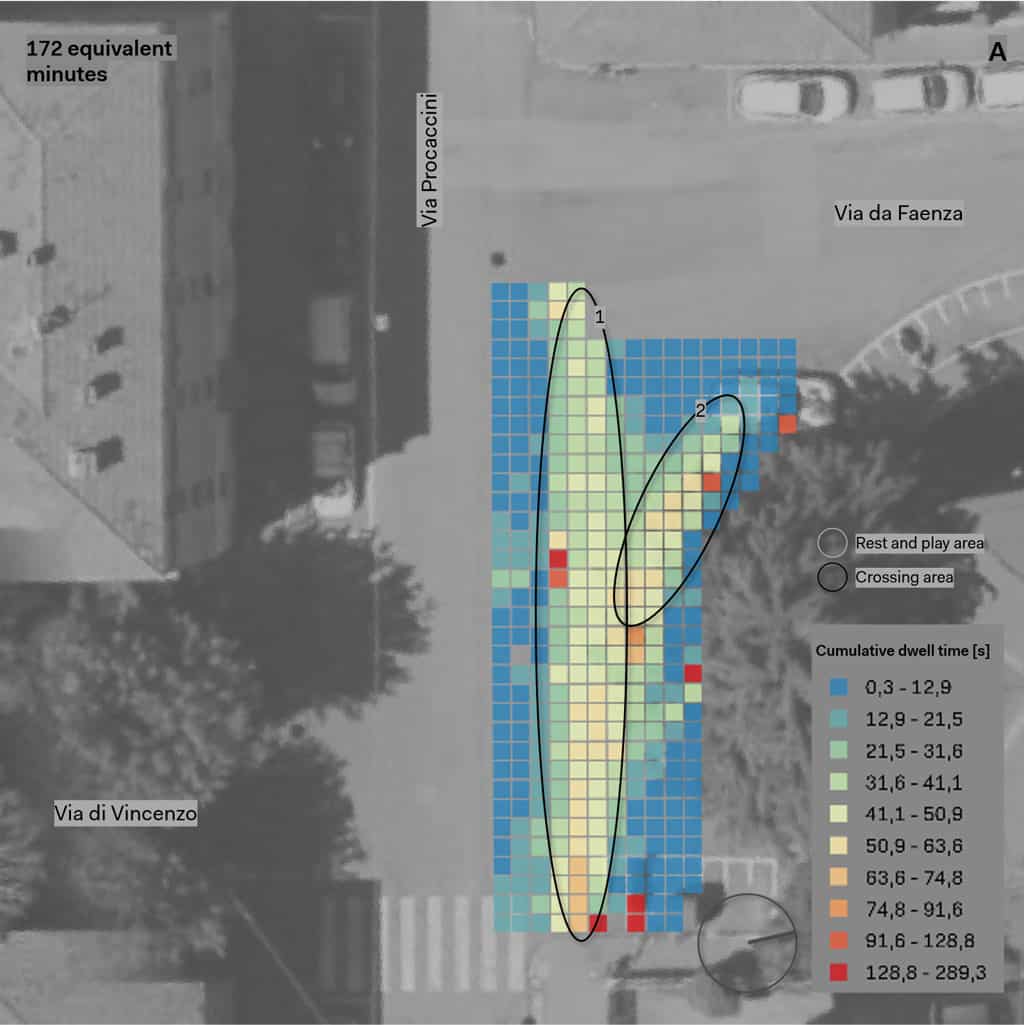
Figure 5A shows the pedestrian use patterns of Via Procaccini in the phase before the redevelopment of the area. Two main passage corridors are highlighted at the two sidewalks on Via Procaccini and a parking area on the sidewalk between Via di Vincenzo and Via Procaccini. Three crossing corridors complementary to the crosswalks between Via Procaccini and Via di Vincenzo are also noted, corresponding to the extension of the sidewalks (1, 2) and the diagonal visual axis of the area (3).
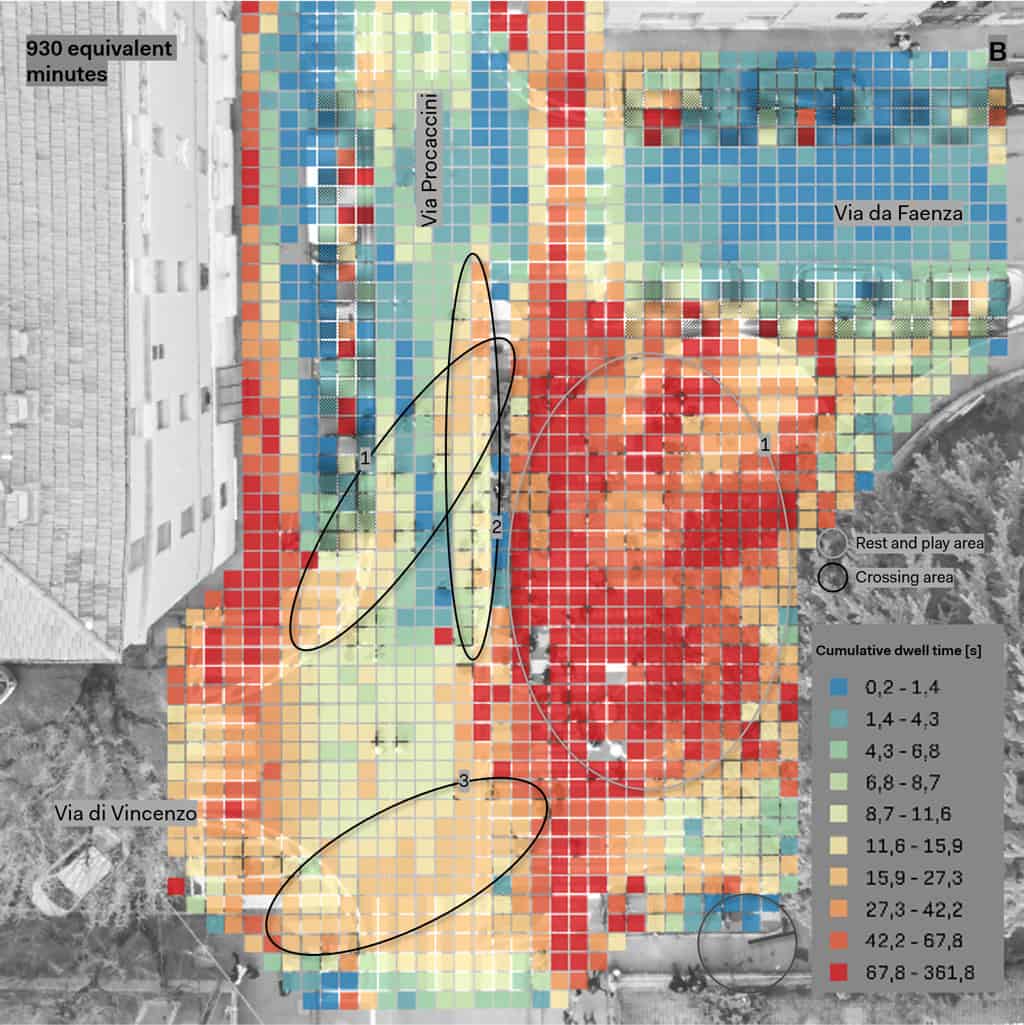
Figure 5B represents the new pedestrian dynamics that originated because of the redevelopment. There is a general increase in dwell time (+43%) and a shift in the preferred place for stopping and playing, which is now identified in the new public space.
Natural crossing corridors (1, 2 in Figure 5A), integrated into the redevelopment design, are activated again; new ones also emerge (1, 2, 3 in Figure 5B). 1, 2 are related to the placement of benches in public space, which blocks the diagonal axis of the area, lengthening the diagonal crossing (1) and promoting passing phenomena adjacent to the square on the side of the roadway (2). Finally, the crossing area at the crosswalk between Via Procaccini and Via di Vincenzo (3) widens, including diagonal flows connecting the square and the school.
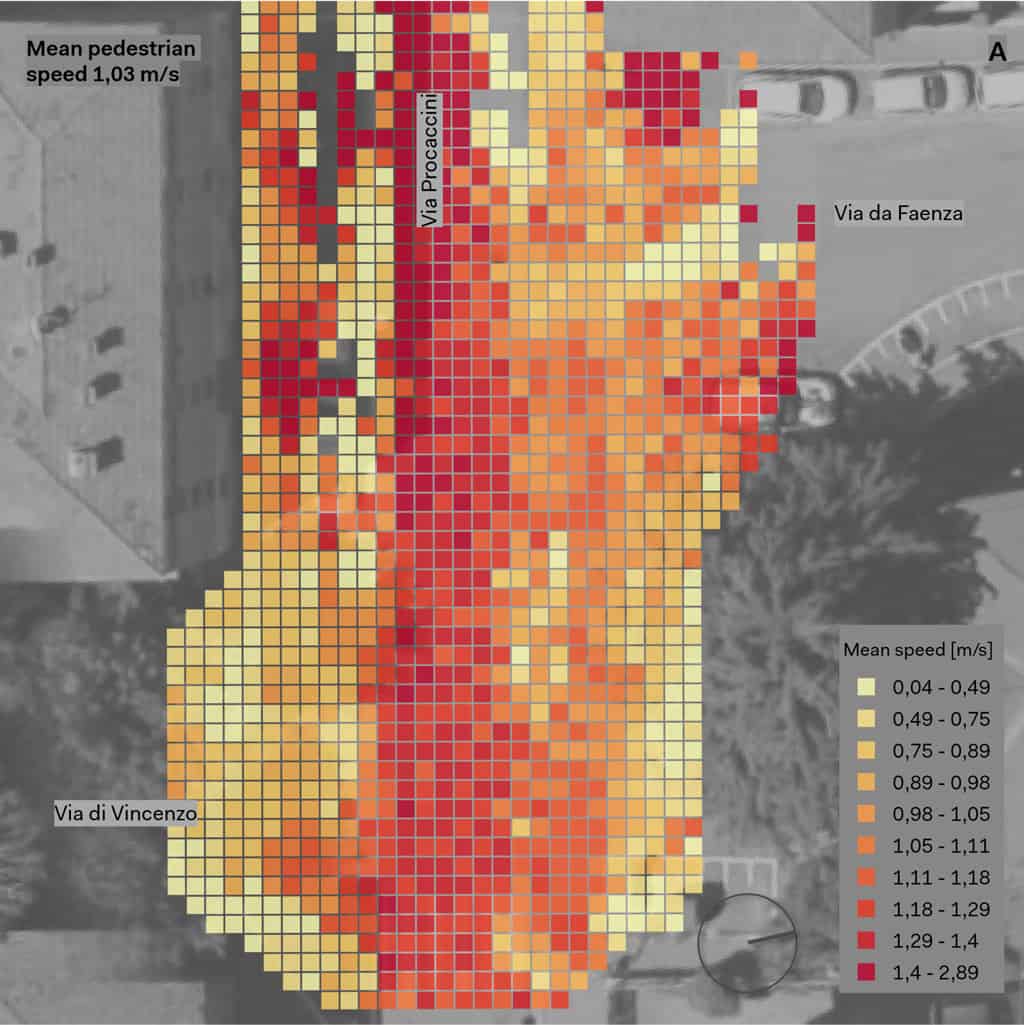
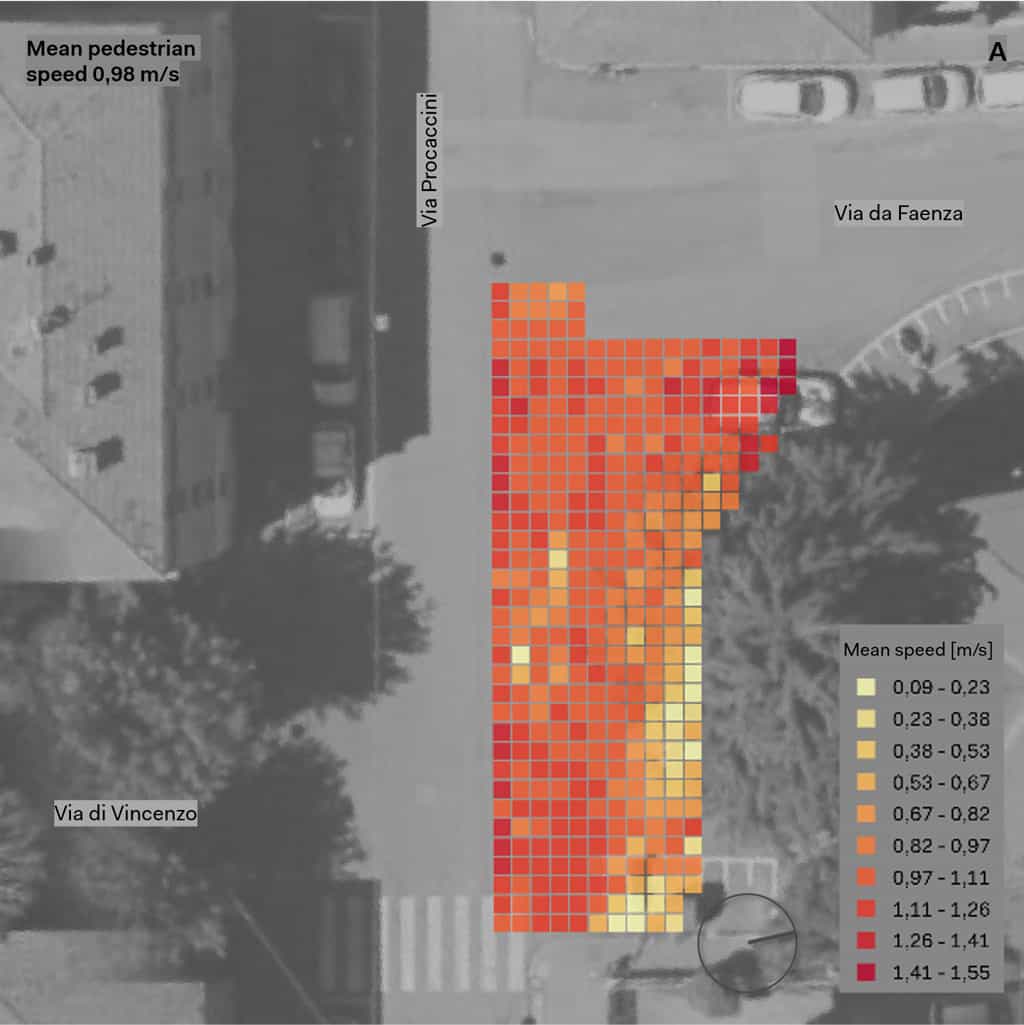
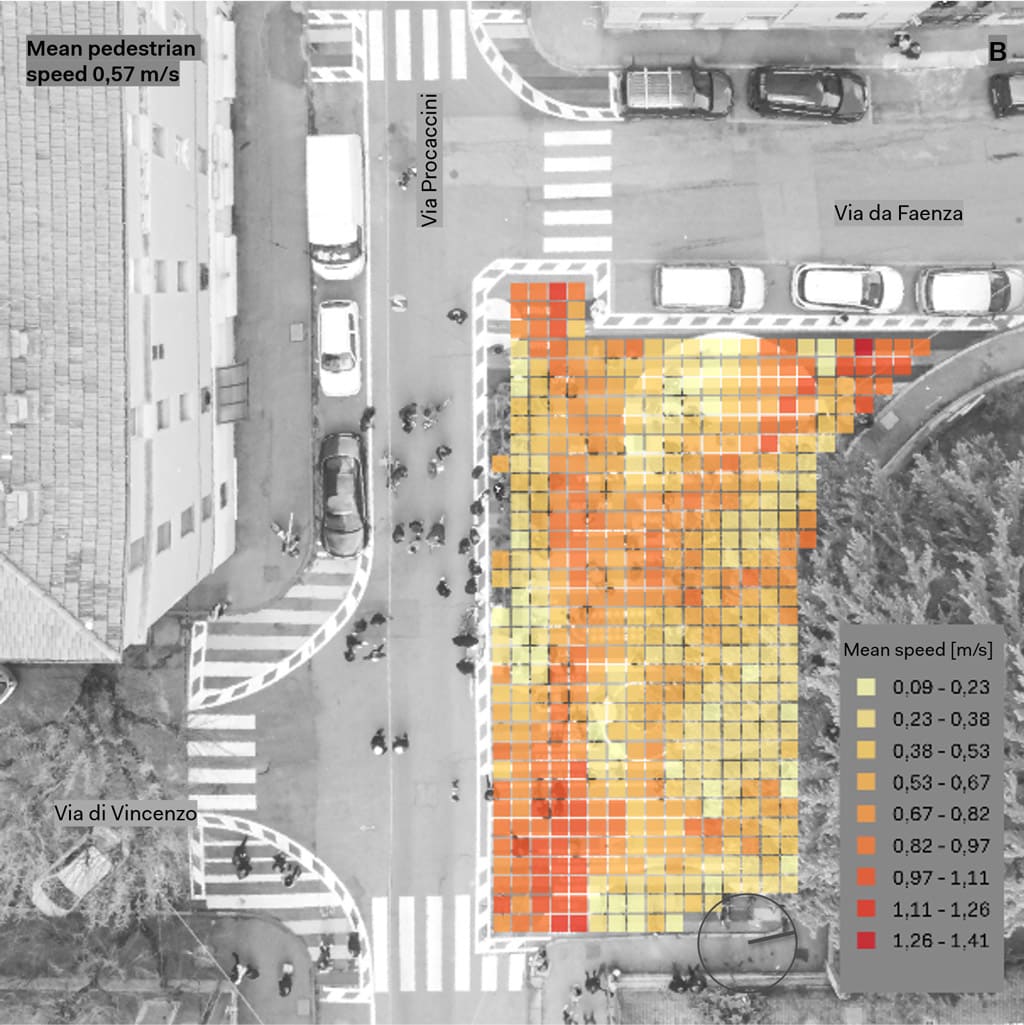
In addition, the analysis of average speeds aims to characterize the new modes of use of public space. Figure 6 (A and B) presents the average pedestrian speeds recorded in the study area during the pre- and post-intervention phases. In general, there is a decrease in speeds throughout the area, with a sharp decrease in the new public space. There are also higher speeds in the areas corresponding to the roadway in both phases of the study.
Finally, an increase in average speed at the crosswalk between Via Procaccini and Via da Faenza is shown in Figure 6B, followed by a decrease at the sidewalk on Via Procaccini.

Public Space
Figure 7 shows the spatial configurations of the new public space originated from the tactical urbanism intervention. The cumulative dwell time of the area, transformed from a crossing area to a rest and play area, increases by 216%. It is also noticeable (see Figure 7B) that the crossing corridors in the area, which were used before the intervention, remain active. However, new use characteristics emerge related to the present furniture (1, 2 games, 3, 4 seats, 5, 6 benches), which have the most significant cumulative dwell times in the area.

More specifically, Table 1 lists summary metrics describing the use of the three types of furniture in relation to the overall use of the new public space during the post-intervention phase. Seating has the largest increase in average permanence time compared to the new public space (+100%), followed by benches (+82%) and games (+79%).

Chart 3 shows the delta of use of the furniture with respect to the overall space of the new public space in the three time slots of analysis. Strong percentage growth in the use of the three objects can be seen on weekdays, where benches and seating show the largest changes, particularly in the afternoon (benches +203%, seating +195%, games +163%). On holidays, on the other hand, an inverse trend emerges in the morning, where the use of the area related to crossing needs prevails. In the daytime and afternoon, on the other hand, strong positive deltas emerge for benches (13-15 +176%, 17-19 +64%) and games (13-15 +116%, 17-19 +37%).
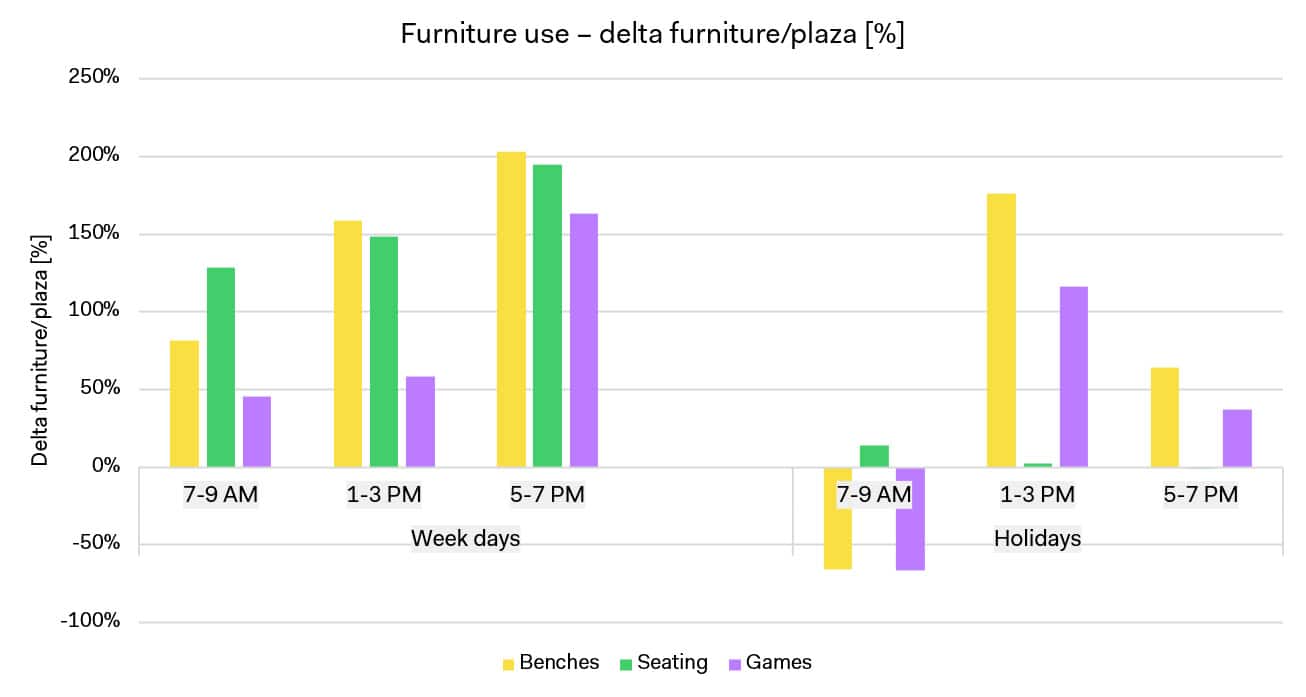
Figure 8 presents the spatial characteristics related to average speeds in the new public space. This presents a major lowering of average speeds (-42%), related to the new play and parking functions within it. Four crossing corridors in the area, complementary to the play areas identified in the furniture analysis, are highlighted, where the average speeds present values above 0.82 m/s.
Final Remarks and Future Work
Results made it possible to quantify through a critical reading the effectiveness of the urban regeneration intervention implemented in Via Procaccini. The proposed data-driven design approach is presented in this case through the monitoring of the pre/ post-intervention phases.
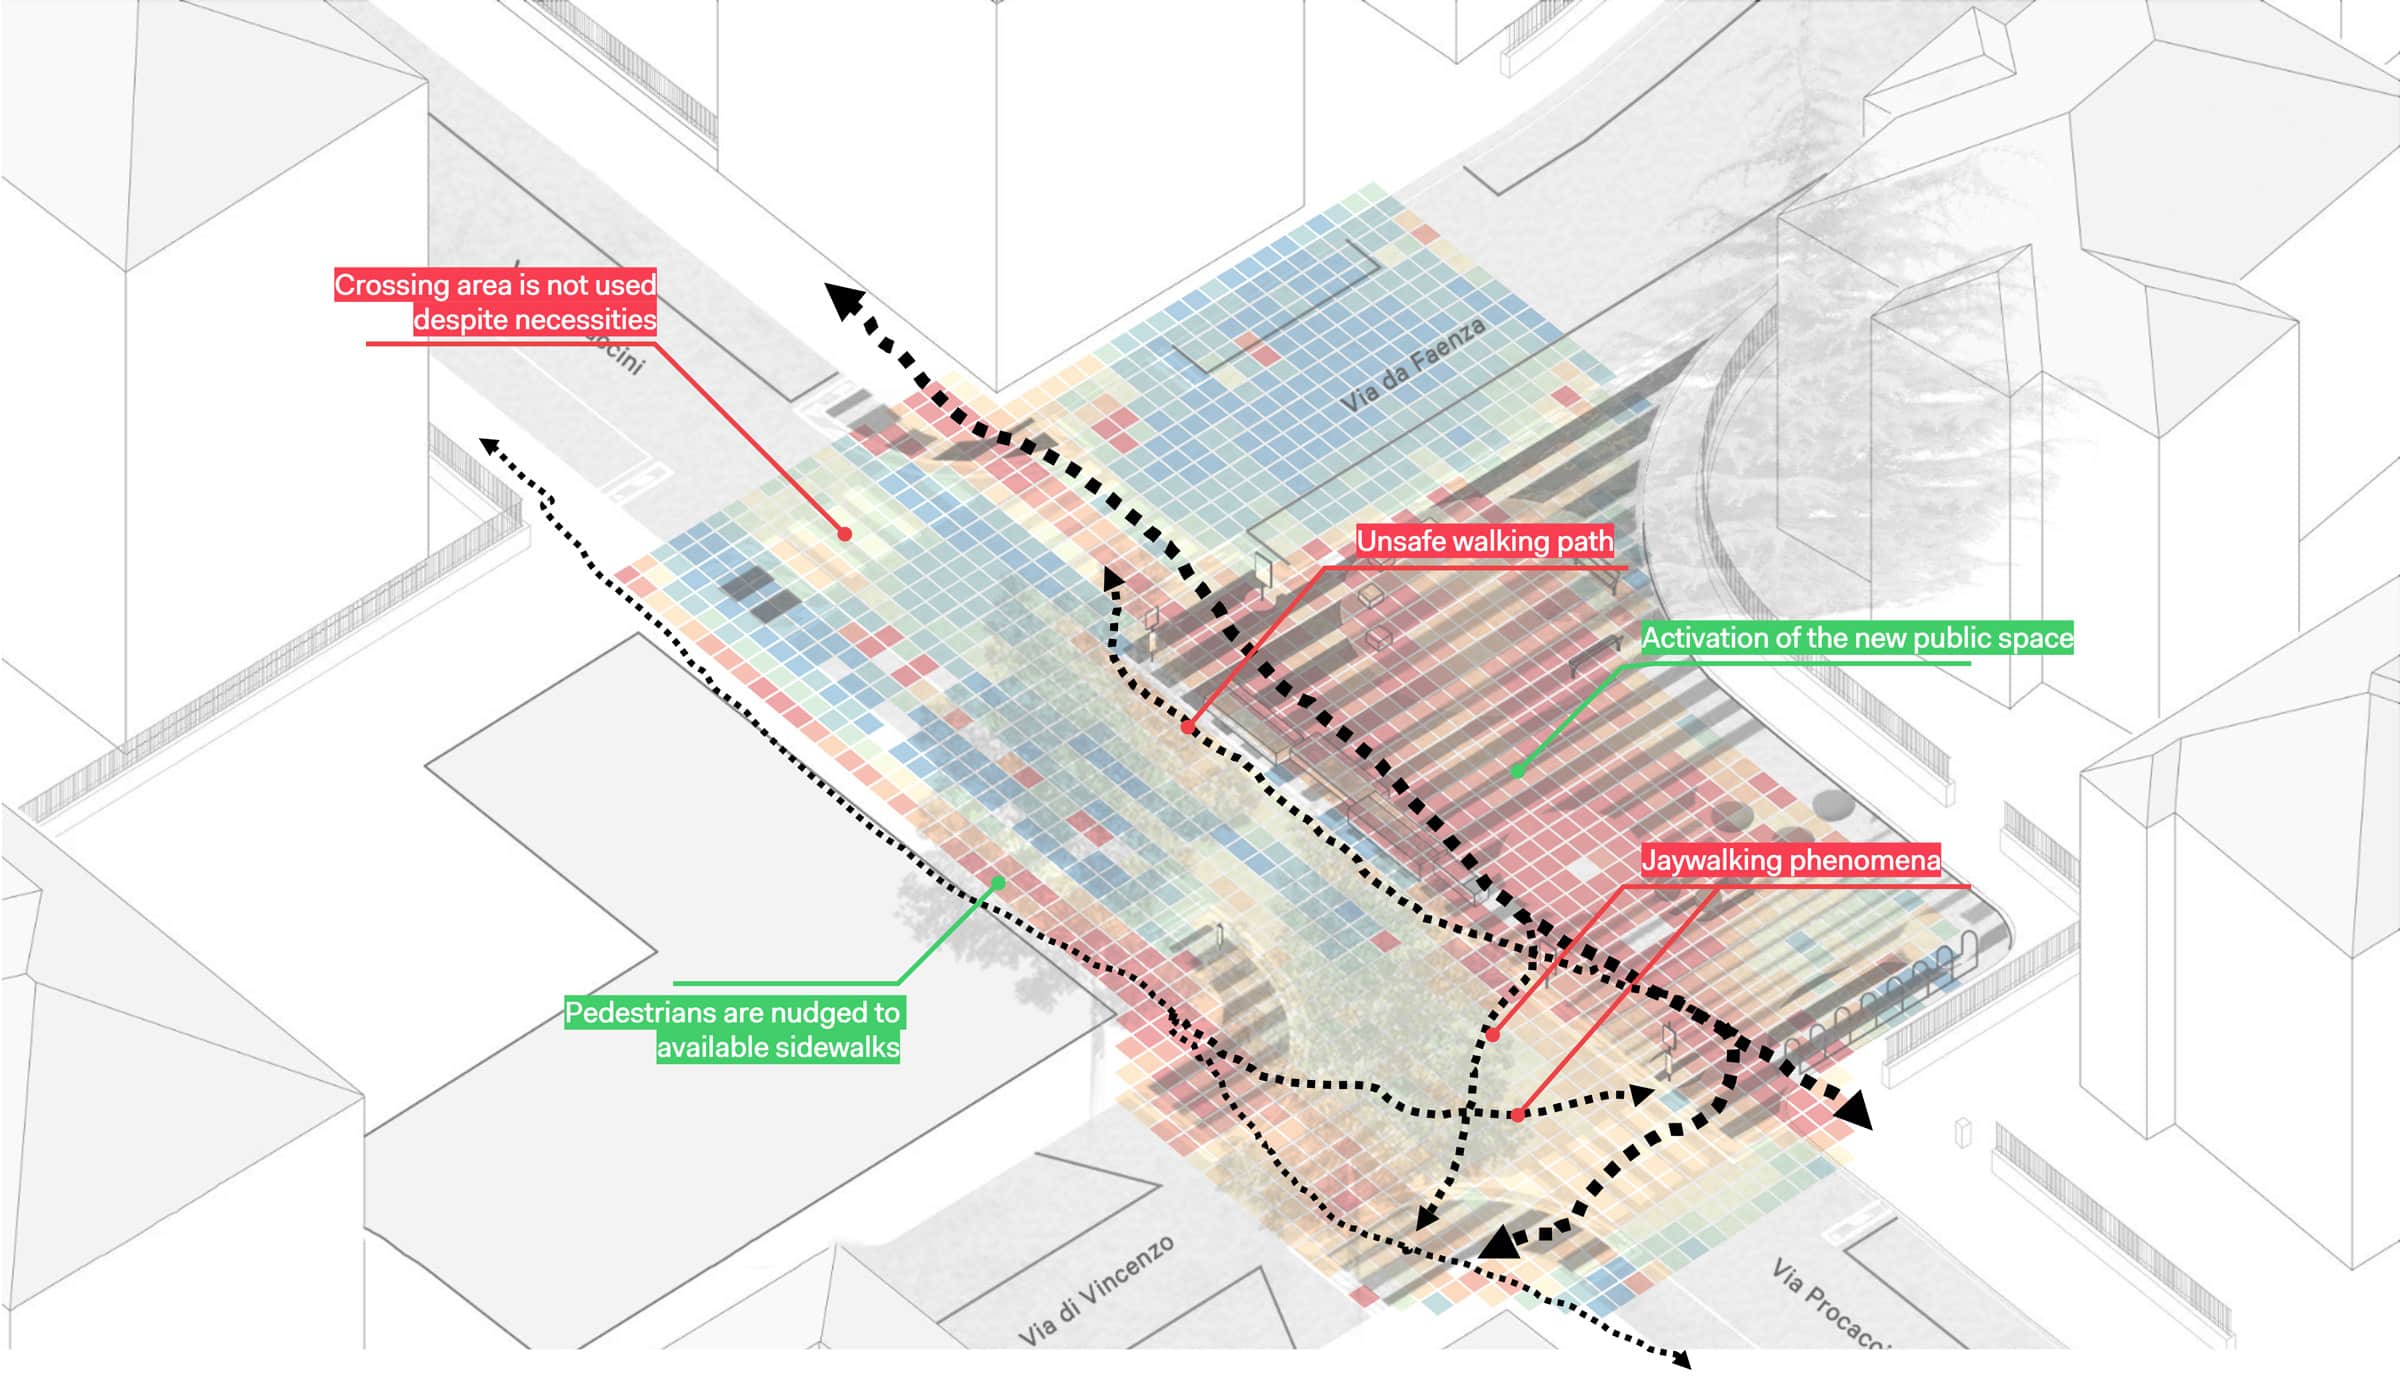
As shown in Figure 9, space use is in direct relation to the form and functions present. Previous analyses, in fact, have highlighted the delta between pre/ post-intervention phases and the role that furniture plays in influencing dwell time. By analyzing the maps with a critical view, it is possible to identify the successful and critical elements of this intervention and use these observations to inform subsequent design phases.
In the case of cumulative dwell time, which measures the use of the different areas of the new public space, the flows and infrastructure do not always coincide. The crosswalks across Via Procaccini are not perceived by the flows as the only possible place to cross the street. In particular, the crosswalks at the height of Via di Vincenzo are only partially used by pedestrians crossing the street; most pedestrians use the space in direct connection with the centerline of the street, cutting diagonally across the roadway. In parallel, the crosswalks at the height of Via da Faenza are not particularly used. In contrast, the crossings parallel to Via Procaccini are used by most users, as is the sidewalk opposite the public space, which manages to effectively channel flows.
In addition to the crossings outside the crosswalks, it is also possible to identify a flow parallel to the new public space, outside the planters, which follows the prevailing direction of travel in the widening. This alternative route occurs within the roadway and often in the opposite direction of travel, remaining outside the impassable furnishings of the pedestrianized space.
The elements of success and criticality highlighted in Figure 9 contain information that is extremely useful to a possible subsequent design phase. The shift from a quantitative approach, based on the analysis of collected data, and a synthetic/ design approach is the basis of data-driven design: the goal is to maximize the effect of positive interventions and resolve the critical issues found. The ideal approach to this type of design is the construction of an iterative process, which quantifies each intervention separately and whose design part is repeated after each monitoring phase, creating a continuous circle of hypotheses and solutions.
The results of this research have been presented at the 22nd International Walk21 Conference on Walking and Liveable Communities, 19-23 September 2022, Dublin (Ireland) and published in the Journal of Urban Mobility: Ceccarelli, G., Messa, F., Gorrini, A., Presicce, D., & Choubassi, R. (2023). Deep learning video analytics for the assessment of street experiments: The case of bologna. Journal of Urban Mobility, 4, 100067. https://doi.org/10.1016/j.urbmob.2023.100067
Acknowledgment
We thank Fondazione Innovazione Urbana and the Municipality of Bologna for their fruitful collaboration. An extended Italian version of the study report is available at this link. The analyzed data were treated according to the GDPR-General Data Protection Regulation (EU, 2016/679). This research didn’t receive any specific grant from any funding agency in the public, commercial, or not-for-profit sectors.
References
Abdelfattah, L., Boni, G., Carnevalini, G., Choubassi, R., Gorrini, A., Messa, F., Presicce, D. (2021). A user-centric approach to the 15-minute city. Examining children’s walkability in Bologna. In: Proceedings of the 57th ISOCARP World Planning Congress 2021, 8-11 November 2021, Doha (Qatar), pp. 582–592. Available at: https://doha2021.dryfta.com/programme/discussions/sponsor-lounge/proceedings
Abley, S., Hill, E. (2005). Designing living streets-a guide to creating lively, walkable neighbourhoods. Living Streets.
Aerts, J. (2018). Shaping urbanization for children: A handbook on child responsive urban planning. UNICEF. Available at: https://www.unicef.org/media/47616/file/UNICEF_Shaping_urbanization_for_children_handbook_2018.pdf
Annunziata, A., Garau, C. (2020). A literature review on walkability and its theoretical framework. emerging perspectives for research developments. In: International Conference on Computational Science and Its Applications, Springer. pp. 422–437. https://doi.org/10.1007/978-3-030-58820-5_32
Barthélemy, J., Verstaevel, N., Forehead, H., & Perez, P. (2019). Edge-Computing Video Analytics for Real-Time Traffic Monitoring in a Smart City. Sensors, 19(9), 2048. https://doi.org/10.3390/s1
Buhrmann, S., Wefering, F., Rupprecht, S. (2019). Guidelines for Developing and implementing a sustainable urban mobility plan – 2nd edition. Rupprecht Consult-Forschung und Beratung GmbH. Available at: https://www.eltis.org/mobility-plans/sump-guidelines
City of Montreal (2021). Annotated images taken from the video stream of traffic cameras. Information Technology Department. Available at: https://donnees.montreal.ca/ville-de-montreal/images-annotees-cameras-circulation
Danenberg, R., Doumpa, V., Karssenberg, H. (2018). The City at Eye Level. STIPO Publishing. Available at: https://thecityateyelevel.com/app/uploads/2019/06/eBook_CAEL_Kids_Book_Design_Kidsgecomprimeerd.pdf
European Platform on Sustainable Urban Mobility Plans (2020). COVID-19 SUMP Practitioner Briefing. CIVITAS SATELLITE CSA. Available at: https://www.eltis.org/sites/default/files/covid-19_sumppractitionersbriefing_final.pdf
Gehl, J. (2013). Cities for people. Island press.
Gorrini, A., Presicce, D., Messa, F., Choubassi, R. (2022, submitted). Walkability for Children in Bologna: Beyond the 15-minute City Framework. Journal of Urban Mobility.
Gutta, S. (2021). Object Detection Algorithm — YOLO v5 Architecture. Medium. Available at: https://medium.com/analytics-vidhya/object-detection-algorithm-yolo-v5-architecture-89e0a35472ef
Ibrahim, M. R., Haworth, J., & Cheng, T. (2020). Understanding cities with machine eyes: A review of deep computer vision in urban analytics. Cities, 96, 102481. https://doi:10.1016/j.cities.2019.102481
Jocher, G., Chaurasia, A., Stoken, A., et al. (2021). ultralytics/yolov5: v5.0 – YOLOv5-P6 1280 models, AWS, Supervise.ly and YouTube integrations (v5.0). Zenodo. https://doi.org/10.5281/zenodo.4679653
Krysiak, N. (2020). Designing Child-Friendly High Density Neighbourhoods. Transforming our cities for the health, wellbeing and happiness of children. Cities For Play. Available at: https://www.citiesforplay.com/_files/ugd/534edb_5e8553bb853d40228da3083a0ed1eede.pdf
Moreno, C., Allam, Z., Chabaud, D., Gall, C., Pratlong, F. (2021). Introducing the “15-Minute City”: Sustainability, Resilience and Place Identity in Future Post-Pandemic Cities. Smart Cities, 4, 93–111. https://doi.org/10.3390/smartcities40100066
Peyton, A. (2019). Designing Streets for Kids. NACTO-Global Designing Cities Initiative. Available at: https://globaldesigningcities.org/publication/designing-streets-for-kids/
Speck, J. (2013). Walkable city: How downtown can save America, one step at a time. Macmillan.
Steinfeld, E. (2011). Universal Design Handbook – Second Edition. McGraw-Hill Publishers.
Transform Transport (2022). Shifting Paradigm: the impact of Covid-19 on transport planning (second edition). Fondazione Transform Transport ETS. Available at: https://issuu.com/systematica/docs/shifting_paradigm_2_transform_transport
United Nations (2016). Transforming Our World: The 2030 Agenda for Sustainable Development. United Nations. Available at: https://sustainabledevelopment.un.org/post2015/transformingourworld/publication
Zhao, Z., Zheng, P., Xu, S., & Wu, X. (2019). Object Detection with Deep Learning: A Review. IEEE Transactions on Neural Networks and Learning Systems, 30, 3212-3232. https://doi.org/10.48550/arXiv.1807.05511