The Play Accessible Communities (PAC) project, funded by EIT Urban Mobility, aims to develop socially and spatially inclusive mobility strategies for European cities by integrating data-driven accessibility analysis with participatory co-design. PAC was led by Play the City, a global practice that supports spatial development processes through city gaming, together with Transform Transport, the İzmir Planning Agency (İZPA), and the İzmir Metropolitan Municipality (İMM). The project was developed between February and November 2025 in İzmir, Transform Transport applied the 15-Minute City Score Toolkit to assess walkable access across the city, overlaying accessibility metrics with socio demographic understanding, while Play the City, supported by İZPA and IMM, contributed the City Gaming methodology that translated these insights into community co-design outcomes, documented in the PAC Micro Mobility Playbook. Together, the three partners produced a replicable, open-source framework for evidence-based and inclusive micro mobility planning, with Üçkuyular as the pilot case.
Introduction
Micro mobility hubs are increasingly recognized not only as transport nodes but as opportunities to redesign public space in ways that are inclusive, climate-responsive, and community-led. The Play Accessible Communities (PAC) project, funded by EIT Urban Mobility, develops a replicable methodology to plan and co-design such hubs by combining spatial data analysis with participatory processes. İzmir is the project’s first implementation city. The PAC project took place there between February and November 2025, bringing together Play the City as coordinator, Transform Transport, the İzmir Planning Agency (İZPA), and the İzmir Metropolitan Municipality (İMM).
PAC unfolds in four steps: (i) Policy Alignment, situating hub design within existing mobility frameworks such as SUMPs and transport master plans; (ii) Mobility Metrics meet Social Data, combining the 15-Minute City Score with socio-demographic to identify where mobility gaps, and vulnerabilities, pressures overlap; (iii) City Gaming, a structured participatory process in which accessibility data is layered onto game boards, enabling planners, municipal departments, communities, and youth to collectively design and prioritize interventions; and (iv) Action Agreement, a formal roadmap converting co-design outcomes into committed, financed, and actionable interventions. The full methodology is documented in the PAC Micro Mobility Playbook (Play the City, 2026).
Within the project, Transform Transport contributed in the “Mobility Metrics meet Social Data” step, applying the 15-Minute City Score Toolkit (Albashir et al., 2024b) to assess walkable accessibility across the city and for six pre-selected Micro Mobility Hub sites, and overlaying these results with multiple layers to reveal where accessibility gaps and social vulnerabilities coincide. These results were then applied into the co-design process and are made accessible through an interactive WebGIS developed by Transform Transport (Transform Transport, 2024).
Enabling Data and Methodology
“Mobility Metrics meet Social Data” is built on the principle that accessibility layers should be enriched with socio-demographic and contextual data to build a more complete picture of urban mobility needs. Combining the 15-Minute City Score with these additional layers reveals where accessibility gaps and social vulnerabilities coincide, strengthening the case for targeted micro mobility interventions.
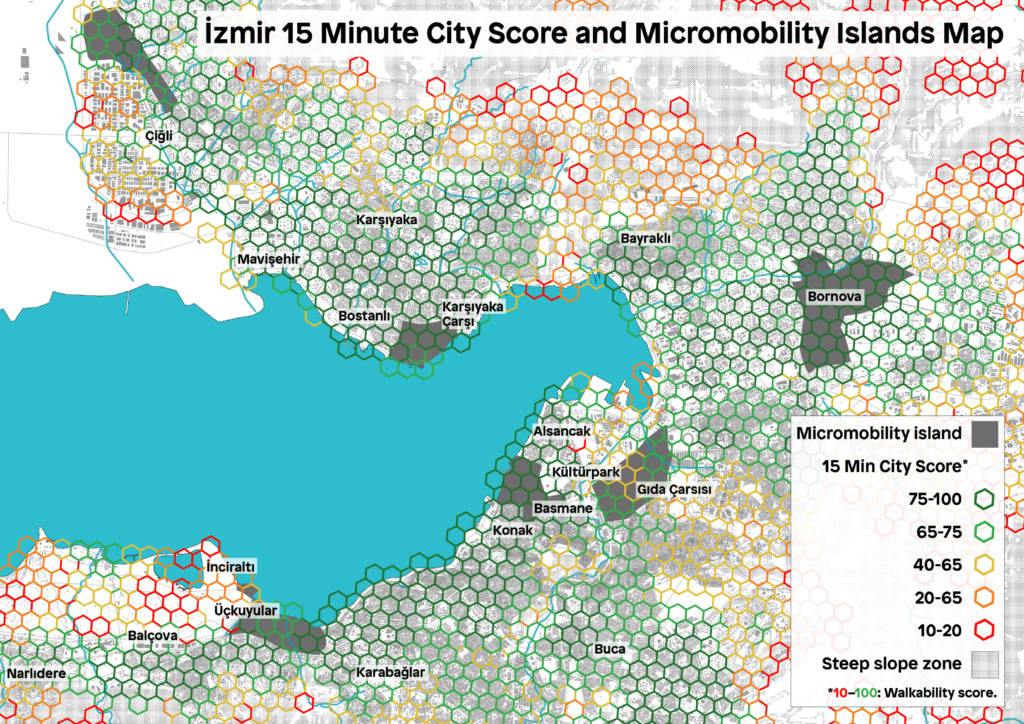
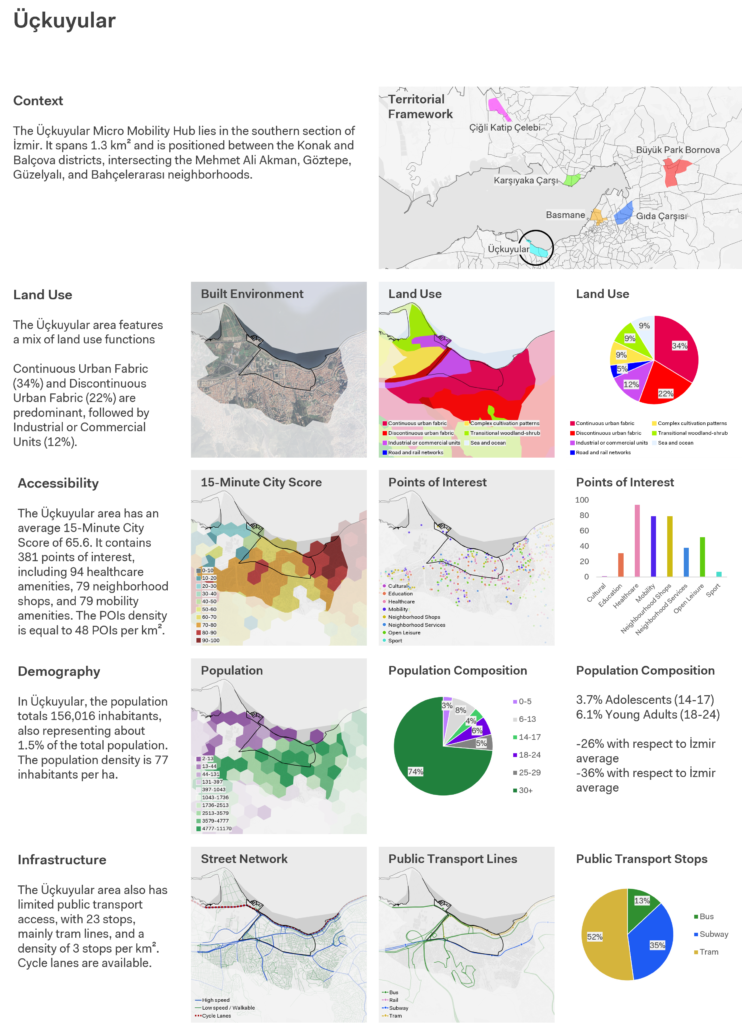
The data layers are organized across four dimensions (see Table 1): (i) context covers the territorial framework and land use patterns, based on CORINE Land Cover (European Environment Agency, 2019); (ii) accessibility is assessed through the 15-Minute City Score (Albashir et al., 2024a), a composite metric quantifying proximity to services within a 15-minute walking catchment, and complemented by the quantity, type, and distribution of Points of Interest sourced from OpenStreetMap (OSM); (iii) demography draws on İZPA data to profile total population and key age cohorts (i.e., adolescents (14–17) and young adults (18–24)) as the primary potential users of micromobility services; (iv) infrastructure captures the composition of the street network (i.e., walkable, cyclable) and the availability and typology of public transport nodes (see Table 1).
The six Micro Mobility Hubs sites were pre-selected based on the World Bank’s micromobility island proposals for İzmir. The analysis combines a qualitative reading of each site, structured as a per-hub profile covering urban context, land use mix, demographic composition, and infrastructure conditions, with a quantitative comparison across hubs. For the quantitative analysis, the profile of each Micro Mobility Hub is built from a 15-minute walking catchment defined by the actual street network from the hub centroid. Then, Welch’s t-tests assess whether accessibility differences between sites are statistically significant, while k-means clustering groups hexagonal cells across and within hub catchments into accessibility typologies. The analysis reveals not only how hubs compare to each other, but also the degree of internal variation within a single catchment.
Results
The analysis assessed six pre-selected Micro Mobility Hub sites across İzmir’s metropolitan area, each representing a distinct urban context, from dense coastal districts to peri-urban fringes. For each site, the four analytical dimensions described above (i.e., context, accessibility, demography, and infrastructure) were combined to build a comparative profile and identify where spatial conditions are most favorable for micro mobility and where targeted investment is needed first.
Qualitative Analysis
The qualitative analysis produced a structured profile for each of the six Micro Mobility Hubs sites, combining the four analytical dimensions into a comparative overview. The profiles reveal that each hub operates under distinct spatial conditions, in terms of walkable accessibility, land use mix, demographic composition, and infrastructure provision, requiring differentiated planning responses. Figure 2 illustrates an example profile for Üçkuyular.
Quantitative Analysis
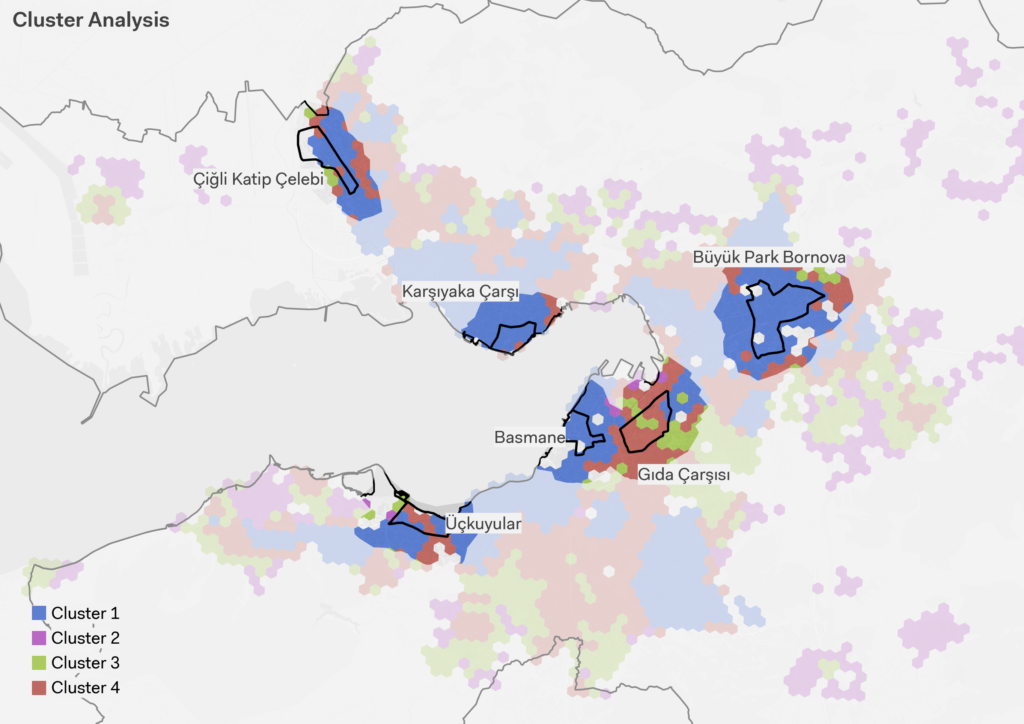
Statistical comparison confirms that accessibility conditions differ significantly across hubs, validating the need for site-specific planning approaches rather than uniform strategies. K-means clustering further reveals distinct accessibility typologies, both across hubs and within individual catchments, showing that a single hub can contain highly varied conditions in different parts of its area (see Figure 3). This intra-hub variation is a key planning insight: it points to the need for localized, fine-grained interventions rather than blanket hub-wide decisions.
Supporting the Co-Design Process
The spatial analysis directly informed the selection of Üçkuyular as the PAC pilot site, a major multimodal interchange combining ferry, bus, tram, and metro that nonetheless underperforms in walkable accessibility. The 15-Minute City Score maps and POI data served as the analytical foundation for Play the City’s City Gaming sessions, grounding co-design discussions in spatial evidence (see Figure 4). Full outcomes are documented in the PAC Micro Mobility Playbook (Play the City Foundation, 2025).
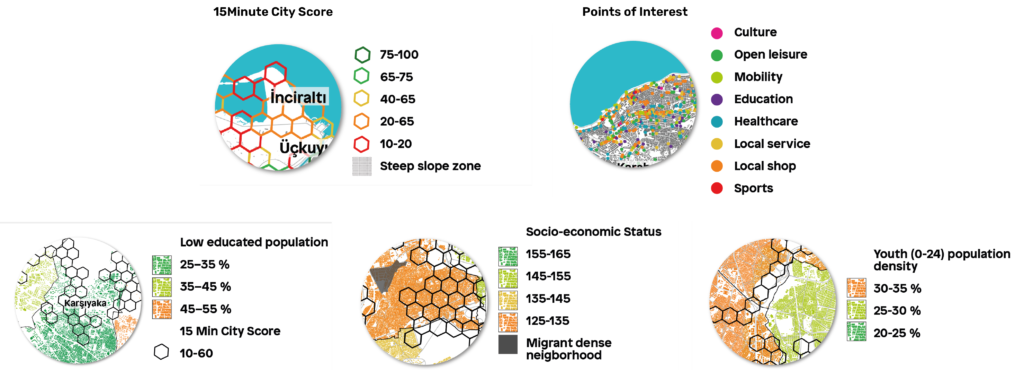
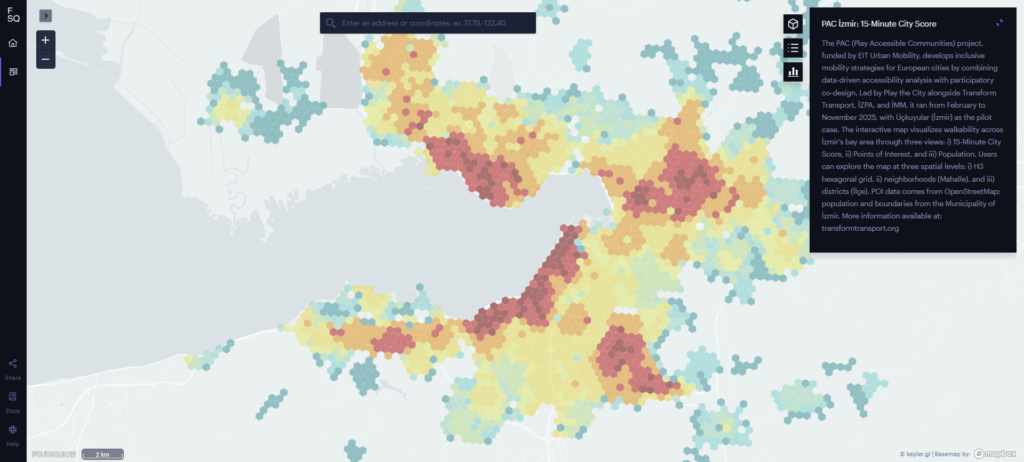
The accessibility and demographic layers are made publicly available through an interactive WebGIS developed by Transform Transport, allowing planners and municipal departments to explore the 15-Minute City Score, Points of Interest, and population distribution across İzmir’s bay area at neighbourhood and district level (see Figure 5).
Conclusions and Future Works
The PAC İzmir analysis demonstrates that the 15-Minute City Score Toolkit can serve as a practical, evidence-based layer for micro mobility planning, combining qualitative site profiling with quantitative spatial comparison to produce results that are both analytically rigorous and directly applicable to planning practice.
From an analytical standpoint, the qualitative profiles reveal that each of the six Micro Mobility Hub sites operate under distinct conditions in terms of land use, demographics, and infrastructure, making differentiated planning responses necessary. Quantitatively, statistical testing confirms that accessibility differences across hubs are significant, while k-means clustering identifies typologies both across and within catchments. The degree of intra-hub variation is a particularly relevant finding: a single hub can contain highly contrasting accessibility conditions, pointing to the need for localized interventions rather than uniform strategies.
From an applied standpoint, the spatial analysis proved directly usable in practice. The combined accessibility and demographic layers informed the selection of Üçkuyular as the pilot co-design site and grounded Play the City’s City Gaming sessions in spatial evidence. Building on this first implementation, next steps include embedding PAC as a citywide operational tool within İZPA’s planning cycles, expanding the analysis to additional İzmir districts, and developing a library of replicable micromobility hub typologies. Enriching the data ecosystem with dynamic mobility behavior, gender-sensitive safety indicators, and climate-risk layers should strengthen future iterations.
Acknowledgments
We thank Play the City, the İzmir Planning Agency (İZPA), and the İzmir Metropolitan Municipality (İMM) for their fruitful collaboration. This research was funded by EIT Urban Mobility under the Co-Create NEB 2025 programme (2023–2025) (Project code: 9.6-0001-110-00414). The analysed data were treated according to the GDPR-General Data Protection Regulation (EU, 2016/679). During the preparation of this work, the authors used Claude AI to enhance clarity, coherence, and readability of the manuscript text. After using these tools/services, the authors manually reviewed and thoroughly edited all generated outputs and take full responsibility for the content of the research and publication.
References
Albashir, A., Messa, F., Presicce, D., Pedrazzoli, A., & Gorrini, A. (2024a). 15min City Score Toolkit – Notebook. In Transform Transport Working Papers Collection. Zenodo. https://doi.org/10.5281/zenodo.14231427
Albashir, A., Messa, F., Presicce, D., Pedrazzoli, A., & Gorrini, A. (2024b). 15min City Score Toolkit – QGIS script. In Transform Transport Working Papers Collection. Zenodo. https://doi.org/10.5281/zenodo.14231353
European Environment Agency. (2019). CORINE Land Cover 2018 (vector), Europe, 6-yearly—Version 2020_20u1, May 2020 (Version 20.01) [FGeo, Spatialite]. European Environment Agency. https://doi.org/10.2909/71C95A07-E296-44FC-B22B-415F42ACFDF0
Play the City. (2026). Mobility Game: PAC 2026. Retrieved March 3, 2026, from https://www.playthecity.eu/gamereports
Transform Transport. (2024). 15min City Score Toolkit – Urban walkability analytics. Retrieved March 3, 2026, from https://transformtransport.org/research/urban-mobility-metrics/15min-city-score-toolkit-urban-walkability-analytics/