The F.AIR (Fragile AIR – Unfair Health) project “Assessing Access to Healthy Environments from Schools to Communities” was developed by a multidisciplinary consortium led by Politecnico di Milano Department of Architecture and Urban Studies (DAStU), and including Transform Transport, Associazione Parco Segantini, and University of Milan-Bicocca Department of Environmental and Earth Sciences (DISAT), with funding from Fondazione Cariplo under the Inequalities Research program. The project, developed between March 2025-26, explores social and environmental inequalities that impact well-being and environmental health, with a particular focus on the school-age population. The research aims to contribute to a better understanding of exposure to air pollution risks in educational contexts for children, in specific neighborhoods of Milan.
Click here to explore the data through our interactive map.
Introduction
The project is motivated by evidence that equal exposure to air pollutants does not translate into equal health impacts (EEA, 2023). The effects of air pollution are particularly harmful for children and adolescents, due to their developing bodies and immune systems (EEA, 2023). In particular, asthma (over 9% of EU children), respiratory infections, and increased risks of chronic diseases in adulthood are all influenced by longterm exposure to pollution (EEA, 2023; Milligan et al., 2016; OECD, 2016). Understanding exposure patterns in school environments requires examining both the spatial distribution of pollutants and the social-environmental contexts that shape children’s daily routines. In other words, exposure and vulnerability are shaped not only by pollutant concentrations, but also by where children live, how they move, and which services and healthy spaces are accessible in their everyday routines.
This article presents the critical mapping and statistical analysis conducted by Transform Transport within the F.AIR project. Section 2 describes the data sources and analytical methodology for spatial mapping and PM2.5 time series analysis. Section 3 presents results on multi-dimensional spatial inequalities across 16 school catchments and temporal PM2.5 patterns from the sensor network. Section 4 discusses key lessons learned and implications for environmental justice in urban school environment

Enabling Data and Methodology
Spatial analysis focused on Municipi 5 and 6 in Milan, examining 16 school complexes, selected by Polimi-DAStU. For each school, a 15-minute walking isochrone was calculated based on the actual street network and an average walking speed of 4.5 km/h, representing the catchment area accessible by foot. Spatial analysis was conducted to understand how urban environmental conditions and socio-demographic factors interact to create differentiated exposure patterns around schools.
The analytical workflow integrated multiple spatial datasets through systematic processing: i) collection and standardization of spatial data to ensure comparability; ii) verification of data completeness and consistency to enable joint interpretation of indicators; iii) identification of spatial patterns in Municipi 5-6 and around the 16 schools; iv) calculation of summary statistics for each layer and analysis area to quantify indicator presence and intensity; v) multi-indicator profile comparison across locations through visual outputs including tables and radar charts. Seven indicators were developed using an H3 hexagonal grid with resolution 10 (i.e., 0.015 km² per cell), shown in Table 1.
| Indicator | Unit | Source | Year |
| Population under 15 years | Number of residents | ISTAT | 2021 |
| Average income | €/year | Ministry of Economy and Finance | 2023 |
| Vegetation coverage | NDVI index | Sentinel-2 | 2024 |
| Public Transport Accessibility Level (PTAL) | Scale 0-6 | AMAT | 2025 |
| Sidewalk width | Meters (weighted average) | Transform Transport | 2020 |
| NO₂ concentration | µg/m³ | Boniardi et al., 2025 | 2023 |
| Traffic flows | Vehicles/hour | Systematica | 2019 |
Statistical analysis used data from the Associazione Parco Segantini low-cost sensor network: 16 sensors activated between 2020-2024, measuring PM2.5, temperature, humidity, and pressure at hourly resolution. Phase 2 activities included:
- Cleaning & normalization: PM2.5 time series were standardized and cleaned by removing outliers using rolling Z-score on a daily window. Anomalous hours were excluded and gaps kept as NaN; PM2.5 was not interpolated.
- Continuity & robustness checks: Data availability and gap structure were assessed to quantify sensor robustness and flag unreliable periods, guiding when reconstruction and analysis were appropriate.
- PM2.5 prediction for complete series: A LightGBM algorithm was developed to predict PM2.5, producing continuous hourly series for analysis. The predictive dataset included lags, rolling features, cyclical time variables, continuity flags, and sensor similarity features.
- Aggregated temporal pattern mapping: With consistent series, PM2.5 was aggregated at annual, monthly, and daily scales to highlight recurring dynamics (i.e., seasonality, diurnal cycles) and compare patterns across locations.
- Critical periods & potential exceedances: Critical episodes were identified by comparing aggregated concentrations with WHO (5 µg/m³) and EU (25 µg/m³) thresholds, highlighting when and where higher-risk conditions tend to occur.
Results
Spatial Inequalities Across School Catchments (Phase 1)
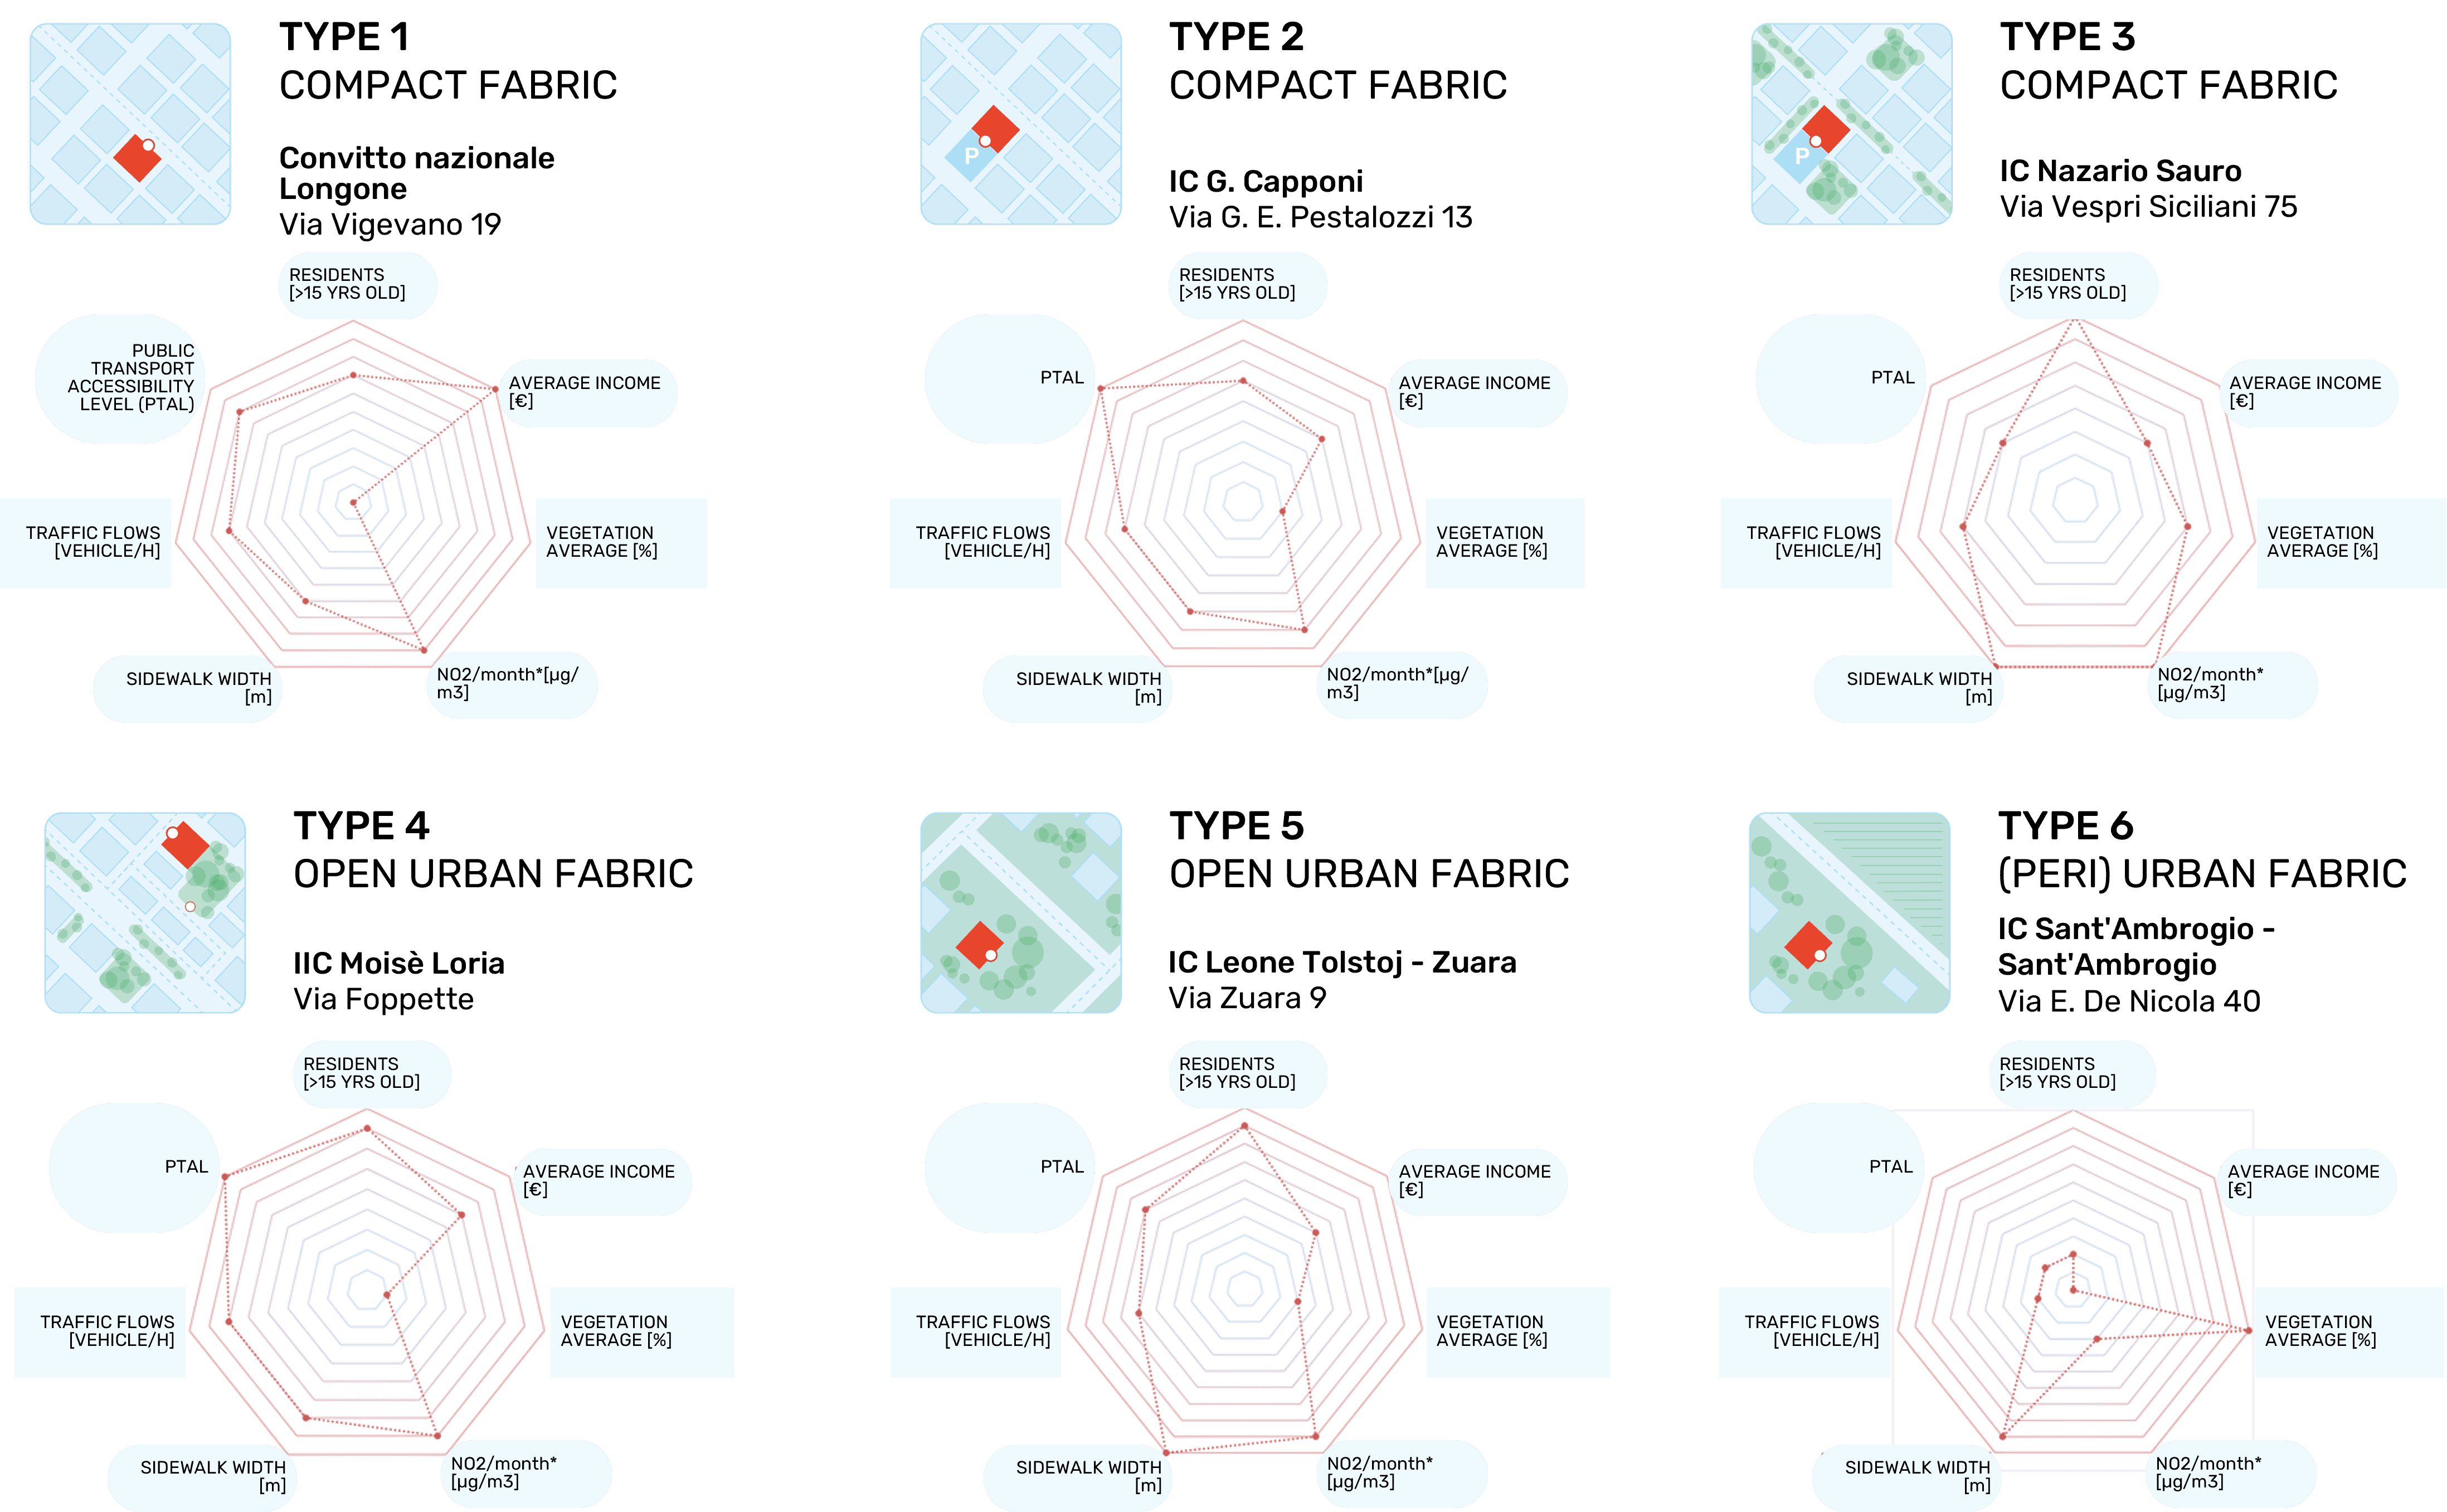
The multi-indicator mapping revealed significant spatial variation across Municipi 5 and 6, with school catchments displaying different environmental and socio-demographic conditions (see Figure 2). The Polimi-DAStU team selected 16 case-studies for analyses and then grouped them into six urban typologies based on their built environment profiles: three compact urban fabric types (i.e., types 1-3) and three open or peri-urban fabric types (i.e., types 4-6), reflecting different combinations of building density, proximity to traffic axes, and availability of green spaces.


Figure 2 Mapping Municipi 5 and 6
Radar charts were developed for each school to visualize the seven-indicator profiles simultaneously (see Figure 3). This comparative approach revealed that inequalities are multidimensional: schools located in compact urban fabric with high traffic flows and limited vegetation face a very different exposure context from schools at the peri-urban fringe with lower NO₂ but reduced public transport accessibility. Combining access indicators (e.g., PTAL, sidewalk width) with environmental quality indicators (e.g., NO₂, vegetation, traffic) is what makes these priority differences visible, single variables alone could not capture the inequality pattern.
PM2.5 Temporal Patterns Across the Sensor Network (Phase 2)
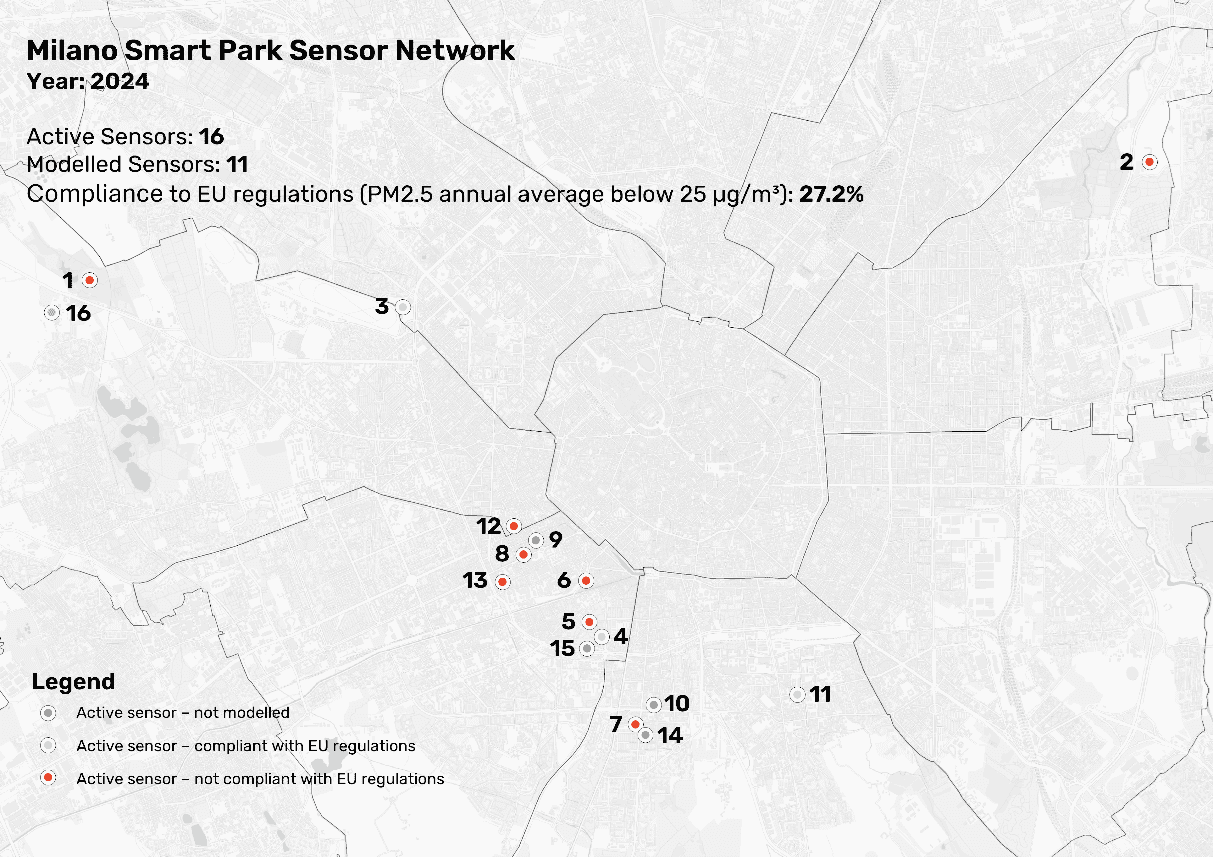
Raw data from the 16 sensors from Associazione Parco Segantini was used to perform the analysis and modelling. Results show that the 16 sensors, active between 2020 and 2024, captured consistent PM2.5 patterns across the network. Annual means showed a general downward trend between 2020 and 2023, followed by a partial increase in 2024 in several sensors. All sensors systematically exceeded the WHO guideline (5 µg/m³). Compliance with the EU limit (25 µg/m³) varied by year and location (see Figure 4).
Seasonal patterns were consistent across stations. Concentrations were markedly higher in autumn and winter (November–March), driven by heating emissions and meteorological conditions unfavorable to pollutant dispersion, while spring and summer showed lower and more stable values. Daily profiles showed higher variability in morning hours, with exceedances concentrated in early morning and late evening time slots. These recurring dynamics were coherent across sensors, suggesting area-wide atmospheric dynamics and robustness in the sensors’ ability to capture emissions. However, data analysis confirmed that continuity is not automatic, as gap structures varied significantly across sensors and years. This underscores the importance of systematic robustness documentation alongside the data itself.
All elaborations and results are publicly available through an interactive WebGIS platform developed within the project.
Conclusions and Future Works
F.AIR aimed at understanding environmental inequalities affecting children’s well-being in Milan school environments. Within the project, Transform Transport’s critical mapping and statistical analysis demonstrate how granular data can inform evidence-based policy for environmental justice, through two lessons learned.
First, spatial inequalities require multi-dimensional assessment. Combining access and environmental quality indicators revealed distinct school profiles invisible through single-variable analysis, essential for targeting interventions effectively.
Second, low-cost sensor networks generate reliable evidence with rigorous data governance. The PM2.5 analysis captured consistent temporal patterns, demonstrating distributed monitoring viability. However, systematic robustness documentation and standardized protocols are essential to translate measurements into trustworthy policy datasets.
This analytical work was integrated with educational activities, place-based engagement in 16 case studies, and a November 2025 co-creation workshop, demonstrating that knowledge co-production builds both awareness and agency for sustained participation in environmental health decisions.
The results of the project will be included in a policy guidelines document proposing differentiated interventions for the six identified school typologies. Measures will include consolidating sensor networks, promoting home-to-school monitoring, establishing territorial observatories, and activating recurring stakeholder engagement.
Acknowledgments
We thank Politecnico di Milano Department of Architecture and Urban Studies (DAStU), Associazione Parco Segantini, and University of Milan-Bicocca Department of Environmental and Earth Sciences (DISAT) for their fruitful collaboration. This research was funded by Fondazione Cariplo under the Inequalities Research programme (Grant No. 2024-0671). The analysed data were treated according to the GDPR-General Data Protection Regulation (EU, 2016/679). During the preparation of this work, the authors used Claude AI to enhance clarity, coherence, and readability of the manuscript text. After using these tools/services, the authors manually reviewed and thoroughly edited all generated outputs and take full responsibility for the content of the research and publication.
References
Baraldi, R., Chieco, C., Neri, L., Facini, O., Rapparini, F., Morrone, L., Rotondi, A., Carriero, G., (2019). An integrated study on air mitigation potential of urban vegetation: From a multi-trait approach to modeling. Urban Forestry & Urban Greening, 41, 127-138. https://doi.org/10.1016/j.ufug.2019.03.020
Boniardi, L., Nobile, F., Stafoggia, M., Michelozzi, P., & Ancona, C. (2025). Assessing the impact of traffic restriction interventions on school air quality: A citizen science-based modelling study. Environmental Research, 277, 121562. https://doi.org/10.1016/j.envres.2025.121562
European Environment Agency (2019). Air Pollutant Emission Inventory Guidebook. Technical guidance to prepare national emission inventories. Available at: https://www.eea.europa.eu/publications/emep-eea-guidebook-2019
European Environment Agency. (2023). European city air quality viewer. https://www.eea.europa.eu/themes/air/urban-air-quality/european-city-air-quality-viewer
Milligan, K. L., Matsui, E., & Sharma, H. (2016). Asthma in urban children: Epidemiology, environmental risk factors, and the public health domain. Current Allergy and Asthma Reports, 16, 1–10. https://doi.org/10.1007/s11882-016-0609-6
Nieuwenhuijsen, M.J. (2016). Urban and transport planning, environmental exposures and health-new concepts, methods and tools to improve health in cities. Environmental Health, 15, S38. https://doi.org/10.1186/s12940-016-0108-1
Organisation for Economic Co-operation and Development. (2016). The economic consequences of outdoor air pollution. OECD Publishing. https://doi.org/10.1787/9789264257474-en
Zupancic, T., Westmacott, C., & Bulthuis, M. (2015). The impact of green space on heat and air pollution in urban communities: A meta-narrative systematic review (Vol. 61). Vancouver: David Suzuki Foundation. Available at: https://davidsuzuki.org/wp-content/uploads/2017/09/impact-green-space-heat-air-pollution-urban-communities.pdf