
This research is the first part of a study focusing on New York City’s urban forest infrastructure. In particular, this study examines the city’s street trees and parkland inventory as compiled by the New York City Department of Parks and Recreation, while the second part will focus on a land use regression model aimed at quantifying the relation between pollutants emission and absorption features.
This research offers five contributions: (i) understanding the characteristics of the urban forest and its tree species, (ii) analyzing and mapping tree density across all the five boroughs, (iii) quantifying the pollutant removal capabilities of all urban trees, (iv) identifying potential zones where pollution removal efforts could be piloted through better street tree planting and management, and (v) outlining broad tree management strategies for improving air quality. By comparing the results of the two inventories, the research simultaneously measures the impact that additional trees can have on pollution removal in the city. The resulting spatial maps on pollution removal can inform actionable policies for creating a greener, more sustainable city, while also laying the groundwork for cross-sectional research in mobility, transportation, and public health. A comprehensive understanding of the city’s urban tree cover has the potential to drive positive change in the above domains, ultimately improving the health and well-being of city residents.
Introduction
Urban trees are a critical component of a city’s green infrastructure, providing many social, economic and environmental benefits (Lai & Kontokosta, 2019): reducing greenhouse gas emissions, assisting with water run-off, sequestering carbon, and overall improving public health, thereby improving the quality of life for residents. Given the numerous external stressors facing cities today, urban areas are increasingly adopting nature-based solutions and advocating for a healthier urban forest as a means of building resilience for the future.
The performance of different trees in providing these benefits is directly related to the species, their size and condition (Gorrini et al., 2022). Analysis of a city’s tree inventory can contribute to an holistic interpretation of the spatial distribution of these benefits, and inform planning, management and funding decisions related to tree planting and maintenance.
The Green Infrastructure of New York City
As of 2017, NYC’s urban forest covers over 22% of land area with more than 7 million trees. Forested natural areas account for 6.07% of the land area and 37.61% of all canopy citywide. According to the latest street tree census of 2015, the city has 650,000+ living trees. While every decennial census has seen an increase in the number of trees, there is also an opportunity to add approximately 250,000 additional trees into the system. The landscaped portions of City Parkland were recently inventoried, which documented another 150,000+ living trees (Treglia et al., 2021).
However, despite the high canopy cover, the city’s trees lack equitable distribution. Several studies in the domain of public health suggest that there exist complex associations between trees, air pollution removal, heat vulnerabilities, and health outcomes in the city. Moreover, urban forests mitigate the impacts of climate change by storing carbon, reducing stormwater runoff, and protecting physical infrastructure in flood-prone areas, and are considered a key actor in many NYC planning processes (NYC, 2007) (NYC, 2011).
Currently, disadvantaged communities in the city are disproportionately affected when trees fail to serve them equitably in these aspects, as areas with large parks and lower density of development have higher percentages of canopy cover, while heavily developed areas with a higher proportion of people of color and lower-income populations have the lowest canopy cover (Treglia et al., 2021). This inequitable distribution of benefits results in a lower quality of life for disadvantaged communities.
This inequitable distribution of benefits results in a lower life quality and places a higher emphasis on understanding the characteristics of the urban forest in the city, the spatial distribution of trees and, ultimately, the benefits they provide.
Relevant Local Policies
In this framework, New York City has made efforts in the recent decade to maintain, expand, protect and fund the urban forest through strategic initiatives and policy guidelines that instruct the planning, management and stewardship of trees. The following initiatives are some that the city has adopted as it tries to achieve this goal:
- MillionTreesNYC: One of 132 PlaNYC initiatives, this citywide, public-private partnership program aims to plant one million trees by 2030. An iteration of the program was completed in 2015 with 70% of a million trees planted in parks and public spaces, and 30% in private and community spaces (MillionTrees NYC, n.d.).
- The State of the Urban Forest in NYC: this report characterizes the state of the city’s green cover across the five boroughs and provides a foundation for long term planning, management and investments towards effective decision-making (Treglia et al., 2021).
- NYC Urban Forest Agenda: the agenda is a roadmap to protect, maintain, expand, and promote the New York City urban forest. Their coalition, ‘Forest for All’ also calls for a citywide goal of 30% tree coverage by 2035 (The Nature Conservancy, 2021).
- New York City Policy Agenda 2022: the agenda is a targeted advocacy effort that aims to transform New York’s most pressing priorities into practical and effective strategies. One of the key strategies outlined in the agenda is investing in parks and natural areas, promoting clean air through nature-based solutions, thereby also reducing heat vulnerability (NYLCV, 2022).
Enabling Data and Methodology
The research was made possible by the availability of two major sources of data: (i) NYC’s 2015 Street Tree Count, which contains the decennial street tree count of New York City, and (ii) NYC’s Park tree dataset, which a count of all the trees growing in parkland landscapes, around playgrounds, lawns, picnic areas, park buildings, recreation fields, pathways, and all other ‘designed’ parkland areas. The former dataset is mapped by the New York City Department of Parks and Recreation, and it represents the largest participatory urban forestry project to date (NYC, n.d.) as the crowdsourced data includes details on tree species, diameter, perceived health and location. The latters, is built on an inventory made in 2016-2018, and includes surveyed trees growing in parkland areas except those in forests and parkland areas extending into coastal waters (Bhandaram, 2022). In this case, the data primarily includes details on tree species, diameter, and location.
Both inventories are filtered for living trees, and trees with ‘diameter at breast height’ values greater than zero inches. In order to allow the processing of the data, the scientific and common names in the inventories have been manually and automatically corrected to match that of i-Tree software. Trees with only information on the genus have been assigned to a species that is native to or commonly found in New York or North-East United States. Additionally, the pollution removal values of the trees derived from the i-Tree model are calculated at tree level and later aggregated to Uber’s Hexagonal Hierarchical Spatial Index (2018) at resolution level 9.
i-Tree Eco Model
i-Tree Eco is a forestry analysis and benefits assessment tool developed by the USDA Forest Service. It is an advanced software capable of analyzing tree inventory data to extract associated environmental and economic benefits (i-Tree, n.d.). By assessing the tree size and species, the model estimates several indicators, such as the pollution removal capacity, carbon storage potential and oxygen production capacity of the trees, etc. To accurately estimate results, the software incorporates standardized field data, local hourly air pollution, and meteorological data as input parameters (Nowak & Crane, 2000).
The model uses measurements of crown dimensions and the percentage of missing crown canopy to assess the leaf area of the trees (Nowak et al., 2006). However, in this specific case, these variables were not collected during the street tree and parkland census, and the software allow to estimate them to calculate pollution removal values for substances such as ozone, sulfur dioxide, nitrogen dioxide, carbon monoxide, particulate matter less than 2.5 microns, and particulate matter between 2.5 and 10 microns. Furthermore, the i-Tree software derives the different pollutants removal estimates using pre-existing models, leaf area index calculations, weather and pollution processing and interpolation, and pollutant monetary values. Moreover, the model uses a damage-function approach based on the local change in pollution concentration and population. The default air pollution removal monetary value is then calculated based on local incidence of adverse health effects and national median externality costs using data from the U.S. Environmental Protection Agency’s Environmental Benefits Mapping and Analysis Program (BenMAP) (Nowak et al., 2014). The model calculates the carbon sequestration of the inventory based on the tree growth model and biomass equation.
Processing the inventory of NYC street and park trees through the i-Tree software allowed us to better understand the characteristics of the city’s green cover and to map the total pollution removed in the city, as well as the removal values attributed to individual pollutants and tree species. The analysis gives us an insight into the carbon sequestration potential and water runoff benefits of NYC’s urban forest. Additionally, the comparison of the two inventories allows for the quantification of the impact that additional trees can have on the city.
Results
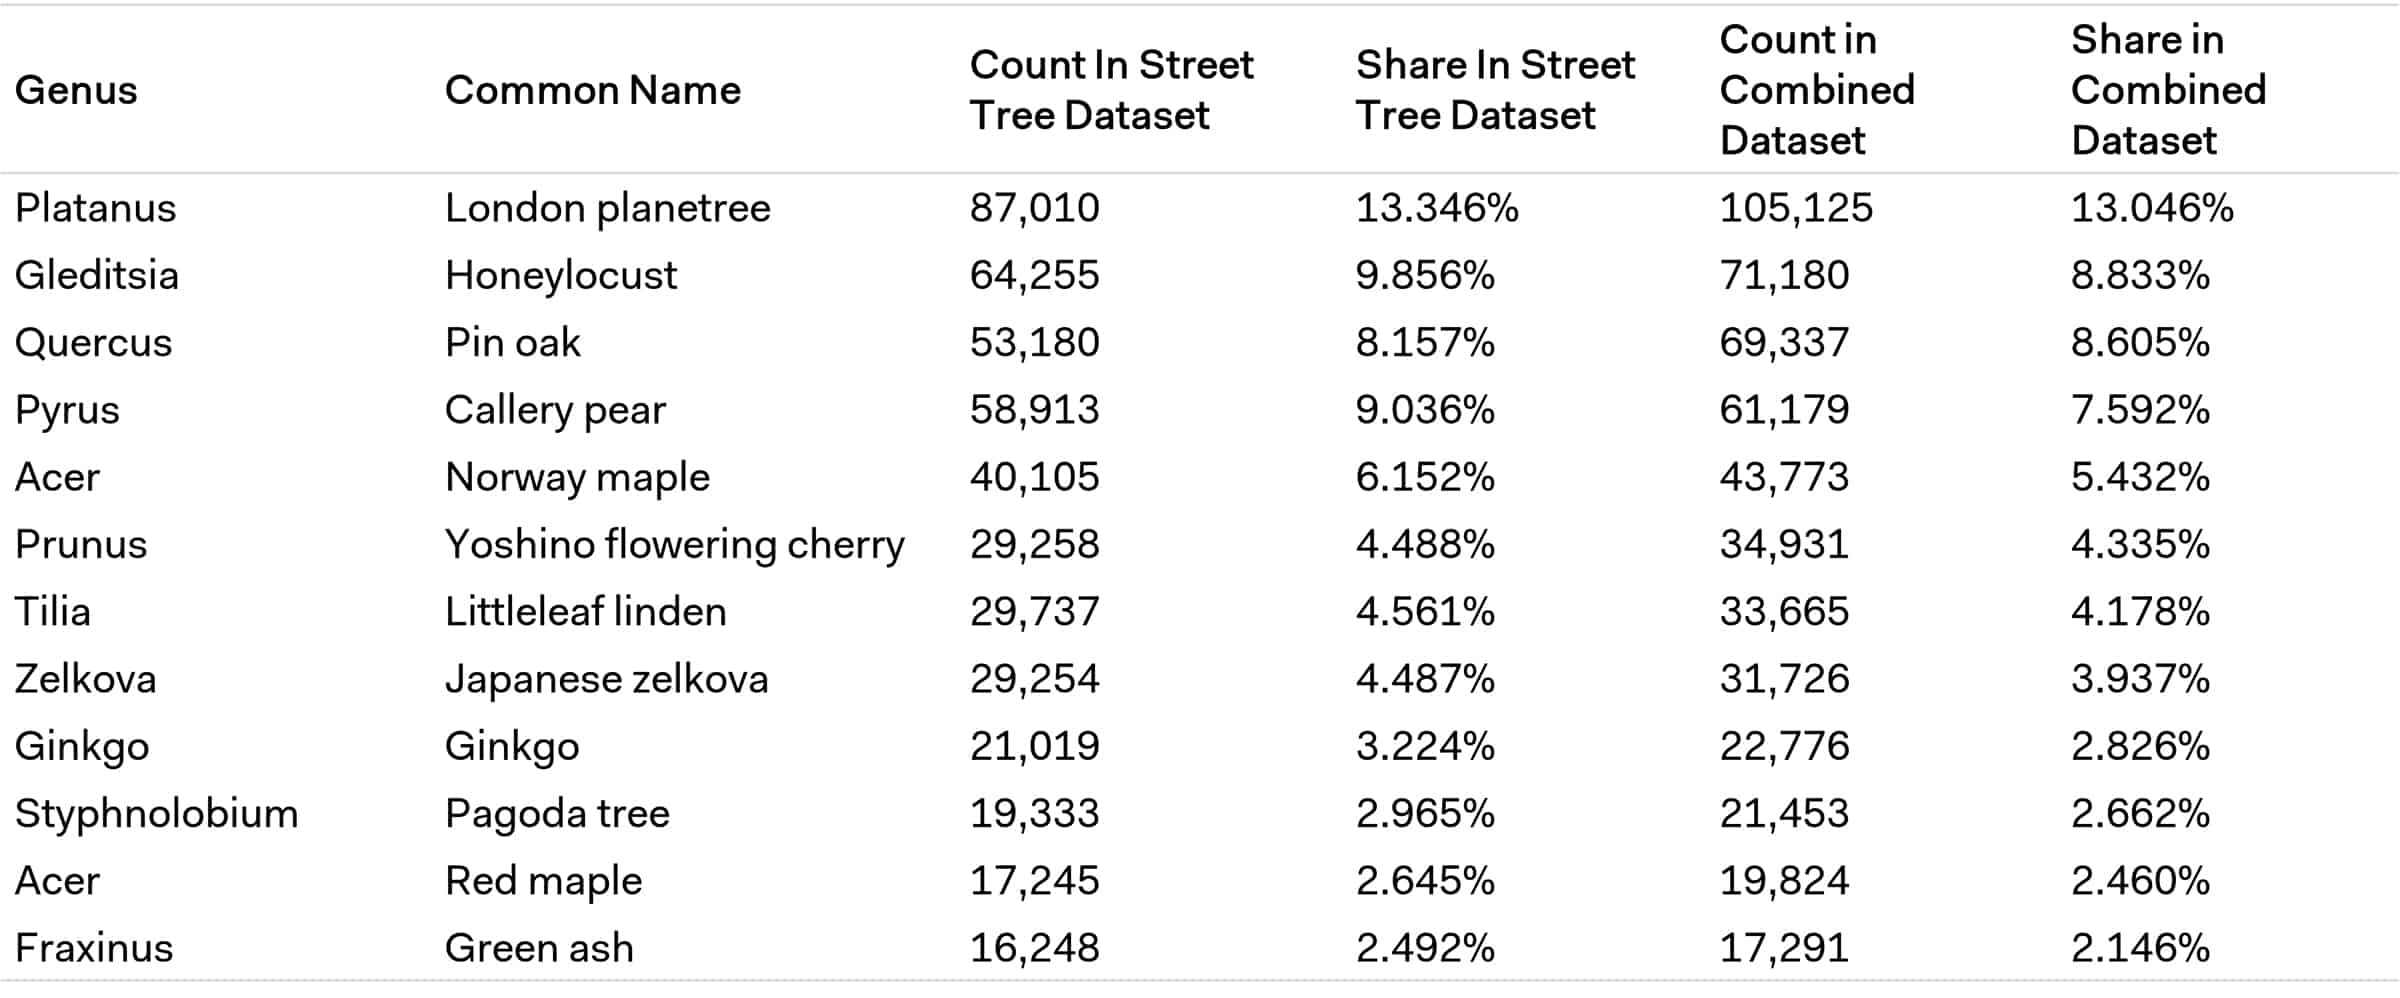
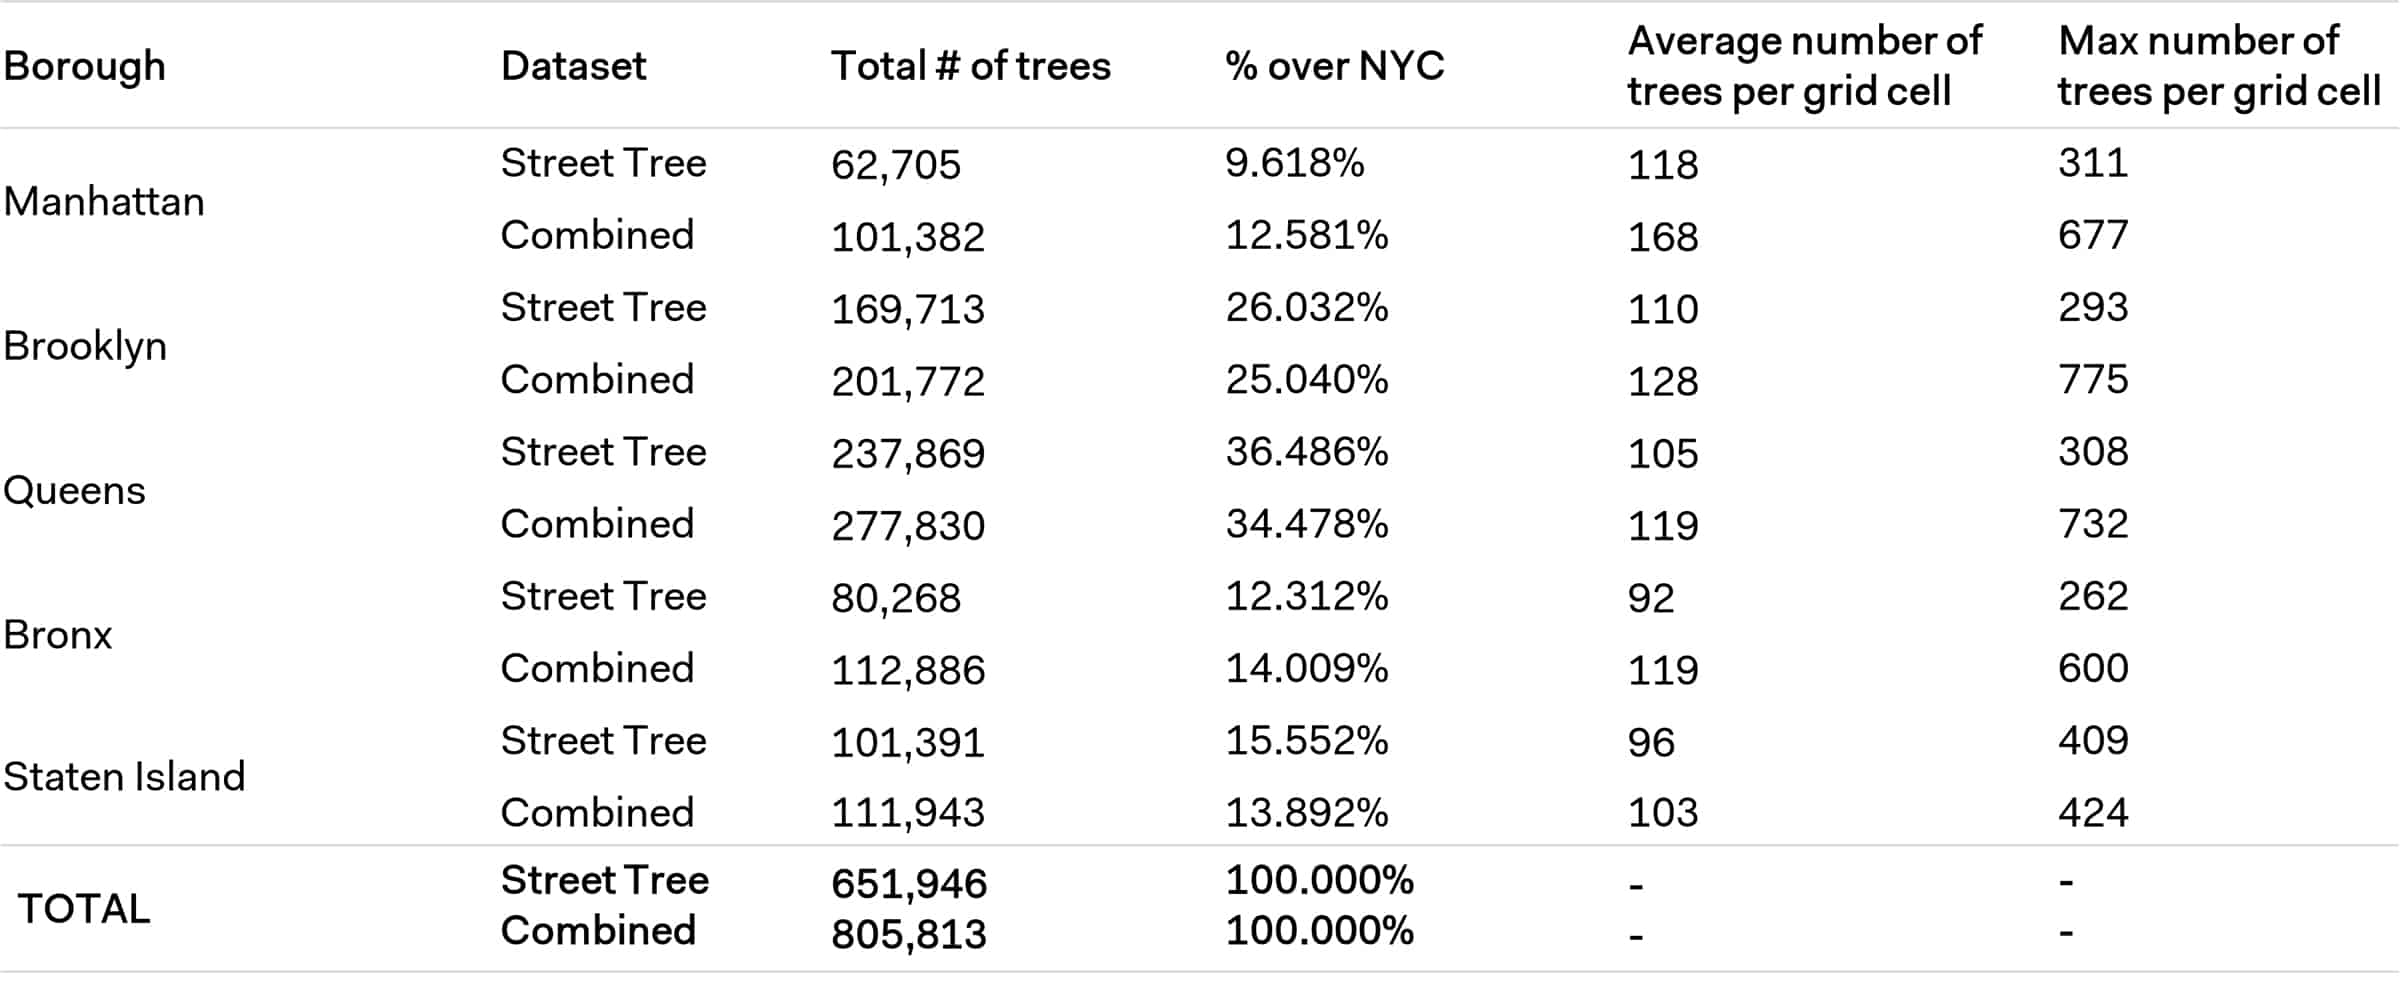
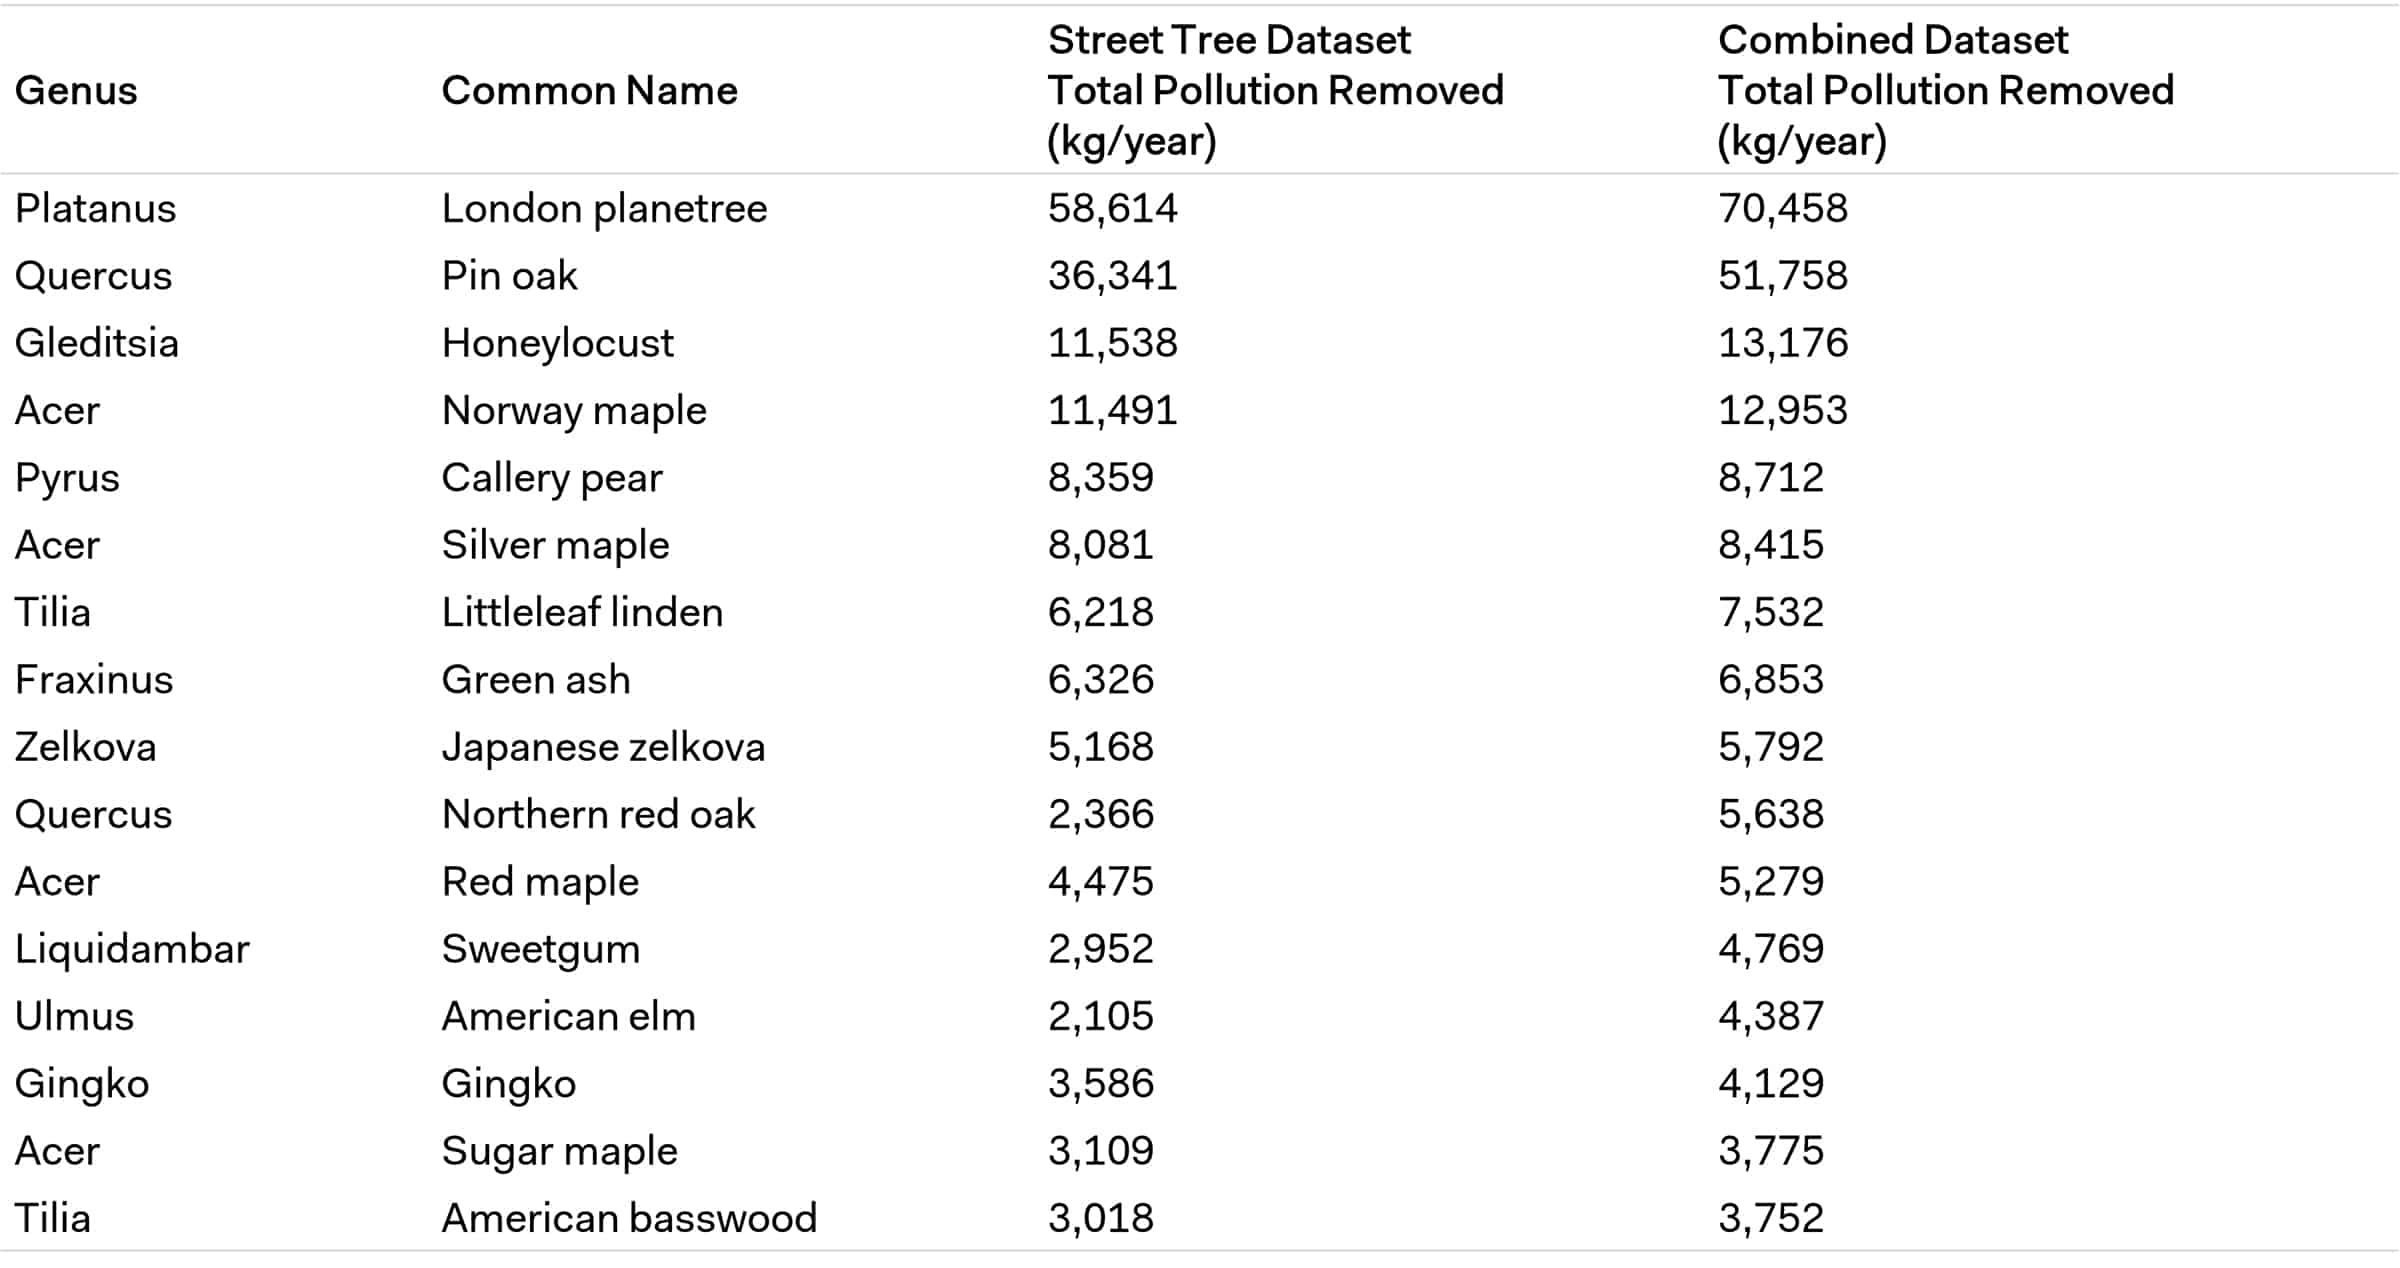
The analysis was run for 651,946 trees in the street tree dataset, and 805,813 trees in the combined dataset, after curation. The three most common species in the former dataset are London planetree (13.3%), Honeylocust (9.9%), and Callery Pear (9.0%). The addition of 153,867 park trees changes the share of the London planetree to 13.0%, Honeylocust to 8.8%, and Pin Oak to 8.6% (see Table 1).
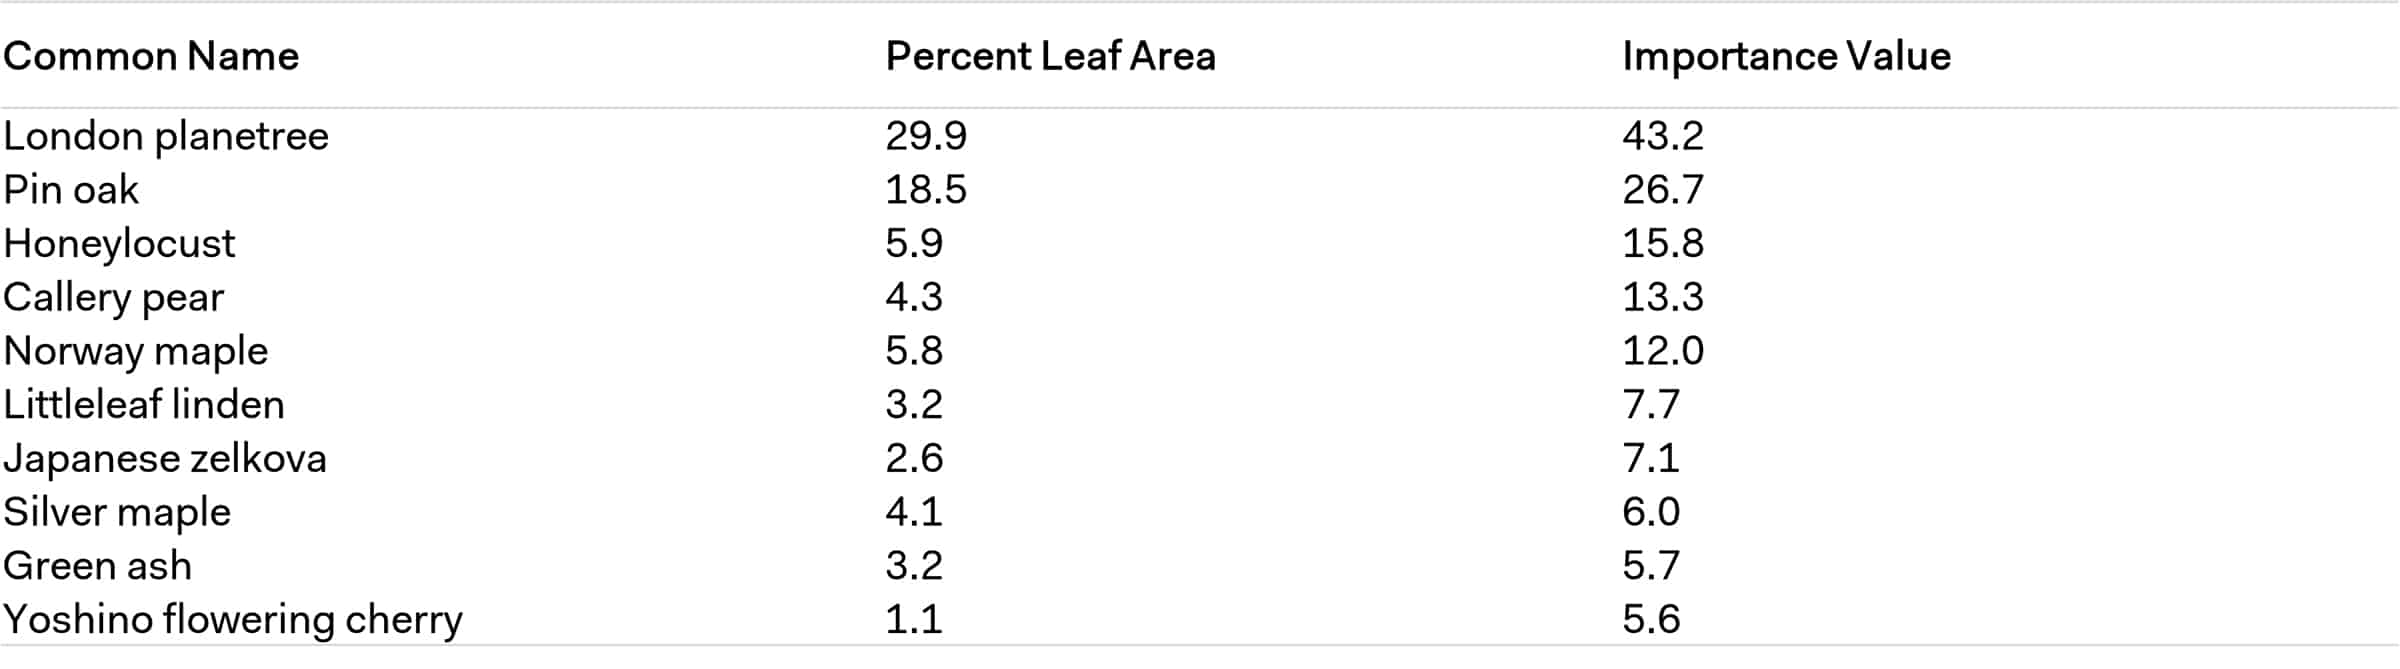
Many tree benefits directly equate to the amount of healthy leaf surface area of the plant. In terms of tree health, the curated street tree dataset contains 528,671 trees classified as ‘Good’ trees, 96,473 as ‘Fair’, and 26,801 as ‘Poor’. Regardless, the tree cover for the street tree inventory is calculated to be about 12.22 square miles, with 74.24 square miles of leaf area. The Parks inventory does not record the health of the tree. However, the model estimates the tree cover for the combined inventory to be about 16.19 square miles, with 97.74 square miles of leaf area. Across both datasets, the most dominant species in terms of leaf areas are London planetree, Pin oak, and Honeylocust. The 10 species with the greatest importance values are listed in Table 2. Importance value measures the dominance of a species in a given tree population and is calculated as the sum of percent population and percent leaf area.
Urban Forest Density
The tree density is calculated as the number of trees in a given hexagon. The addition of just 153,867 trees brings about a drastic increase in density spatially, especially in Manhattan, Brooklyn and Bronx (see Figure 1). While parts of Manhattan and Brooklyn are more tree-dense, Queens has the highest street tree count, followed by Brooklyn, Staten Island, Bronx and Manhattan. Park trees are highest in Queens and Manhattan (see Table 3). It is important to note that Manhattan has the highest population density.
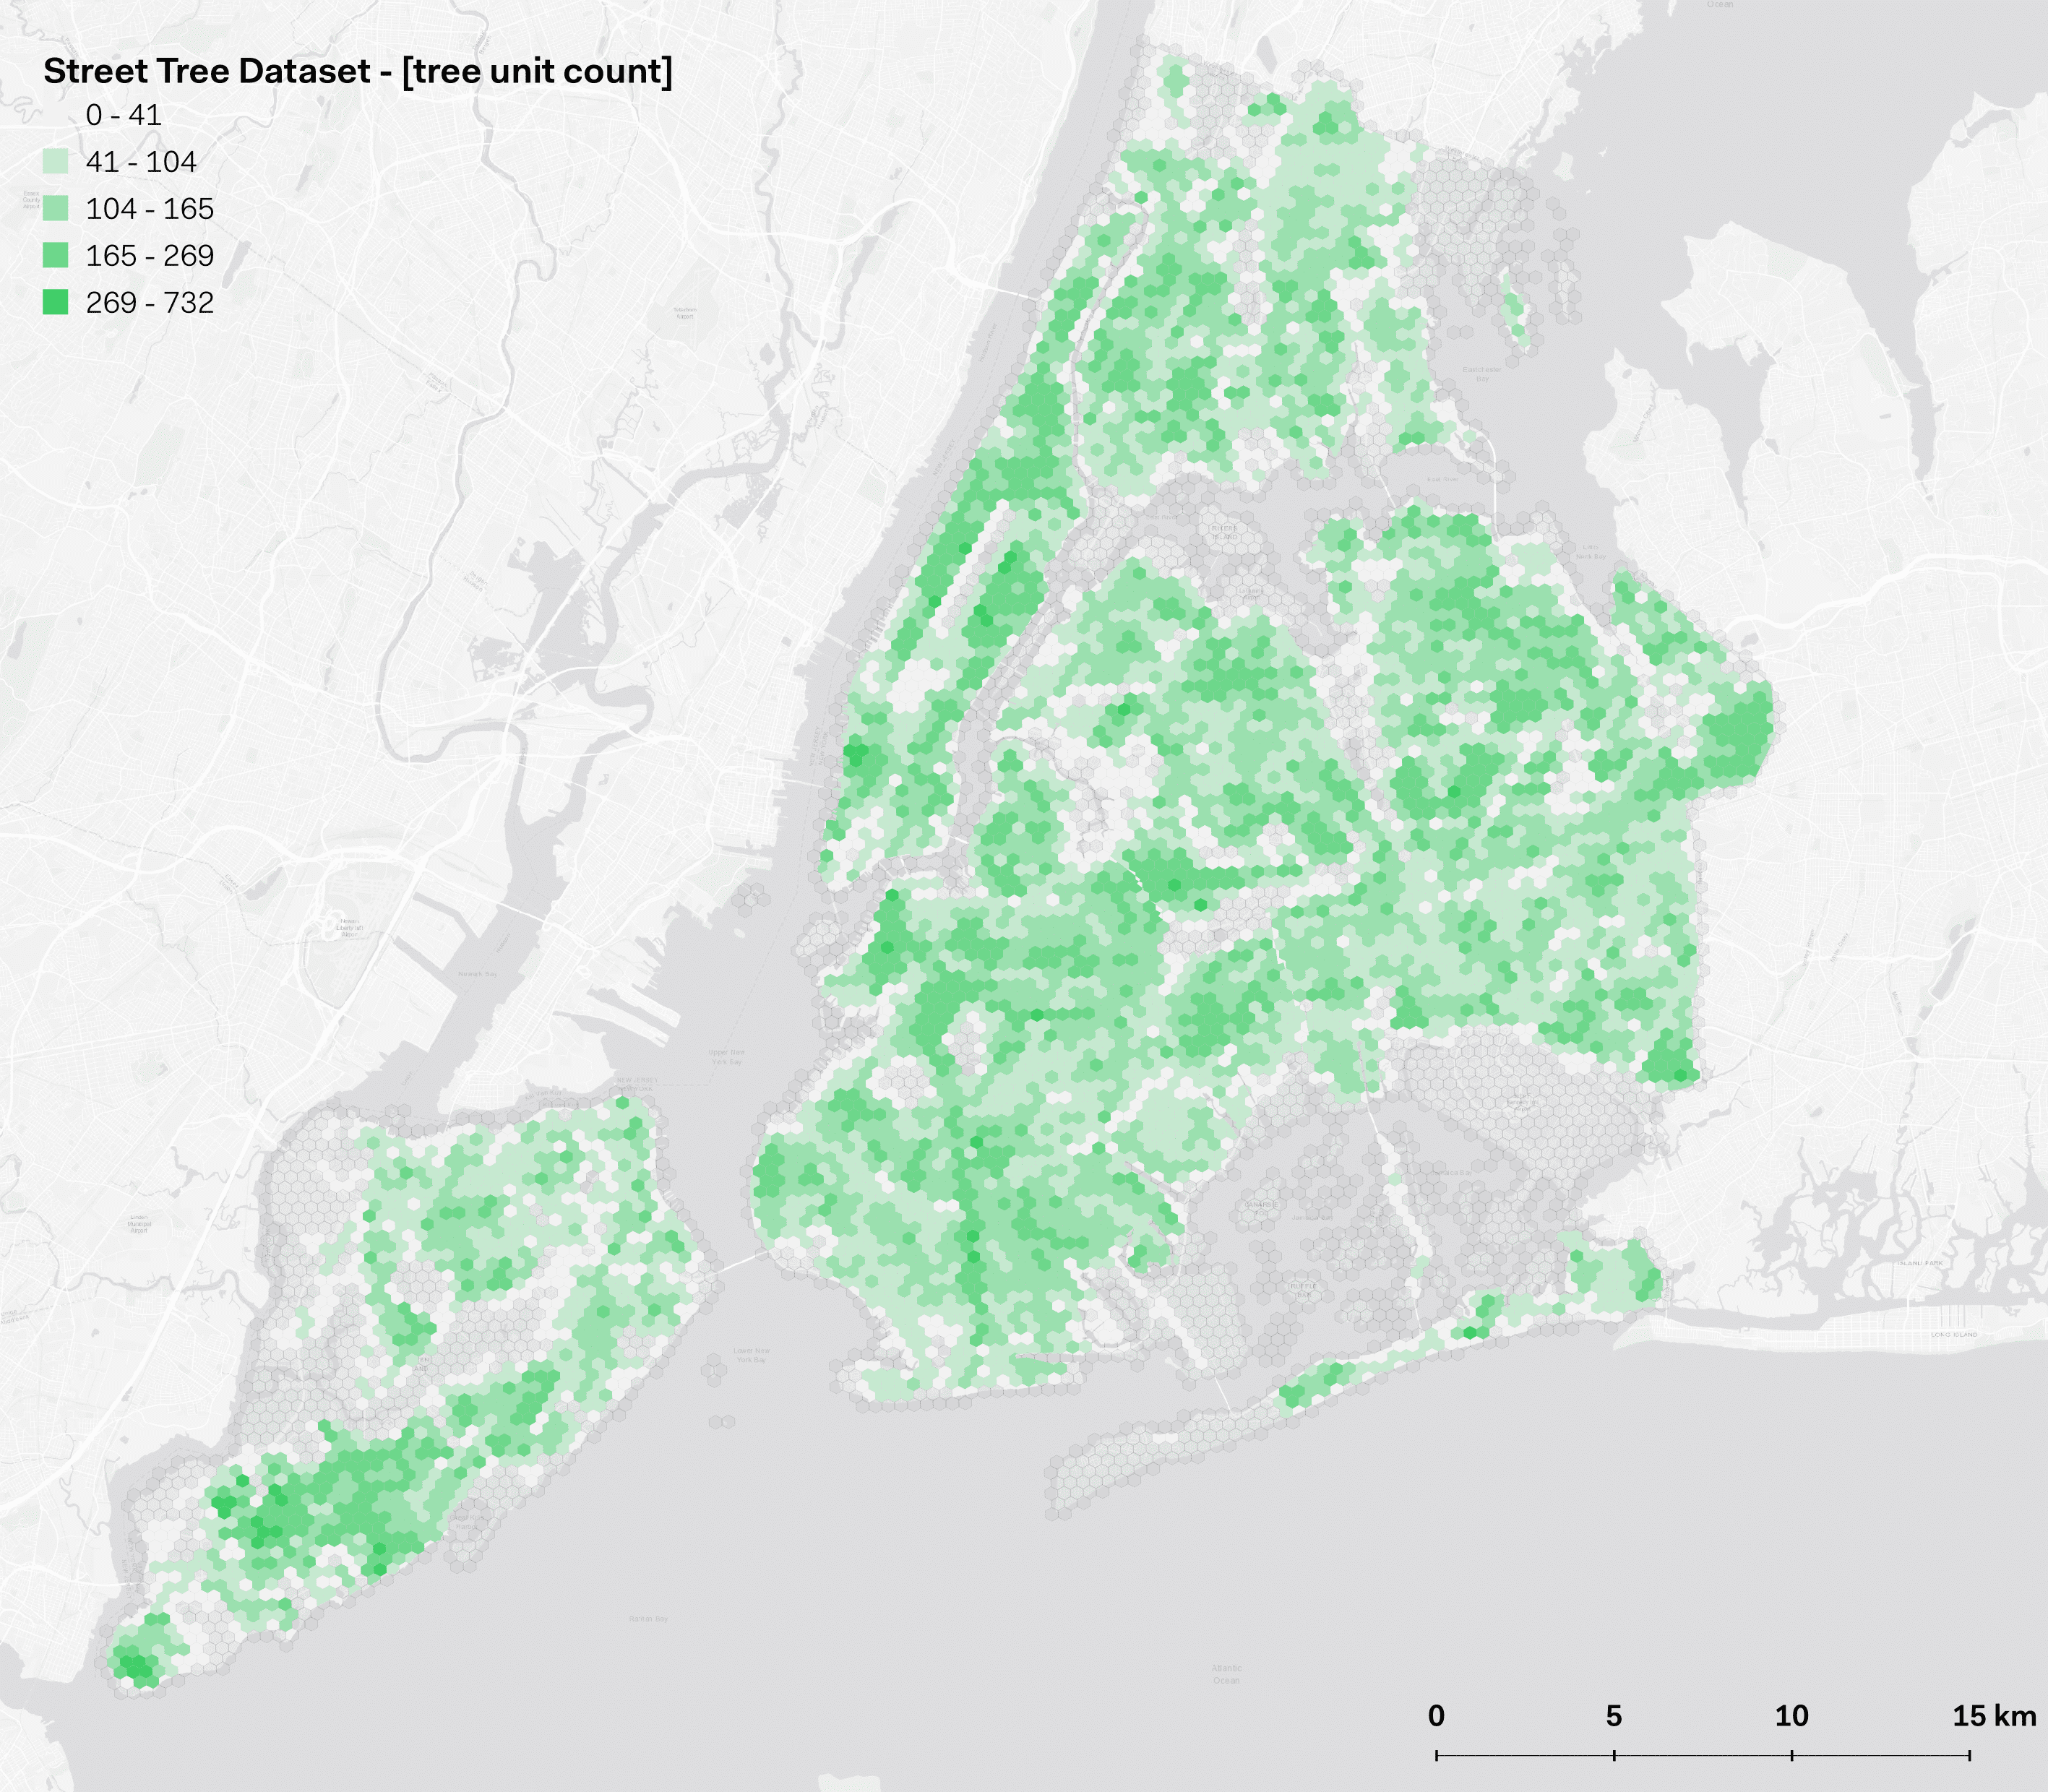
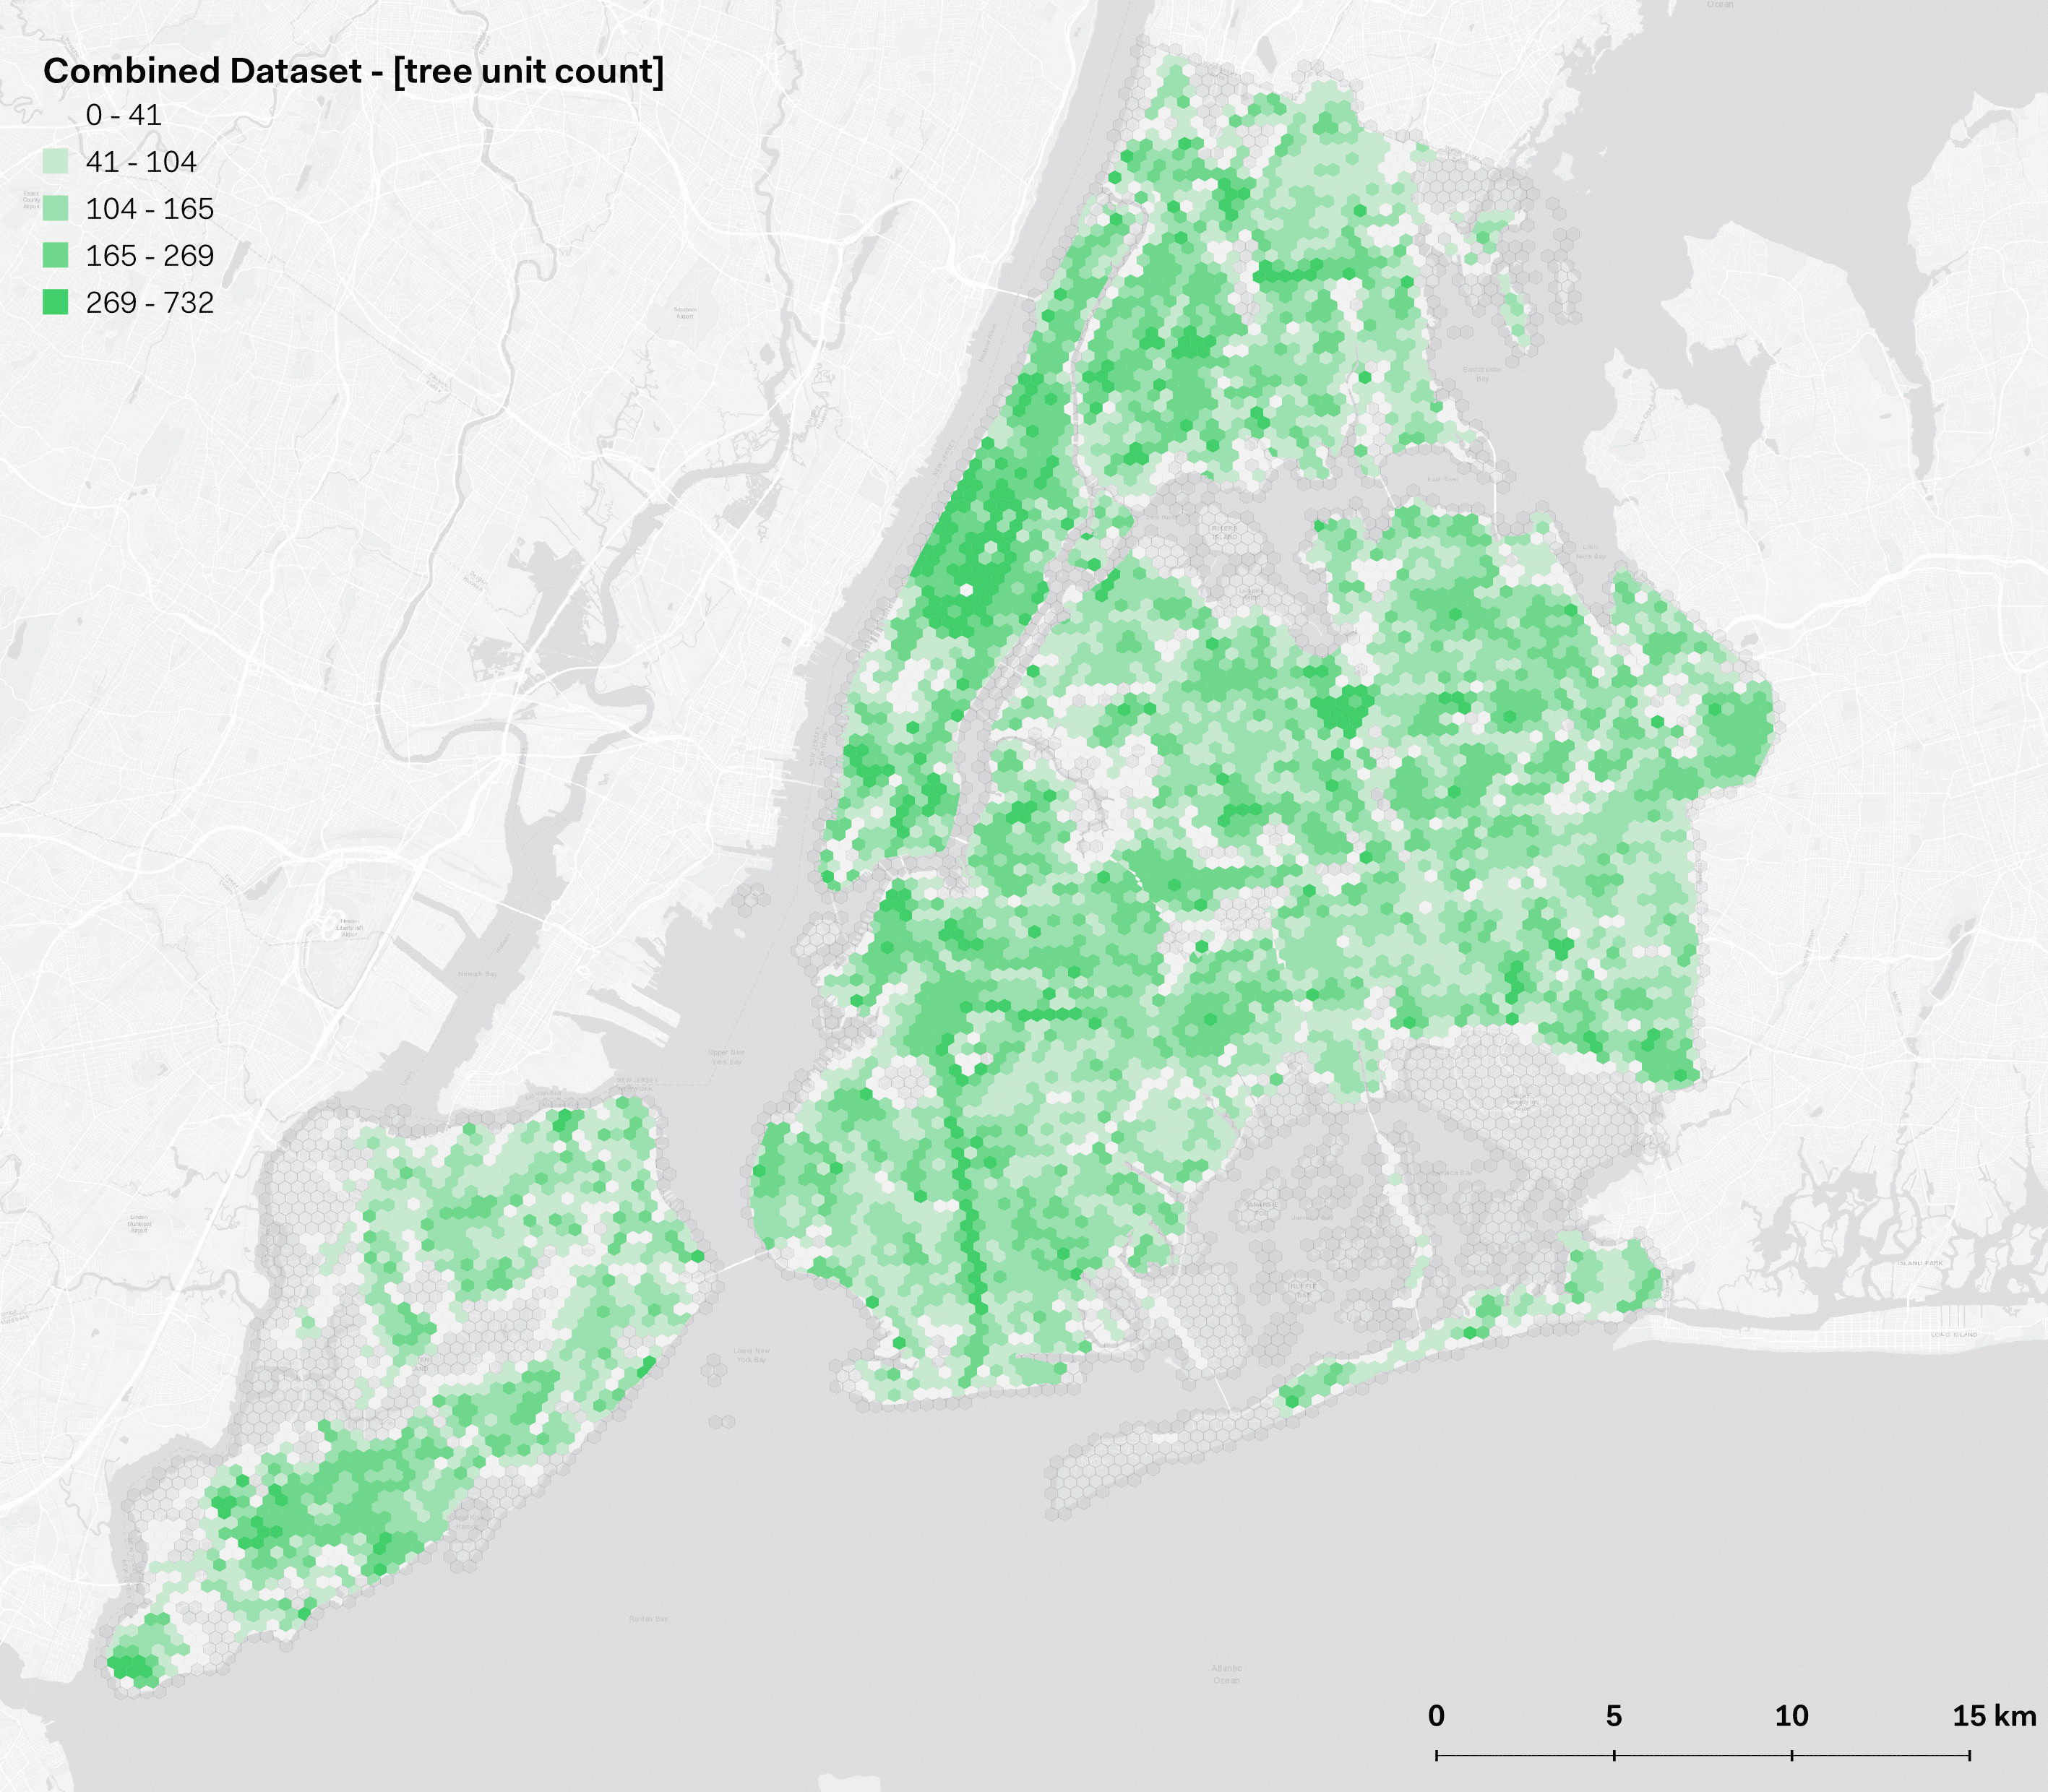
Figure 1: Comparison between Street Tree Dataset and Combined Dataset tree count per hexagon cell
Air Pollution Removal by Urban Trees
Overall, NYC street trees remove 216.5 tons of air pollution across all categories per year with an associated value of 41.6 million dollars. The combined dataset shows that street and park trees together remove 284.5 tons of air pollution per year across all considered substances, with an associated value of 55 million dollars. The inclusion of 23.6% more trees increases pollution removal value by over 31.4%, with certain areas in the city removing almost twice as much as before, as shown in Figure 2. While each tree species contributes differently to pollutant removal (see Table 4), the calculation involves multiple variables, as outlined in the ‘Model’ section of the article.
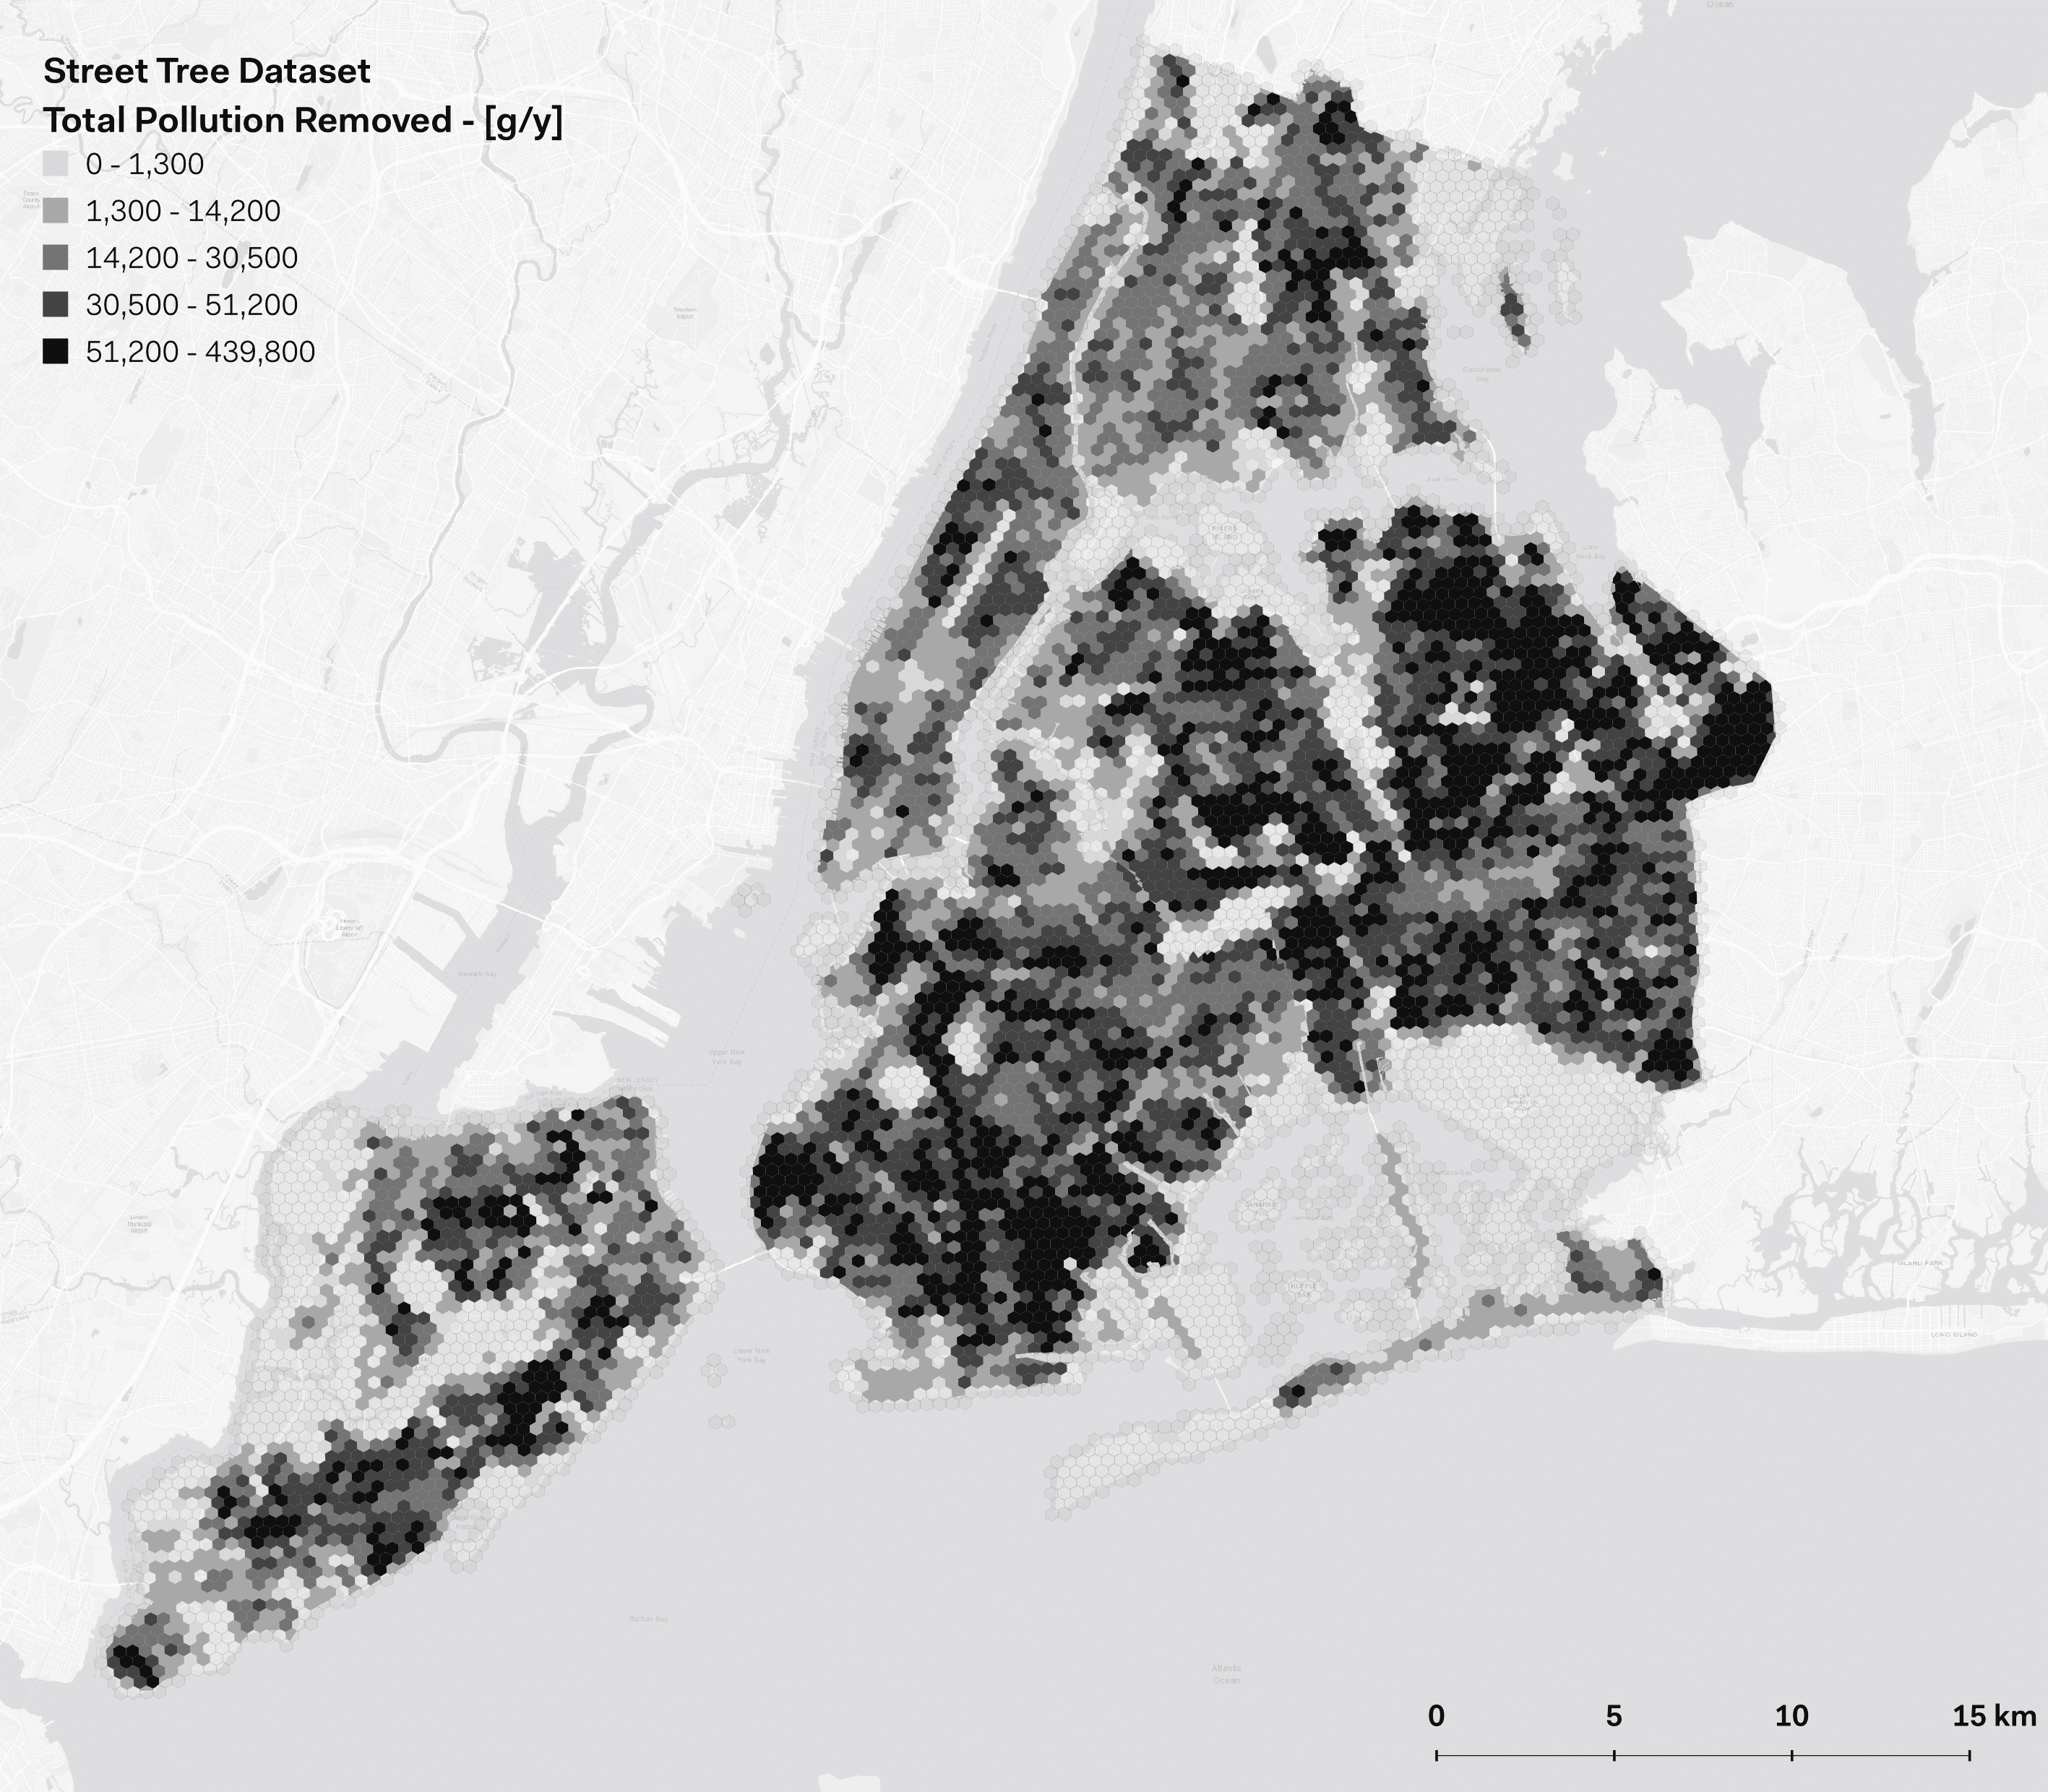
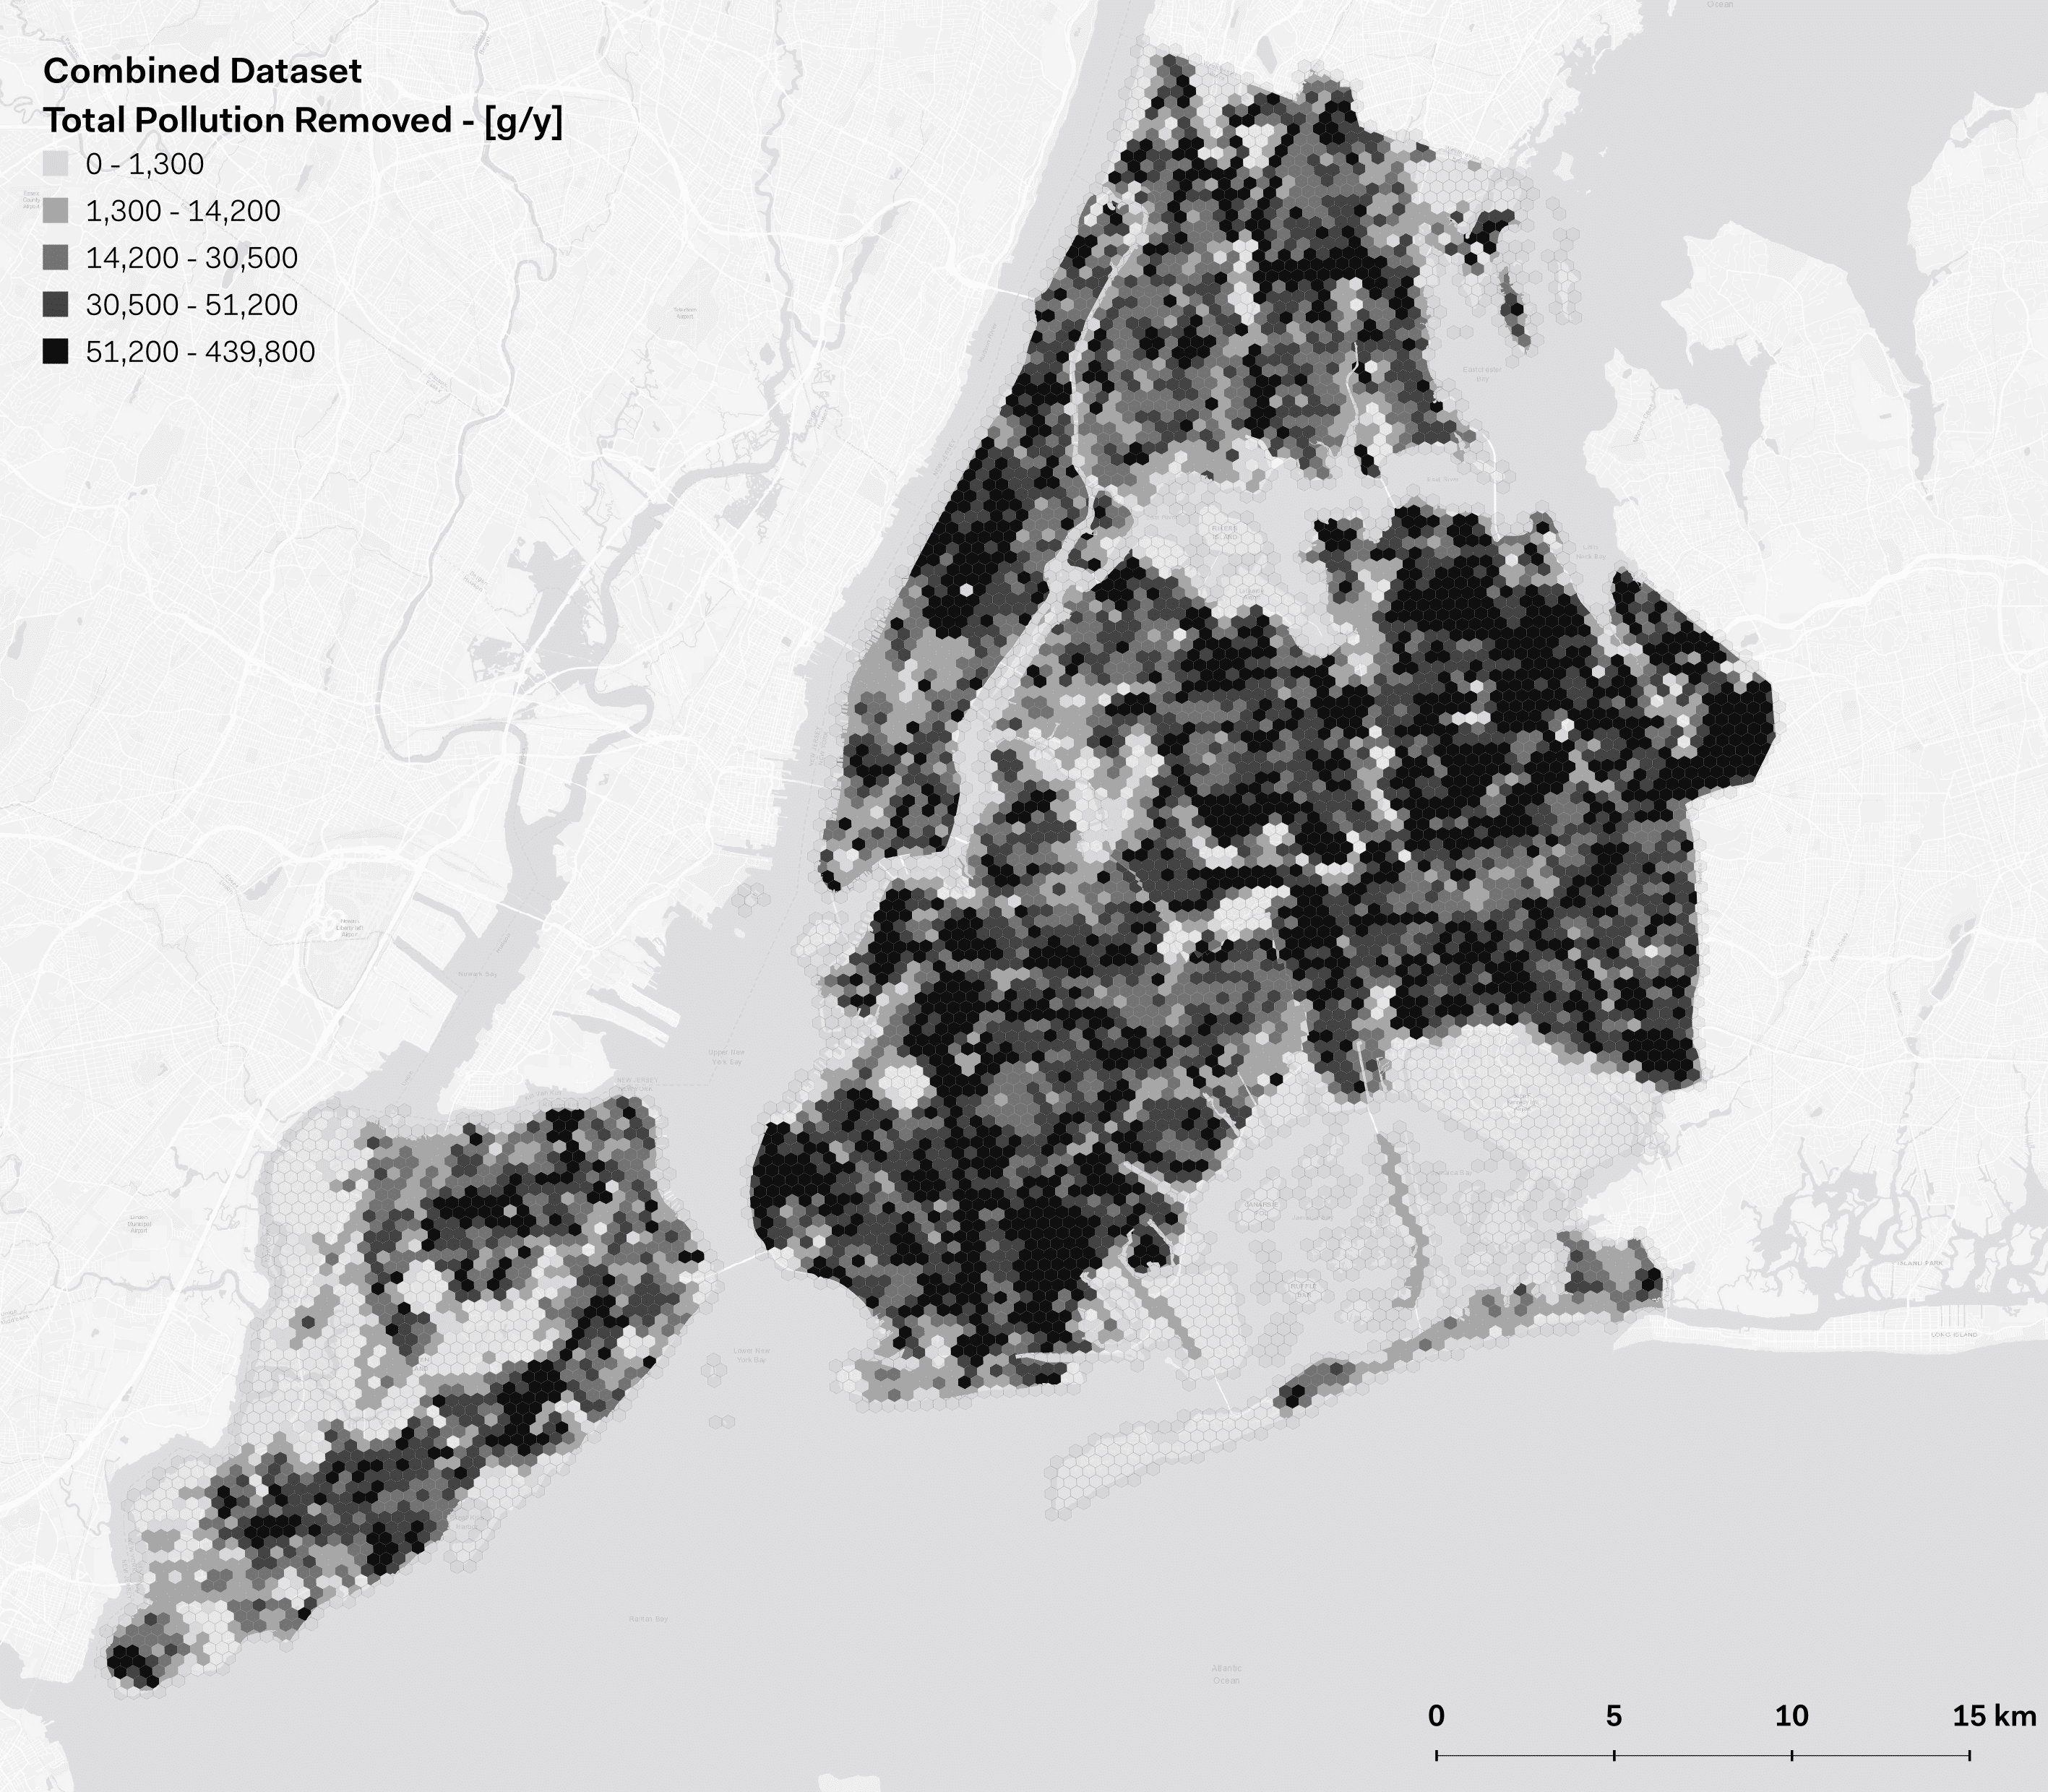
Figure 2: Comparison between the pollution removal levels of the Street Tree Dataset and the Combined Dataset
Pollution removal was calculated and disaggregated per each substance (see Figure 5 in Annex), the one that emerged as the highest sink effect is the absorption of ozone. The gross carbon sequestration of street trees is about 8.005 thousand tons of carbon per year with an associated value of 1.37 million dollars, compared to the combined dataset, where the gross carbon sequestration is about 10.73 thousand tons of carbon per year with an associated value of 1.83 million dollars. The inclusion of 23.6% more trees increased the carbon sequestration by 34.04%. Trees in street trees dataset are estimated to store 269,000 tons of carbon ($45.9 million). Of the species sampled, London planetree stores and sequesters the most carbon (approximately 31% of the total carbon stored and 21.3% of all sequestered carbon). Additionally, these street trees are estimated to produce 21.35 thousand tons of oxygen per year. The trees in the combined dataset are estimated to store 384,000 tons of carbon ($65.4 million). It is interesting to note that the highest pollution removal takes place in the outer boroughs, where population density is lower, compared to Manhattan. On the other hand, the emissions absorption is significantly lower in Manhattan, which boasts the highest population, road and traffic density.
These pollutant removal, carbon sequestration and storage findings suggest that the city should increase the tree count as planned, and that planting the correct species of trees can lead to significant improvements in the overall air quality.
The spatial variability in the absorption of individual greenhouse gas pollutants is evident in every map (see Figures 2, 3 and 5) and follows a similar structure to the tree density. Between the Street Tree and the Combined Datasets the mean pollution values remain relatively the same, but the total population removal per pollutant nearly doubles. This suggests that the inclusion of the park trees gives a better estimate of tree benefits in the city, and the planting of certain species, even in smaller numbers can have a drastic impact. Each pollutant substance has different characteristics, causes and seasonality, in particular:
- The greatest source of outdoor Carbon monoxide (CO) in cities are vehicles and machinery that burn fossil fuels, with higher concentrations in urban areas. Carbon monoxide also contributes to the formation of carbon dioxide and ozone (NYC, 2018). The maps show a dramatic difference in the average CO removal values between both datasets. This suggests that the inclusion of 23.6% more trees doubles the average CO removal across the city.
- Summertime Ozone levels in the city vary based on average temperatures. Cooler temperatures contribute to lower levels of O3 citywide, while higher concentrations are typically noted in areas of lower traffic density and lower NO2 concentrations (NYC, 2018). In New York City, ozone removal is lower in Manhattan and the Bronx, and higher in the exterior areas of Brooklyn and Queens.
- Higher nitrogen dioxide concentrations have been observed in areas of high traffic density and building emissions, notably due to motor vehicles and the combustion of heating oil and natural gas. Street-level concentrations have been declining in New York City since 2009 (NYC, 2018). In the city, NO2 removal due to trees is higher in the exterior areas of the outer boroughs, and much lower in Manhattan and the areas close to downtown Brooklyn.
- Average wintertime SO2 levels, too, have been declining in the city since 2008. Higher levels are typically associated with areas of high residual oil boiler density (NYC, 2018). SO2 follows a similar removal pattern as the other pollutants, with higher removal in Brooklyn and Queens.
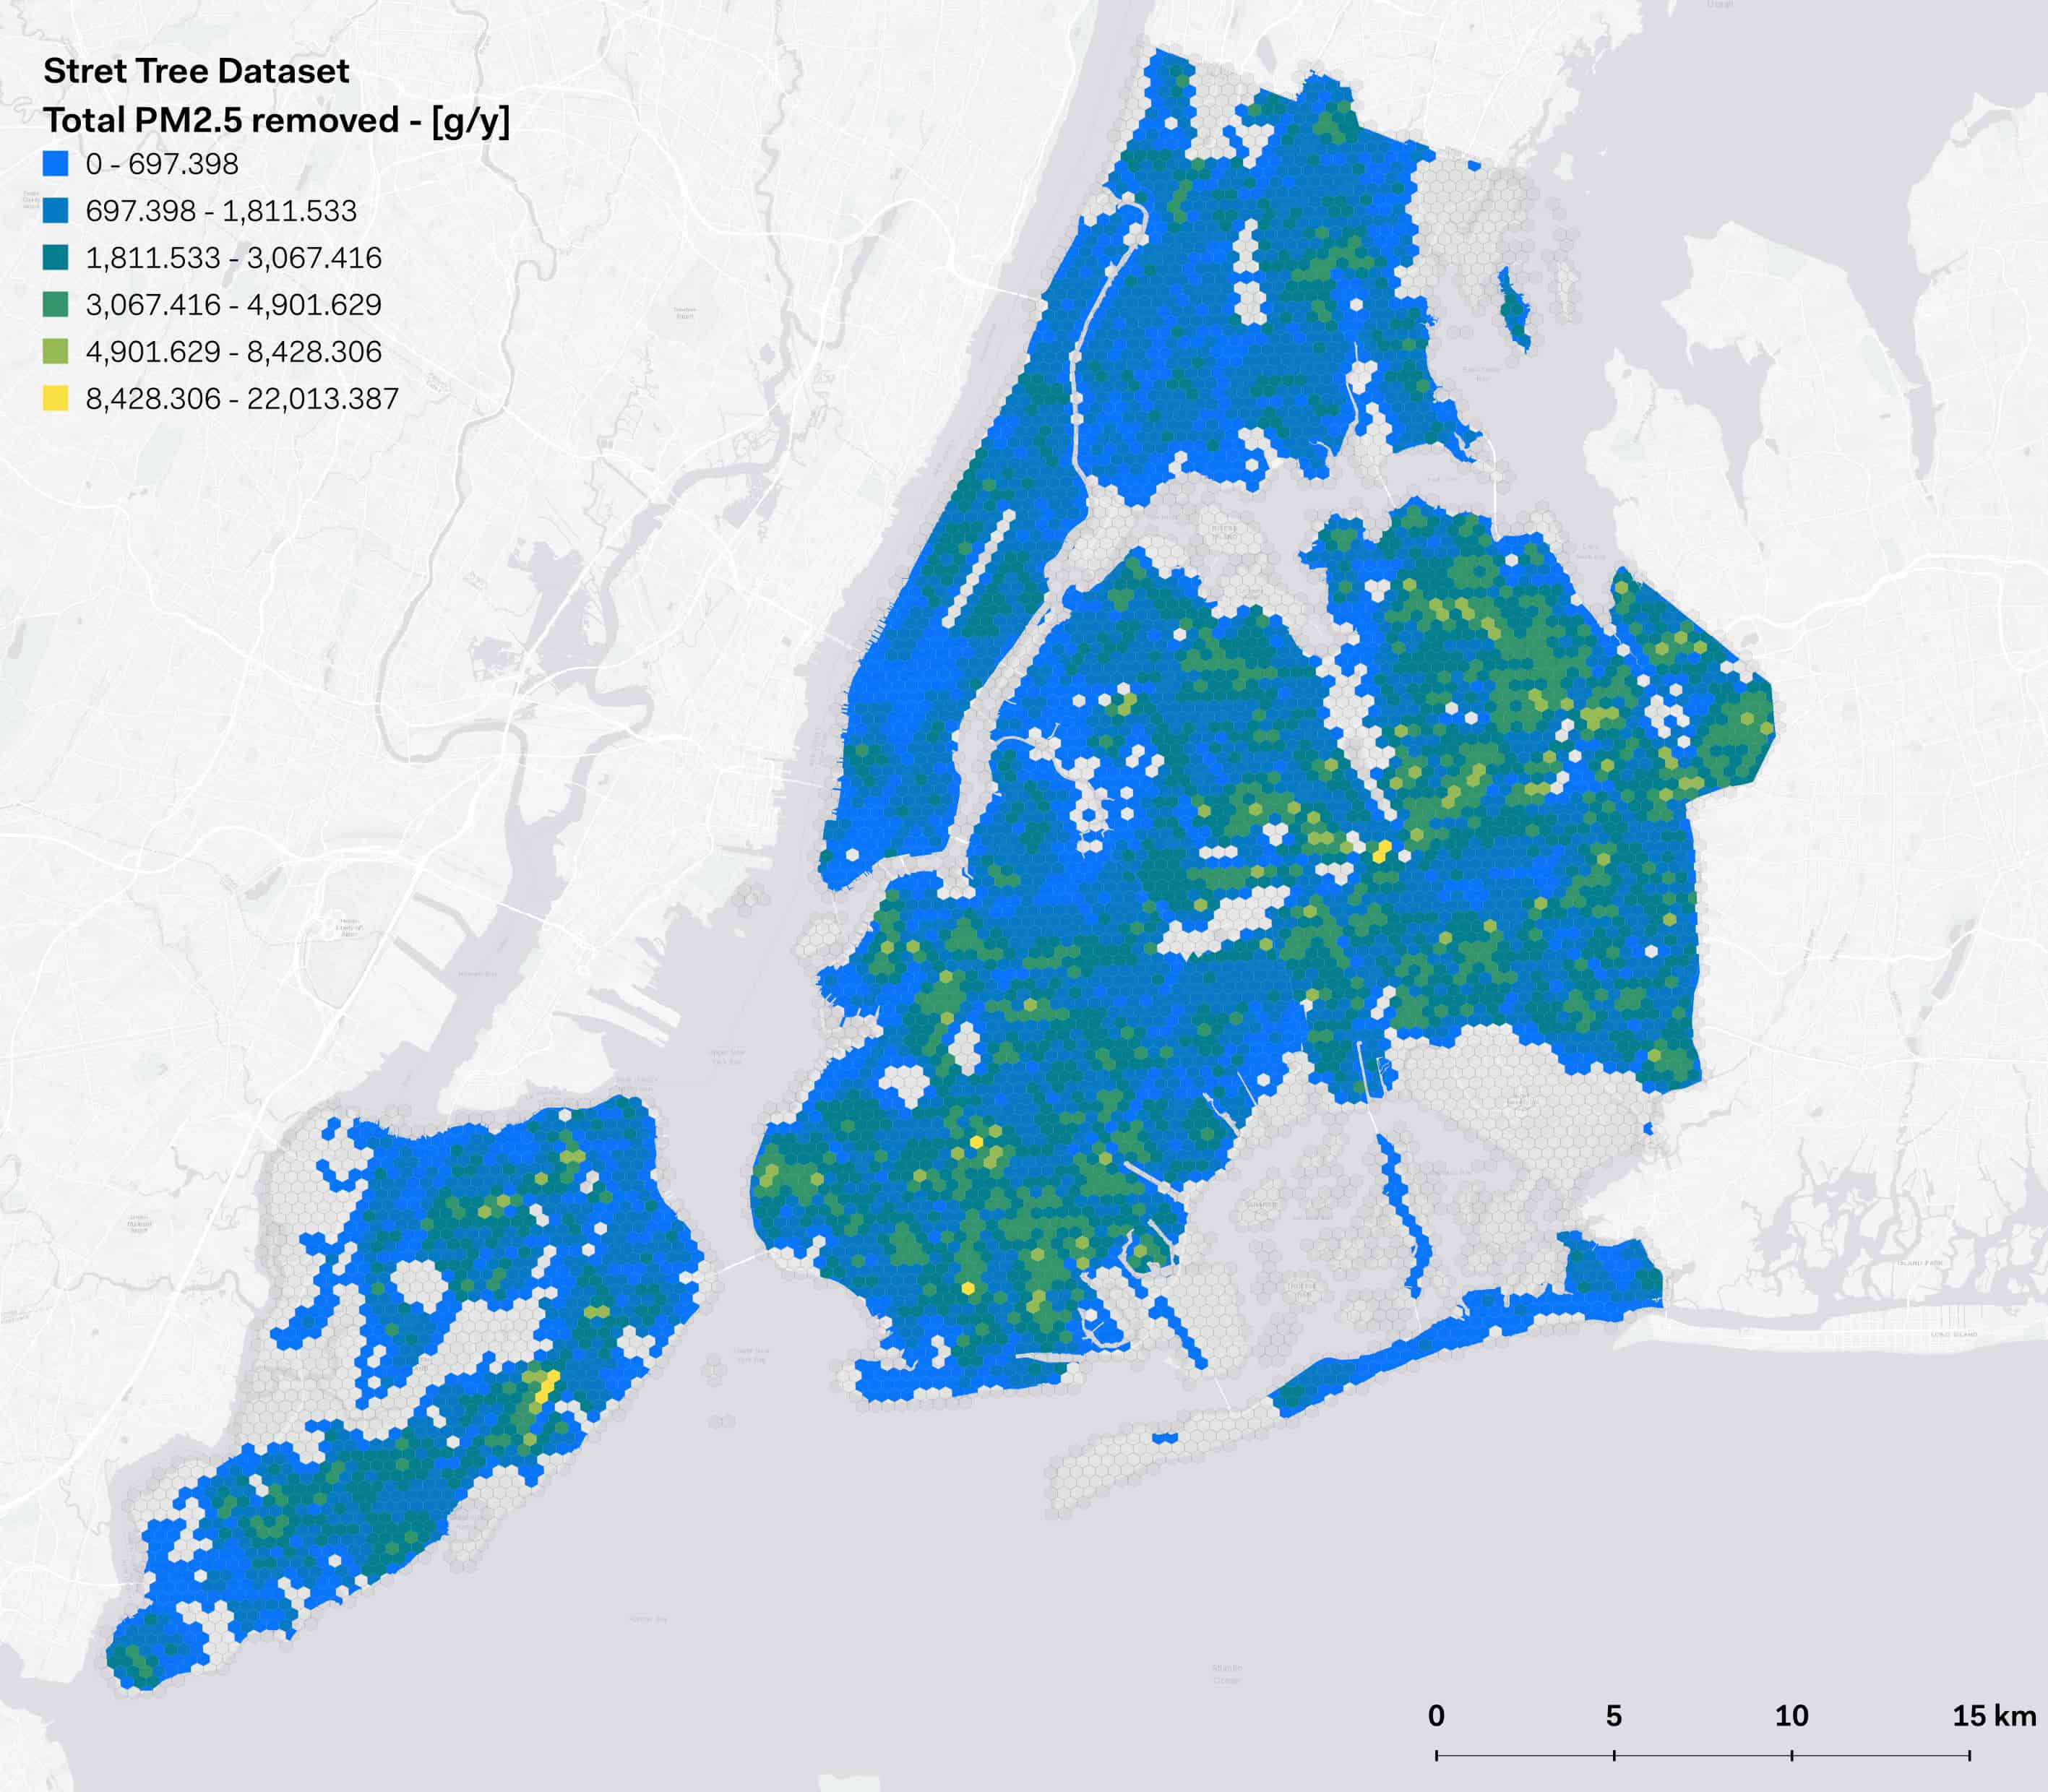
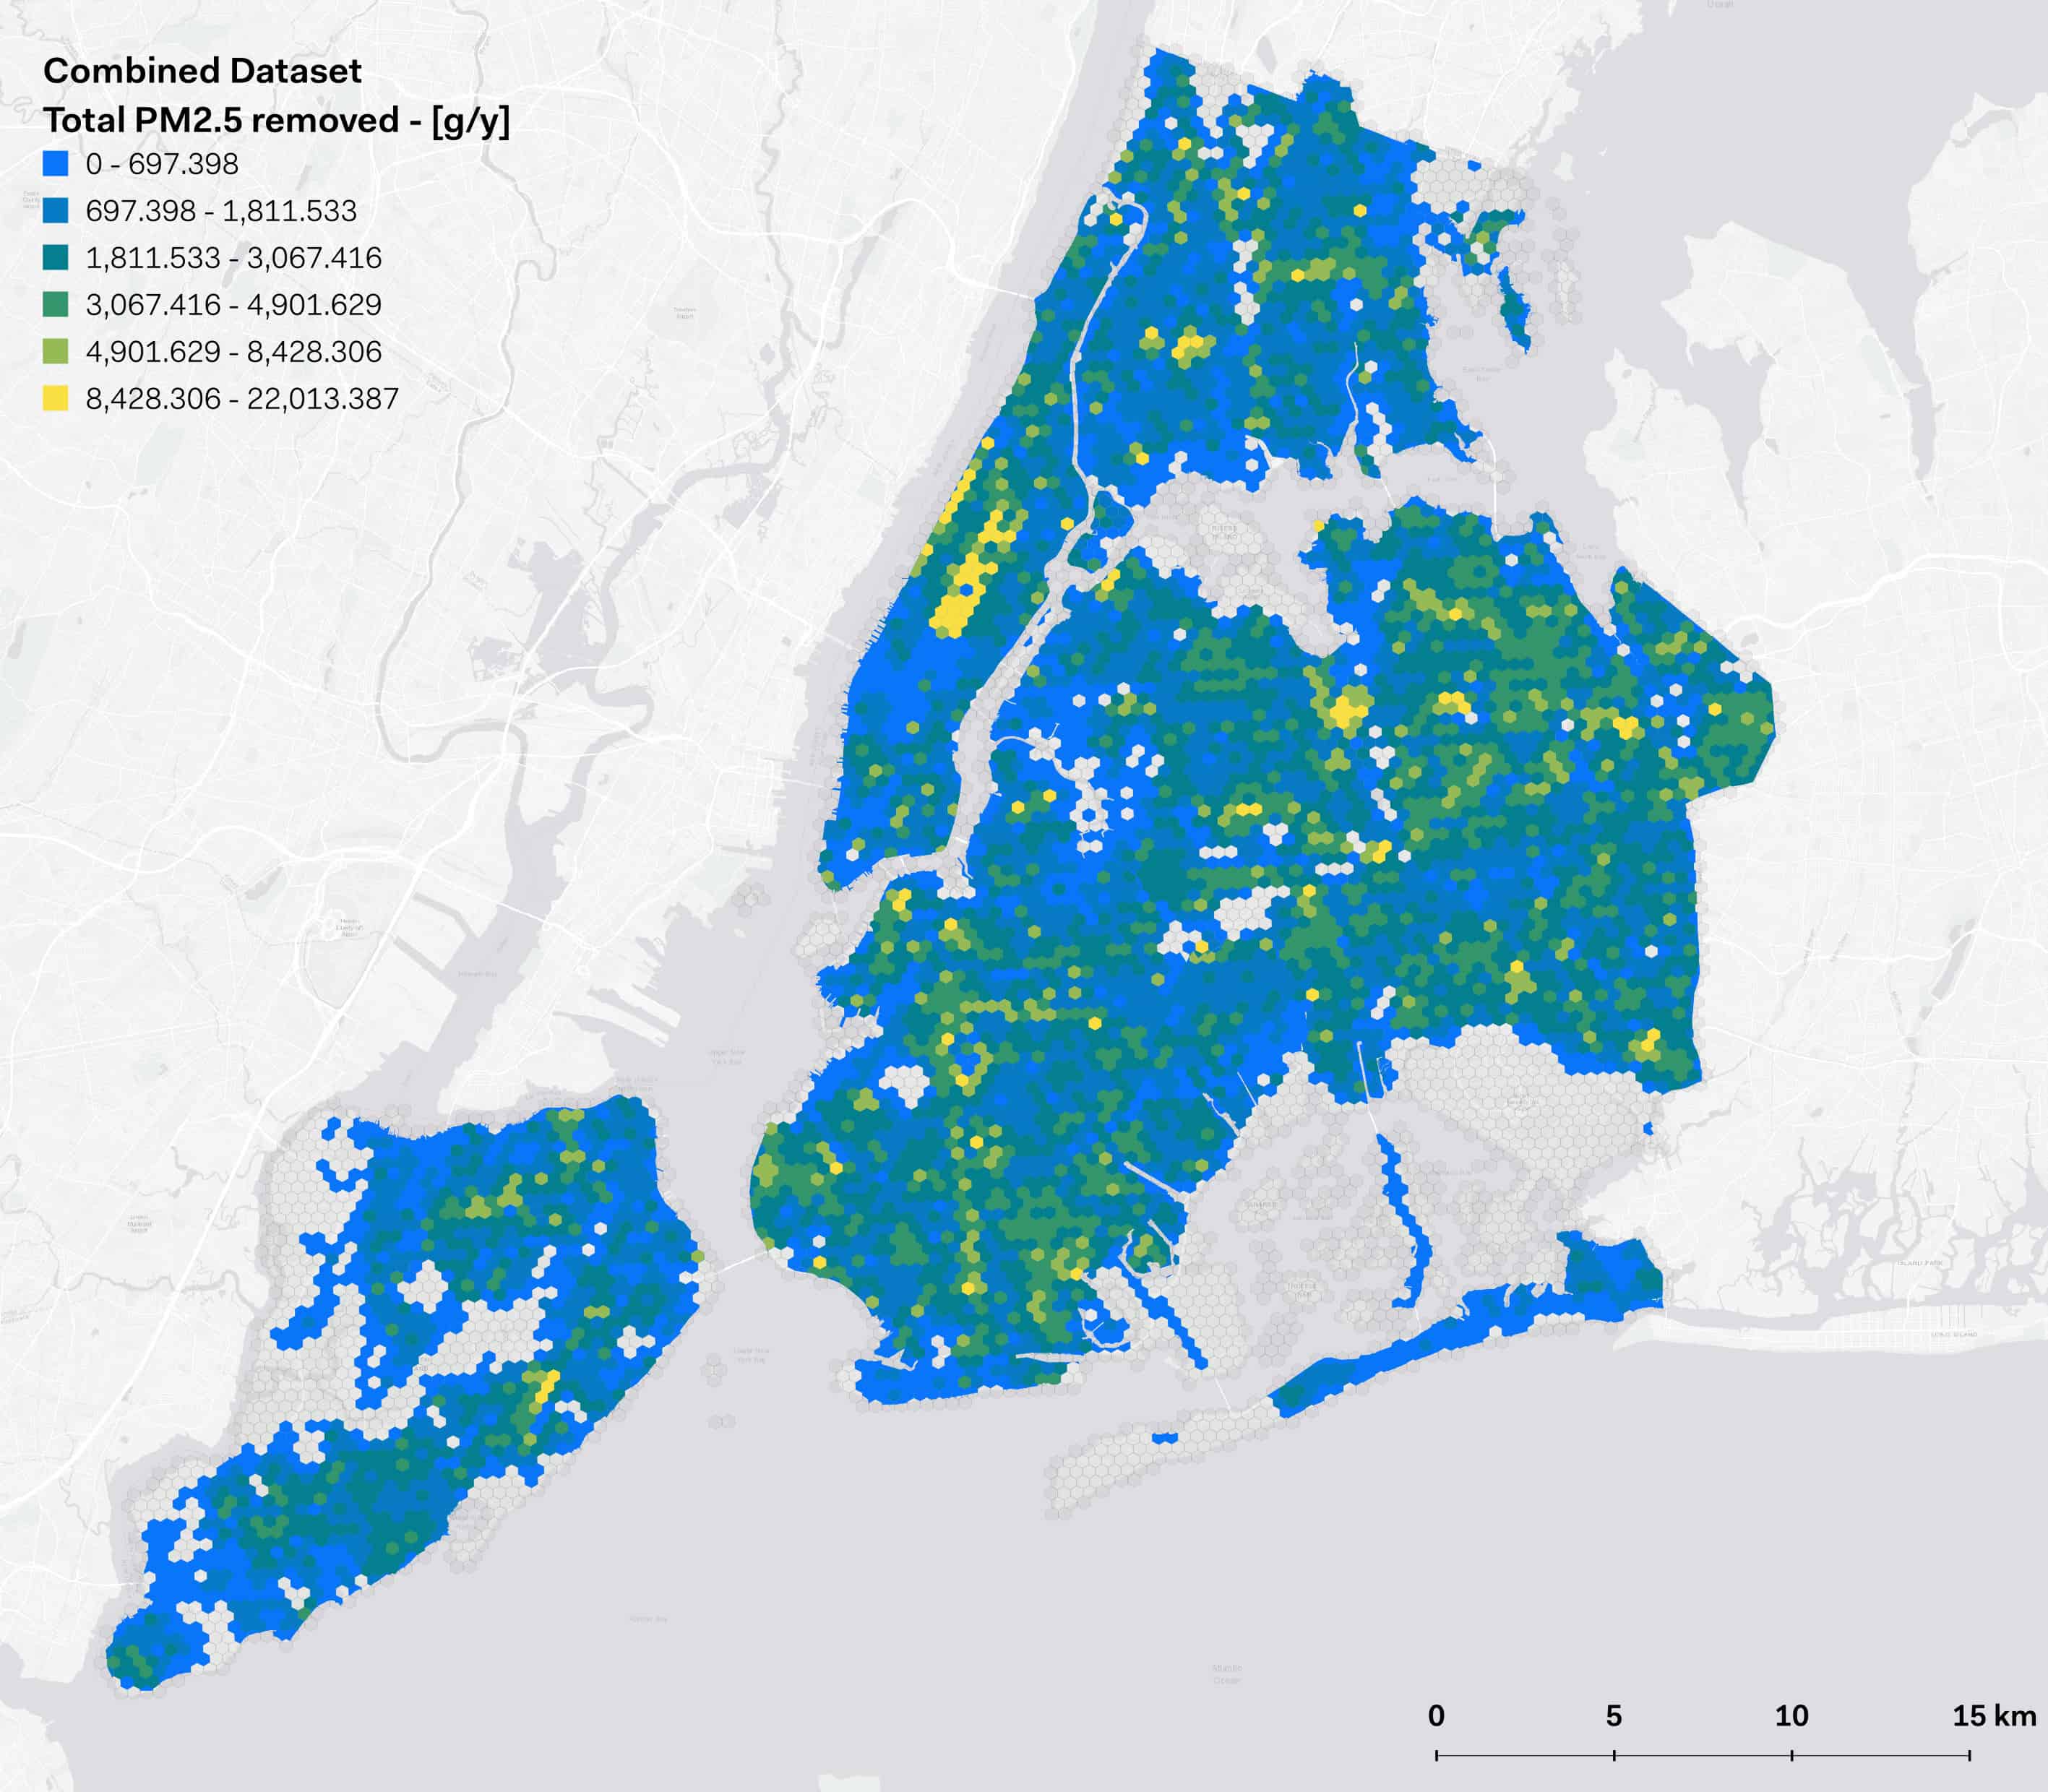
Figure 3: Comparison between the PM2.5 sink of the Street Tree Dataset and the Combined Dataset
Fine particulate matter, especially PM2.5 (See Figure 3), is generally more relevant in discussions concerning air pollution effects on human respiratory health, both short-term and long-term. The ability of the particulate matter to travel deep into the lungs, poses one of the highest health risks in the population today (US EPA, 2022). The New York City Community Air Survey (NYCCAS) measures their concentrations to have been declining in the city since 2009. Higher concentrations are typically associated with boiler and traffic emissions (NYC, 2018), with higher values being observed throughout Manhattan and the outer boroughs that have higher building density, traffic and industrial areas. However, higher removal is primarily observed in the exterior areas of the outer boroughs.
Discussion
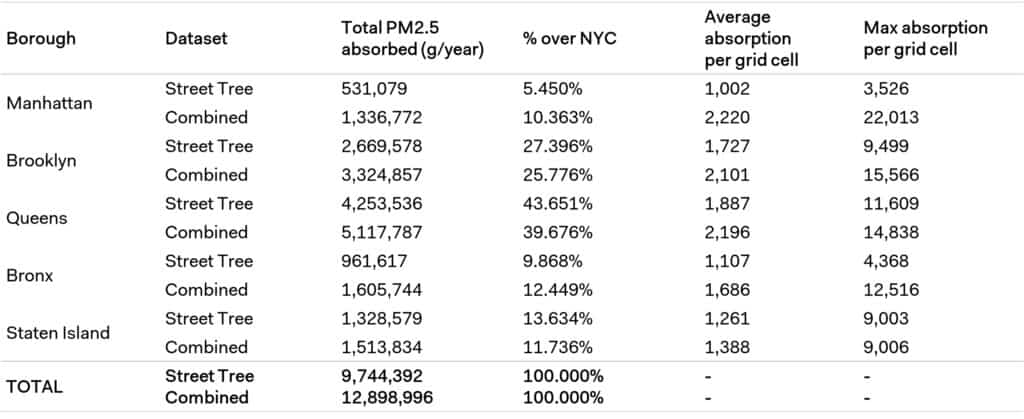
From the outcomes outlined above, it is evident how the pollutant absorption of the trees has a geographically related pattern. To offer a direct comparison, it was deemed useful to aggregate the pollution removal rates between boroughs, especially for PM2.5. In this regard, Manhattan shows the lowest absorption rate, despite its high population density. Notably, the inclusion of park trees in Manhattan raises the total PM2.5 absorbed by 152%, a similar pattern appears for the Bronx, where the value increases by 67% (see Table 5 and Figure 4). The comprehension on how the increase of the green infrastructure impacts on the pollution sink rates is crucial to advocate for taking actions in this direction. The health outcomes effect of such variation is out of the scope of this research, but it has been thoroughly assessed in general and in the specific case of NYC (NYC, 2018).
PM2.5 is classified as a regulated criteria pollutant by the U.S. Environmental Protection Agency (US EPA, 2023). Although it can be attributed to multiple emission sources, studies have associated elevated concentrations of the pollutant with the transportation sector (Askariyeh et al., 2020). In the United States, as of 2019, the transportation sector accounts for more than 29% of greenhouse gas emissions (US EPA, 2021), and approximately 11% – 19% of the country’s population living in proximity to major roads is exposed high levels of PM2.5 (Askariyeh et al., 2020). In New York City, motor vehicles are responsible for 11% of total PM2.5 emissions (NYC, n.d.).
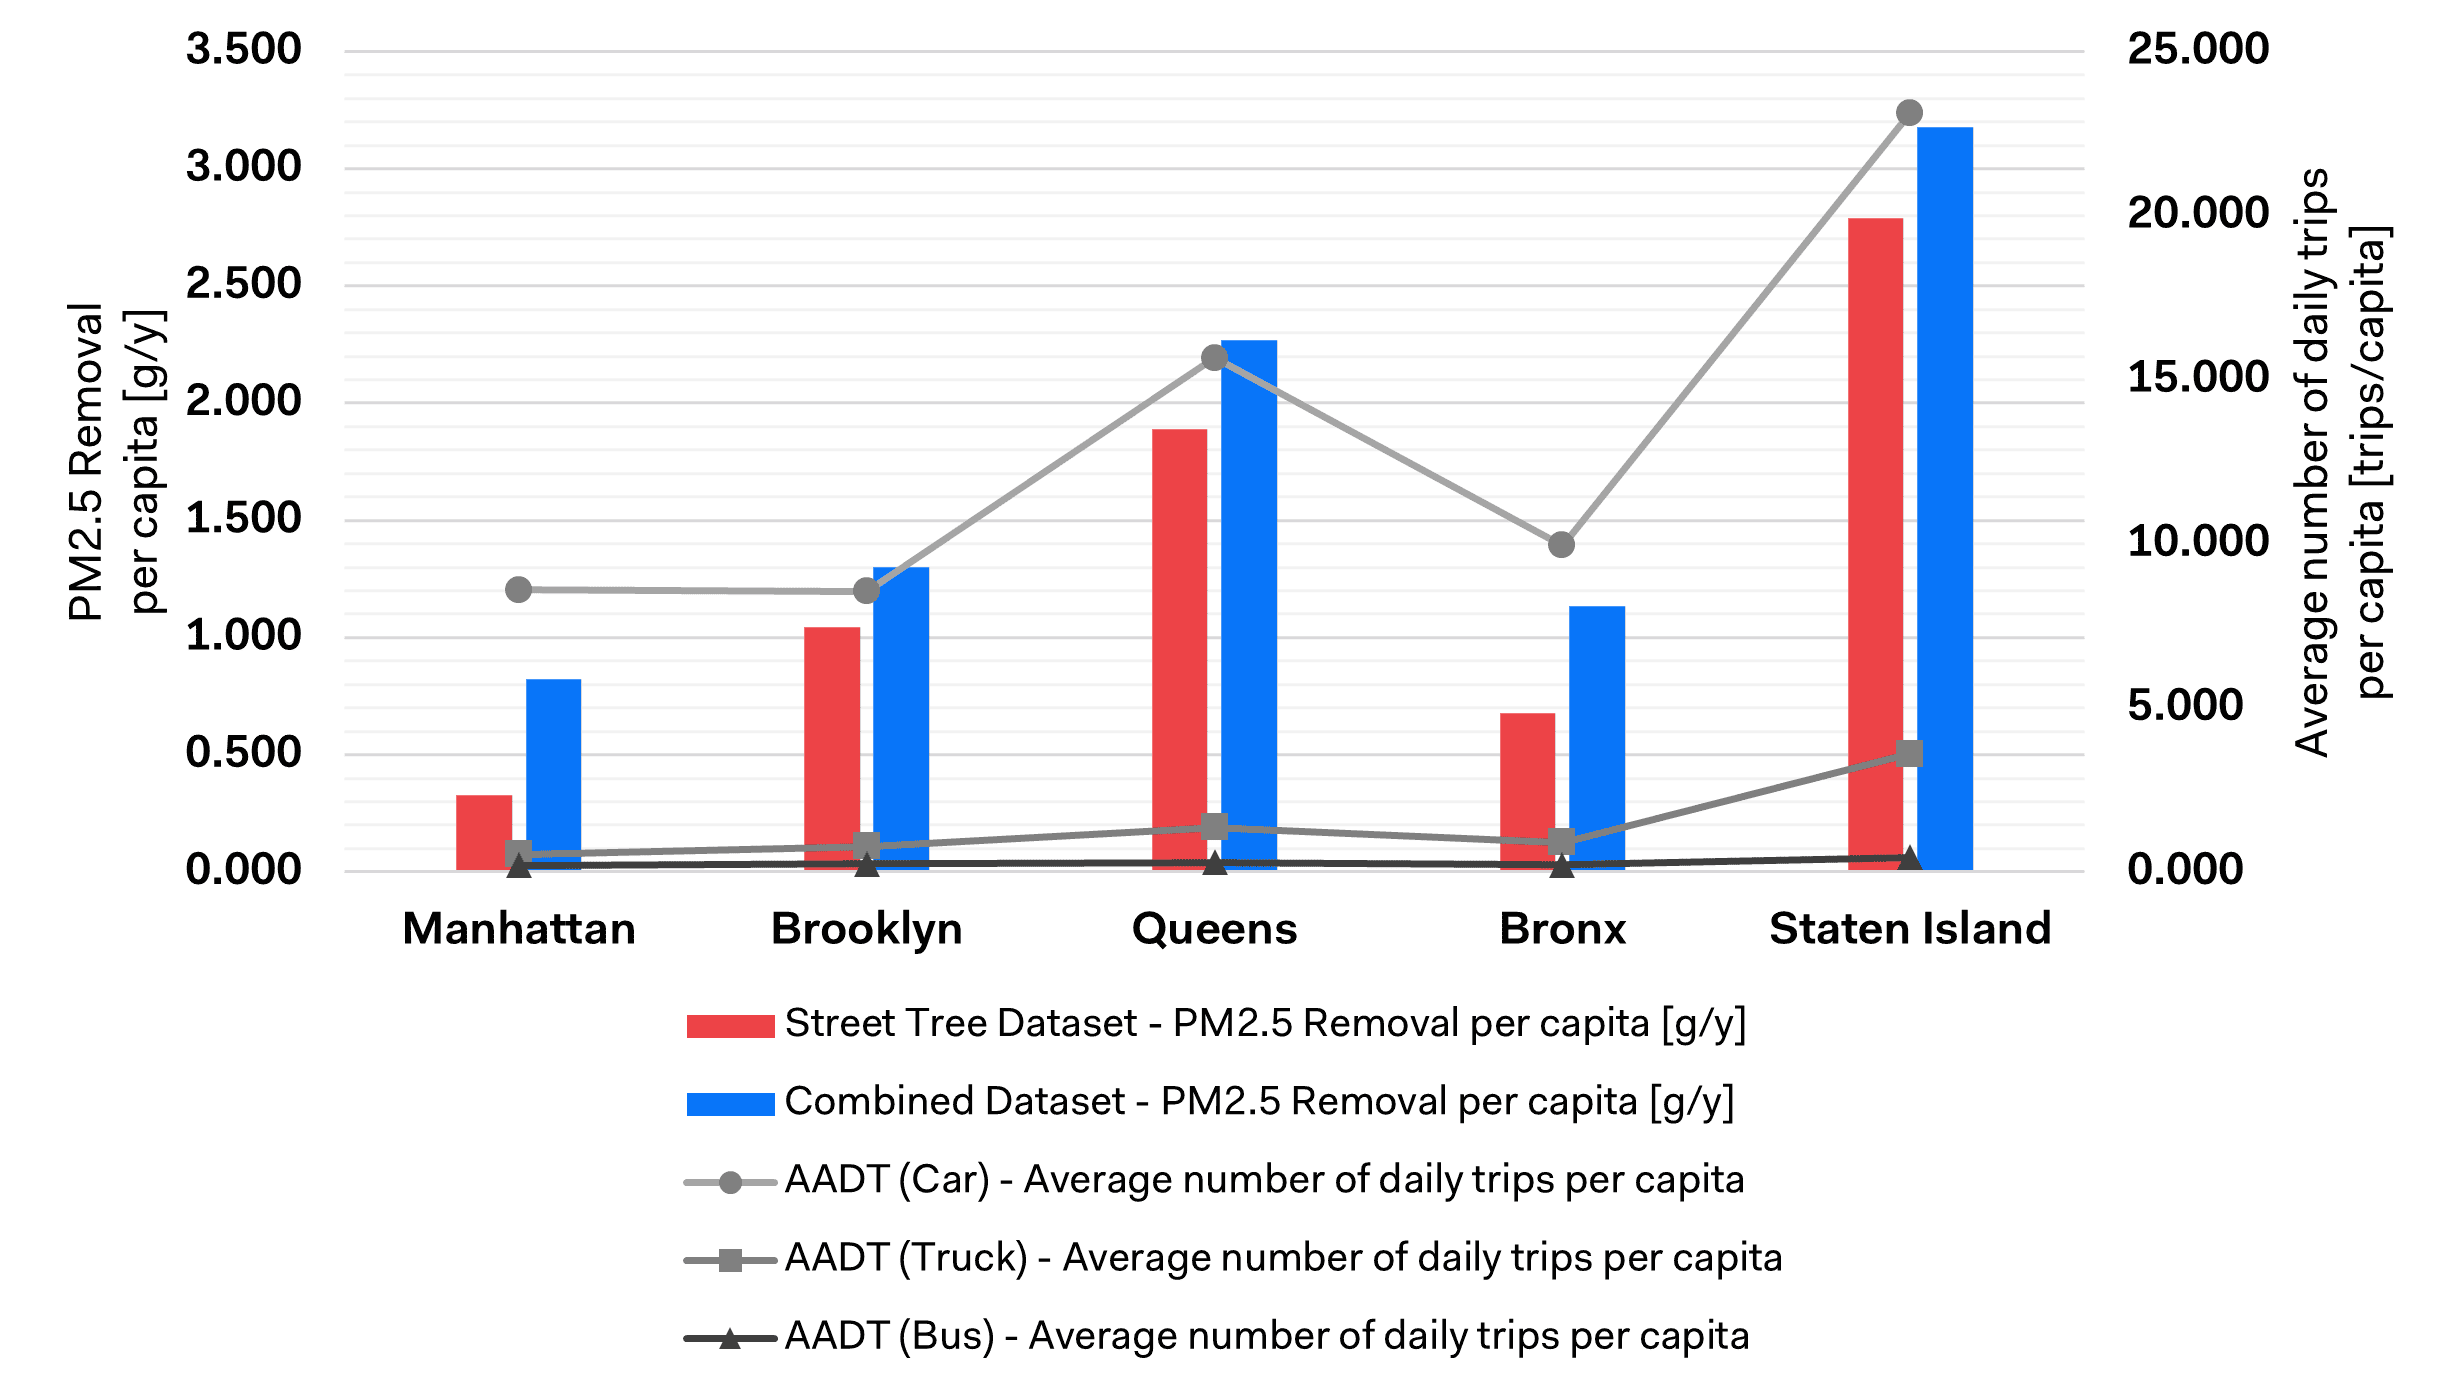
Thus, to further contribute to the conversation regarding inequality in green infrastructure distribution across boroughs, it is possible to add another informative layer to this research, namely the vehicular flows on the city network. The dataset was explored during the initial phases of this research and it is going to be assessed, in addition to other emission sources, in the second part of this study. Vehicle flows are retrieved from the Traffic Data Viewer that is maintained by the New York State Department of Transportation’s Traffic Monitoring Section (NY DOT, n.d.). The dataset includes details on the annual average daily traffic on road segments or at counting stations based on the vehicle typology breakdown. The two sets are used to build a comprehensive traffic dataset segmented by typologies and seasonally adjusted for summer and winter. This layer can be used to compare the number of trips happening in each borough with the PM2.5 sink rates. As a methodological note, it is important to specify that both these indicators, do not have a reference to the individual person, in particular the daily trips per capita should not be intended as the number of trips done by the average person, but both the indicators are the total (in the case of PM2.5 removal) and the average (in the case of the AADT) aggregates on the borough and weighted by the population.
This analysis (see Figure 4) allows for the appreciation of the importance of quantifying green infrastructure outcomes as a social importance factor, by comparing it with other informative layers and with the population, enabling an interpretation that should have the goal to maximize the effects that forestation interventions could have on the citizens of NYC. In particular, the chart shows that both Manhattan and Bronx share a deficiency of PM2.5 sink rates compared to the other boroughs, as the proportion of AADT and PM2.5 removal is falling short when compared to the population.
Conclusions and Future Work
The study’s findings reveal how the spatial distribution of the green infrastructure follows very site-specific patterns, in particular tree presence in Manhattan is very high in certain locations and scarce in the majority of the borough, meanwhile other boroughs (e.g., Brooklyn and Queens) exhibit a lower but continuous overall tree density. Moreover, the i-Tree analysis of the datasets shows that pollution removal levels are significantly higher in the outer boroughs, including Brooklyn, Queens, the Bronx, and certain parts of Staten Island. Interestingly, Manhattan, despite having a higher population and building density, has lower pollution removal values. This may be attributed to historical planning reasons, to the scarcity of street trees in certain parts of the borough and to the inequitable distribution of certain tree species that are more effective at removing pollutants.
Strategies for Air Quality Improvement
Implementing the following urban forest management strategies can effectively enhance the green cover of cities (Nowak, 2000). While not exhaustive, many cities, including New York City, have already initiated several of these practices:
- Maintaining the existing tree cover and improving the number of healthy trees on streets and in parks is a key step for preserving pollution removal levels;
- Planting trees in polluted and densely populated areas fosters an equitable distribution of benefits;
- Planting evergreen trees can facilitate year-round removal of particulate matter;
- Selecting tree species that are native to the region and comprehending the risks associated with planting certain species in specific areas can minimize the risk of pest infestations and the emission of volatile organic compounds, ultimately promoting a healthier urban forest;
- Consistent investment in the city’s urban forest, in terms of both funding and resources, can ensure its long-term success.
Limitations
The datasets considered in the analysis are the most recent available, namely Street Tree Census is dated 2015, and the parkland survey is dated 2017-2018. Both do not account for tree additions or replacements since then. In addition to this, the parkland survey does not cover trees that are in forest areas inside parks, this is particularly visible in Central Park.
Future Work
This research is the first part of a two step study, the second part will mainly focus on the construction of an analytical spatial model able to simulate the pollution in NYC based both on emitting and absorption factors and verified by ground truth data (pollution data acquired from city sensors).
Moreover, the research will take into account:
- The identification of markedly polluted areas and the estimate of the volume and species of urban green cover necessary to offset the amount of pollutants generated. This effort would help inform tree planting strategies pertaining to climate adaptation across the five boroughs.
- The spatial variability in the effectiveness of trees in removing pollutants and how it can serve as a useful tool for examining pollution patterns in communities that fail to meet the standards established by the United States Environmental Protection Agency’s National Air Quality Standards (EPA NAAQS). The maps can identify at-risk neighborhoods that may have higher pollution concentrations compared to others.
Additional maps
Even if each of the polluting substances considered in this research follows a similar spatial pattern, for the sake of completeness the following maps are included in Figure 5, in the following order:
- Carbon Monoxide (CO) removal as per Street Tree Dataset;
- Carbon Monoxide (CO) removal as per Combined Dataset;
- Ozone (O3) removal as per Street Tree Dataset;
- Ozone (O3) removal as per Combined Dataset;
- Nitrogen Dioxide (NO2) removal as per Street Tree Dataset;
- Nitrogen Dioxide (NO2) removal as per Combined Dataset;
- Sulfur Dioxide (SO2) removal as per Street Tree Dataset;
- Sulfur Dioxide (SO2) removal as per Combined Dataset;
- Particulate Matter (PM10) removal as per Street Tree Dataset;
- Particulate Matter (PM10) removal as per Combined Dataset.


Figure 5: Removal rates for each polluting substance considered in this study for the Street Tree Dataset and the Combined Dataset
Acknowledgements
The research work has been carried out in collaboration with Vinita Wagh – alumna of 2022 Class the of Masters of Science in Applied Urban Science and Informatics degree at the New York University, as part of her internship period at Systematica US, Inc. (NY, U.S.). We thank the NYC open data portal and the Department of Park and Recreation (DPR) for enabling this research by sharing data. The analyzed data were treated according to the GDPR-General Data Protection Regulation (EU, 2016/679). This research received no specific grant from any funding agency in the public, commercial, or not-for-profit sectors.
Reference
Askariyeh, M.H., Venugopal, M., Khreis, H., Birt, A., & Zietsman, J. (2020). Near-Road traffic-related air pollution: Resuspended PM2.5 From highways and arterials. International Journal of Environmental Research and Public Health, 17(8), 2851. https://doi.org/10.3390/ijerph17082851
Bhandaram, U. (2022, December 6). NYC Parks – Park Tree Inventory Dashboard. Tableau Public. Retrieved April 10, 2023, from https://public.tableau.com/app/profile/uma.bhandaram/viz/NYCParks-ParkTreeInventoryDashboard/LandingPage
Gorrini, A., Messa, F., Presicce, D., Attardi, V., Deponte, D., Balestrini, A., Schiavo, F., Pirosa, L., & Pallotta, D. (2022). Nature-based Solutions to Mitigate Vehicular Traffic Pollution Beyond SUMPs. 4th International Conference on Smart and Sustainable Planning for Cities and Regions 2022 (SSPCR 2022), Bolzano, Italy. https://doi.org/10.5281/zenodo.6778749
i-Tree. (n.d.). About. i-Tree. Retrieved April 10, 2023, from https://www.itreetools.org/about
Lai, Y., & Kontokosta, C.E. (2019). The impact of urban street tree species on air quality and respiratory illness: A spatial analysis of large-scale, high-resolution urban data. Health & Place, 56, 80–87. https://doi.org/10.1016/j.healthplace.2019.01.016
MillionTrees NYC (n.d.). About MillionTrees NYC. Million Trees NYC. Retrieved April 10, 2023, from https://www.milliontreesnyc.org/html/about/about.shtml
Nowak, D.J. (2000). The interactions between urban forests and global climate change. In: Abdollahi, K.K.; Ning, Z.H.; Appeaning, A., eds. Global Climate Change & the Urban Forest. Baton Rouge, LA: Franklin Press: 31-44. https://www.researchgate.net/publication/288254909_The_interactions_between_urban_forests_and_global_climate_change
Nowak, D.J.,. Crane, D.E., (2000). The Urban Forest Effects (UFORE) model: quantifying urban forest structure and functions. In: Hansen, Mark; Burk, Tom, eds. Integrated tools for natural resources inventories in the 21st century. Gen. Tech. Rep. NC-212. St. Paul, MN: U.S. Dept. of Agriculture, Forest Service, North Central Forest Experiment Station. 714-720. https://www.fs.usda.gov/research/treesearch/18420
Nowak, D.J., Crane, D.E., Stevens, J.C., Hoehn, R.E. (2006). The urban forest effects (UFORE) model: field data collection manual. V1b. Newtown Square, PA: U.S. Department of Agriculture Forest Service, Northeastern Research Station. https://urbanforestrysouth.org/resources/library/ttresources/urban-forest-effects-ufore-model-field-data-collection-manual
Nowak, D.J., Hirabayashi, S., Bodine, A., & Greenfield, E. (2014). Tree and forest effects on air quality and human health in the United States. Environmental Pollution, 193, 119–129. https://doi.org/10.1016/j.envpol.2014.05.028
NY DOT (n.d.). Traffic Data Viewer. New York State – Department of Transportation. Retrieved April 10, 2023, from https://www.dot.ny.gov/tdv
NYC (n.d.). Transportation Emissions. Department of Environmental Protection. Retrieved April 10, 2023 , from https://www.nyc.gov/site/dep/environment/transportation-emissions.page
NYC (n.d.). TreesCount! 2015 – 2016 Street Tree Census. Department of Parks and Recreation. Retrieved April 10, 2023, from https://www.nycgovparks.org/trees/treescount
NYC (2007). PlaNYC: A Greener, Greater New York. City of New York. Retrieved April 10, 2023, from https://www.nyc.gov/html/planyc/downloads/pdf/publications/full_report_2007.pdf
NYC (2011). PlaNYC update April 2011: A Greener, Greater New York. City of New York. Retrieved May 12, from https://www.nyc.gov/html/planyc/downloads/pdf/publications/planyc_2011_planyc_full_report.pdf
NYC (2018). The New York City Community Air Survey. Department of Health and Mental Hygiene. Retrieved May 10, 2023 from https://www.nyc.gov/assets/doh/downloads/pdf/environmental/comm-air-survey-08-16.pdf
NYLCV (2022). New York City Policy Agenda 2022. New York League of Conservation Voters & New York League of Conservation Voters Education Fund.Retrieved April 10, 2023, from https://nylcv.org/wp-content/uploads/NYLCV_2022_NYCPolicyAgenda_webpgs.pdf
The Nature Conservancy (2021). NYC Urban Forest Agenda: Toward A Healthy, Resilient, Equitable, and Just New York City. The Nature Conservancy. Retrieved April 10, 2023, from: https://forestforall.nyc/wp-content/uploads/2021/06/NYC-Urban-Forest-Agenda-.pdf
Treglia, M.L., Acosta-Morel, M., Crabtree, D., Galbo, K., Lin-Moges, T., Van Slooten, A., & Maxwell, E.N. (2021). The State of the Urban Forest in New York City. The Nature Conservancy. https://doi.org/10.5281/zenodo.5532876
US EPA (2022, July 18). Particulate Matter (PM) Basics. United States Environmental Protection Agency. Retrieved April 10, 2023, from https://www.epa.gov/pm-pollution/particulate-matter-pm-basics
US EPA (2023, March 15). NAAQS Table. United States Environmental Protection Agency. Retrieved April 10, 2023, from https://www.epa.gov/criteria-air-pollutants/naaqs-table
US EPA (2021). U.S. Transportation Sector GHG Emissions 1990-2019 Fast Facts. United States Environmental Protection Agency – Office of Transportation and Air Quality. Retrieved April 10, 2023, from https://nepis.epa.gov/Exe/ZyPDF.cgi?Dockey=P1013NR3.pdf