
This work aimed at evaluating how a temporary school square, implemented in March 2022 in the city of Bologna under the principles of the tactical urbanism approach, impacted on vehicular patterns through exploiting TomTom Floating Car Data (FCD) from before and after the intervention. Results from trend analyses on sample sizes suggested that traffic flows were relocated from segments directly interested by the intervention (-23.87%) towards adjacent streets or segments in a buffer area (+3.51% and +3.50% respectively) instead of disappearing as opposed to more widespread interventions described in literature. OD matrices per 15-minute time fractions over three peak time slots have been extracted to obtain reliable input data for a future development of traffic microsimulation models. A data-driven extraction method was employed, based on least squares optimization problems solving systems of linear equations based on a selection of traffic counts, after calculating a set of shortest paths according to observed travel time and attributing route choice proportionality through a Path Size Logit (PSL) model.
Introduction
Tactical urbanism is an innovative urban design approach consisting of interim street transformations enabling public authorities and administrations to temporarily requalify deteriorated or misused urban spots to be regenerated and reinstated into their original purposes. Such approach is characterized by limited financial resources usage and streamlined bureaucratic procedures and requires the involvement of the public, especially locals or usual users of the area, who can have their say during the project design and the later assessment phases (Cariello et al., 2021). In the recent years, the practice of tactical urbanism has been increasingly employed in urban settings throughout the world (GDCI, 2022), making progress in the achievement of SDG11 – Sustainable Cities and Communities, promoted by the 2030 Agenda for Sustainable Development (United Nations, 2016), especially for targets 11.3 and 11.7.
Such street experiments aim at establishing the idea that streets should belong to people rather than traffic (Bertolini, 2020) by physically reducing road space capacity for vehicles in favor of pedestrians and soft mobility. This practice allegedly leads to traffic evaporation, referring to the reduction in traffic flows as a consequence of capacity-limiting interventions on the transport network (Cairns et al., 2002), to be intended as the opposite of induced traffic resulting from an expansion of road capacity.
While the impact on pedestrian accessibility of such reconverted spaces has been positively assessed through previous experiences (Yassin, 2019), literature has recently started wondering how it can affect the surroundings in terms of transport network performance. Nello-Deakin (2022) provides a valid example of the research effort of exploring impacts on a wider perspective on the network: it exploited datasets of traffic counts provided by permanent sensors to evaluate the extent of traffic evaporation following the extensive implementation program of multiple tactical urbanism interventions in the Eixample district of the city of Barcelona, Spain. The study investigated not only streets directly interested by interventions but also assessed traffic levels in a buffer area within 500 metres. This work led to confute the assertion that traffic would simply gather onto more convenient paths and congest roads in a limited buffer area, as results suggested that overall traffic had diminished, with a very low relative increase in the streets adjacent to interventions.
Furthermore, more innovative technologies are being employed to elaborate input data for traffic demand models. Nowadays, research found out that the impressive amount of Floating Car Data (FCD), passively recorded by devices embedded in vehicles as well as mobile phones or even wearable devices, could be of use when estimating mobility patterns, both boosting coverage of data samples and enhancing modelling accuracy. Lately, Floating Car Data has been used as ground data for research studies addressing mobility tasks and issues, such as detecting and analyzing urban patterns from GPS traces (Necula, 2015), estimating traffic delays and network speeds from low-frequency GPS taxi trajectories (Deng et al, 2015), detecting traffic congestion and incidents (D’Andrea & Marcelloni, 2017), or estimating or updating OD matrices.
Indeed, even though estimation of OD matrices from scratch can be a challenge from mathematical standpoint, due to the current availability of large streams of passively collected data, data-driven methods have started to be developed and validated by academic research as an efficient alternative to traditional OD estimation methodologies. For instance, in Bonnel et al. (2018) and later in Fekih et al. (2021), data from mobile phone networks were used to estimate OD matrices in the Rhône Alpes region in France. Croce et al. (2021) integrated FCD data to traditional models and surveys at sub-regional level to enhance predictions and analyses of transport planners. Demissie & Kattan (2022) analyzed GPS trajectory data over one year to estimate origin-destination flows of trucking vehicles within the province of Alberta, Canada.
This study intended to experiment a procedure suitable in this context to obtain a reliable Origin-Destination matrix without any ground truth OD data: after a thorough literature review on the topic, the selected procedure to test was a simplified version of the one presented in Krishnakumari et al. (2020), who proposed a method applicable in presence of 3D supply patterns only (sample size and speed values per each time period) on all segments of the network, consisting of a large equation system to be integrated with principal component analysis in case of severely underdetermined systems (typical of larger networks). The research experiment featured fundamental assumptions regarding route choice, e.g., cutting off the number of considered paths and assigning a proportionality coefficient to each path in the OD pair-specific set calculated through a route choice model.
This research work focuses specifically on the case study of the implementation of temporary school square in Bologna, Italy (see Figure 1).
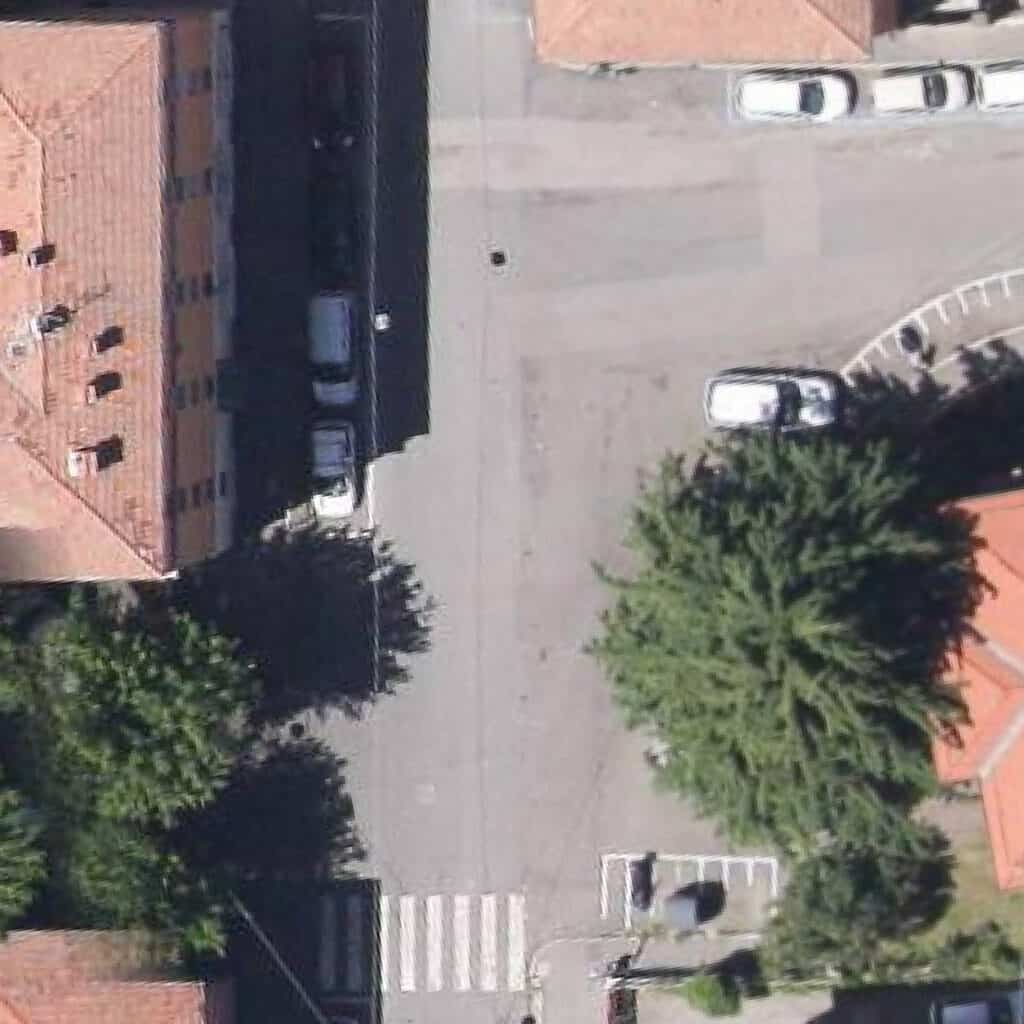
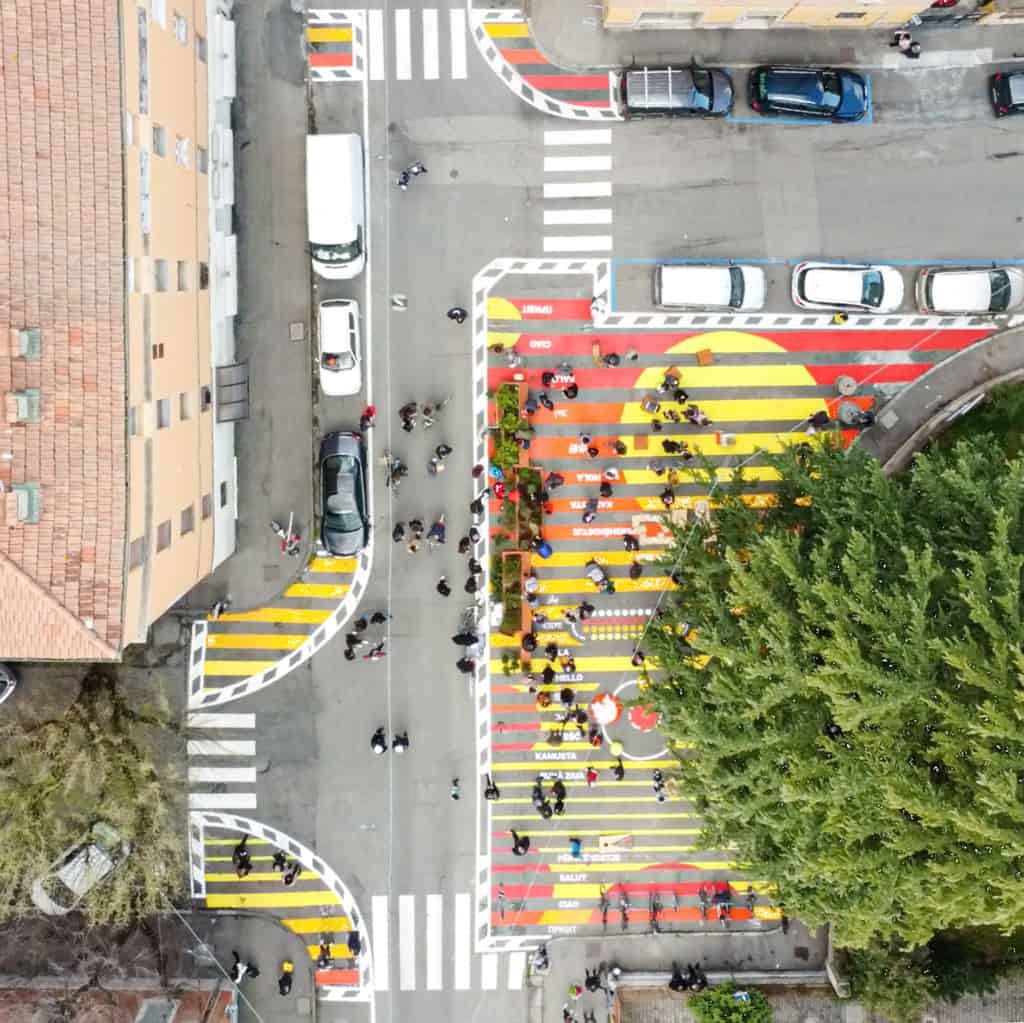
The intervention under examination consisted of a reconversion of an unregulated parking space located in Via Camillo Procaccini in the neighborhood of Bolognina into a square tailor-made for middle school students. 300 square meters have been pedestrianized, equipped with street furniture and highlighted through colorful paint. The aim of the project to which the intervention belongs is to ensure young students augmented safety and autonomy in their home-school-home journeys and to provide a space for socializing and waiting together before the school opens. It was implemented in March 2022 after 3 weeks of works and inaugurated on April 2nd, 2022: according to tactical urbanism principles, it lasted approximately 12 months, during which pedestrian and vehicular flow patterns were monitored on a micro scale via video analytics backed by machine learning techniques (Ceccarelli et al. 2023), providing temporal and spatial analyses of recorded data in order to support the iterative design process typical of tactical urbanism approach by assessing if the intervention had reached expected goals and defining a permanent configuration after the experiment.
This current study aimed at widening the assessment perspective from punctual observations at the intervention spot to a larger buffer area surrounding the temporary school square, focusing on vehicular traffic variations at neighborhood scale. To that end, via a GPS-based dataset containing aggregate traffic information for peak daily time slots, private car mobility trends will be analyzed at macro scale via different clustering of road segments, comparing data from before and after the implementation of the square. Then, data will be elaborated to obtain OD matrices which, once fed to a microsimulation software in a future step of this research, will serve as inputs for further assessments on streets and intersections in the neighborhood.
Enabling Data and Methodology
Enabling Data
Available datasets for this study have been provided by TomTom International BV through Traffic Stats, consisting of aggregate information on traffic flow, speed and travel time on the links of the selected network. The query to TomTom servers asked for the following data:
- periods of time:
- September and October 2021 (ex-ante)
- September and October 2022 (ex-post)
- date ranges: weekdays (Mondays to Fridays) – weekends (Saturdays, Sundays)
- daily time slots: 3 two-hour slots split into 15-minute fractions
- 7:00 – 9:00 AM;1:00 – 3:00 PM;
- 5:00 – 7:00 PM;
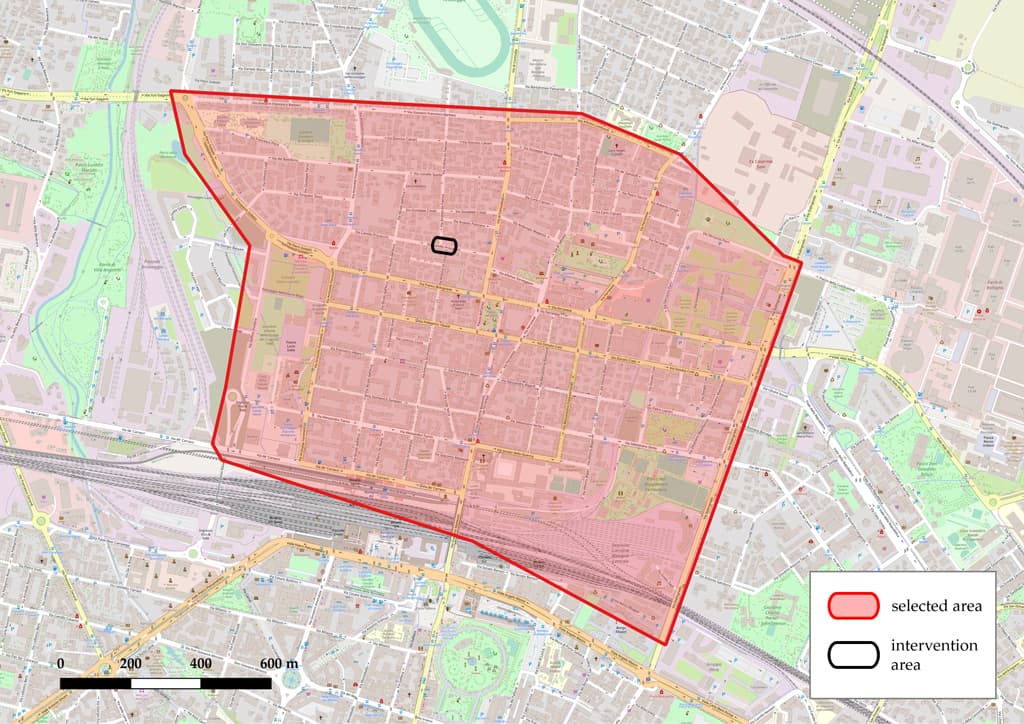
- area: Bolognina district, Bologna (see Figure 2);
- Functional Road Classes: 1 to 6 (see detailed description here).
Statistical trend analysis
The goal of this first step was to analyze the requested datasets under a macroscopic point of view on the whole network before and then by clusters identified by proper attributes of road segments, in order to detect the magnitude of variations (if there were any) in traffic-related parameters such as sample sizes or speed-related values.
First, to assess significant differences between distinct clusters of available data, a set of two-tailed paired Student’s t-tests was performed. At this early stage of the study, comparisons intended to assess first whether sampled data are a good representation of a real and coherent traffic situation, by evaluating consistent differences between values of speed and sample size recorded for different date ranges (weekdays vs. weekends) and for different FCRs, and then to extend this assessment between values retrieved for ex-ante and ex-post traffic conditions.
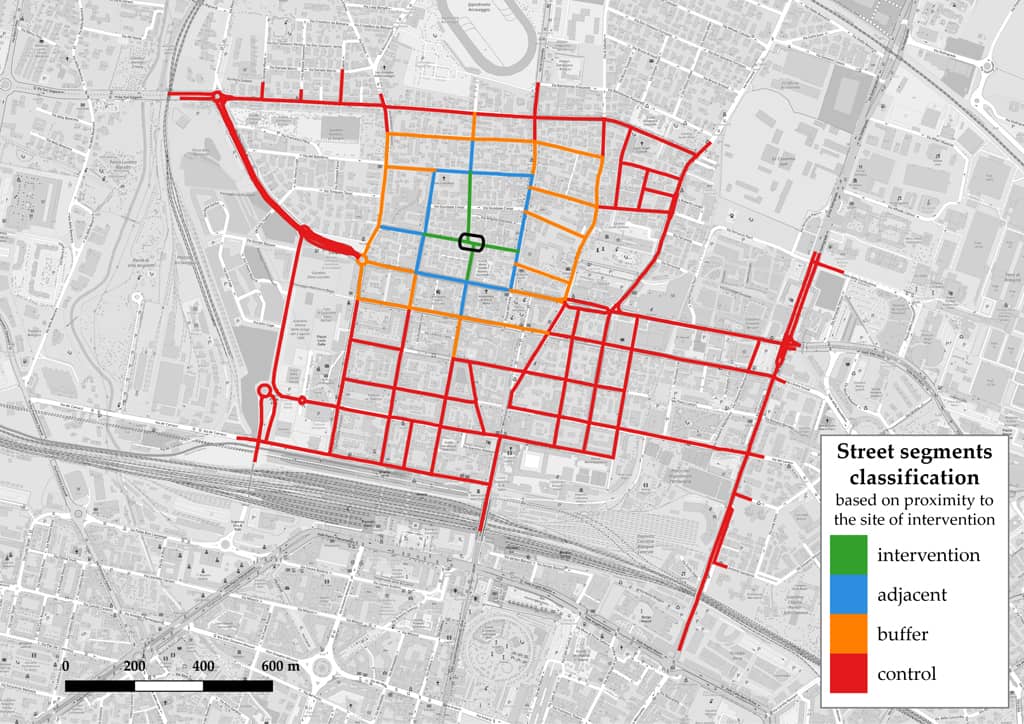
Once data have been statistically validated, trend analyses were carried out to detect any variations in sample sizes and speed-related values between ex-ante and ex-post scenarios, assessing how much traffic volumes have decreased (or increased) and where on the network, if vehicles travel faster or slower after the intervention, and on which type of streets, by simply comparing corresponding traffic-related parameters. In order to do so, an additional classification of segments was established. According to Nello-Deakin (2022), roads in the network were clustered on the basis of their proximity to the site of intervention (see Figure 3). In particular:
- the intervention streets are segments directly interested by the modification;
- adjacent streets are close to the intervention and represent the best alternatives to avoid the site of intervention;
- streets in the buffer area are no farther than 400 meters on road graph distance and so are thought to still be impacted from disturbances caused by the implementation of the temporary school square;
- all the other roads in the network are classified as control segments, on which global variations of traffic-related parameters will be computed and assumed for the entire network, in order to adjust fluctuations of the other segment clusters and focus on the effects of the intervention.
OD matrix estimation procedure
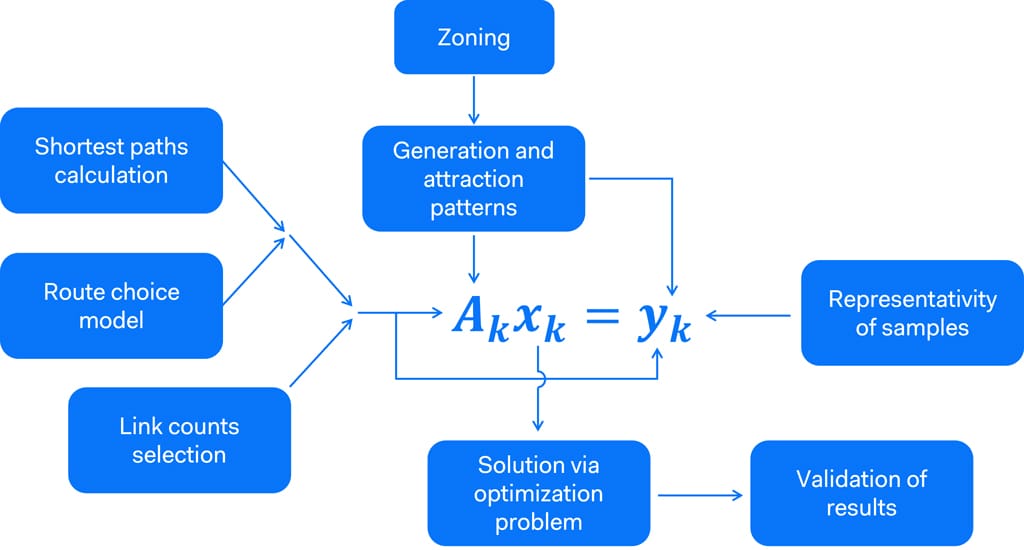
The aim of this step was to estimate Origin-Destination matrices which fit the supply patterns extracted from the dataset with the same granularity of available data (one every 15 minutes), using a simplified version of the one proposed in Krishnakumari et al. (2020). In this paper, the researchers presented an algorithm that allows to obtain OD matrices from 3D link supply patterns, intended as values of speed as well as the key figure of transiting vehicles over each time fraction. The algorithm intends to bypass the usual iterative loading of the road network until convergence. It is fundamentally based on the assumptions of cutting off the number of possible shortest paths per OD pair and of attributing a proportional share of the whole pair flow to each path in the previously selected set according to a Path Size Logit (PSL) model using observed travel times as key explanatory variable.
In order to exploit and elaborate available data, a script in R environment was developed, implementing a version of the proposed algorithm adapted to the case under examination.
The workflow in Figure 4 was applied for every time fraction k, for both ex-ante and ex-post scenarios. The first step was defining a layout of generating and attracting zones valid for every time fraction: according to the size of the network, zones were identified with access and exit nodes of the selected road network, so generation and attraction flow patterns were set equal to traffic flows in correspondence of such nodes. After enlarging sample sizes through expansion coefficients calculated on the basis of a comparison between flows detected in Ceccarelli et al. (2023) and flows in the available datasets, weekends data were excluded from the analysis due to inconsistent correlation between the two sets of traffic data. Then, a set of 4 shortest paths was calculated for each OD pair through Yen’s algorithm (Yen, 1971), using Dikjstra’s as base algorithm for shortest path calculation; to attribute route choice proportionality to each path in the set, a Path Size Logit (PSL) model was employed, with observed travel time only as explanatory variable. Since traffic counts might suffer from data inconsistency and data dependence, a criterion to select link traffic counts to calibrate models was proposed, based on information retrieved in literature (Ortúzar & Willesden, 2011; Espitia Echeverría, 2018; Yang & Zhou, 1998). Eventually, equation systems were solved through least squares optimization problems and resulting OD pair flows were validated by establishing linear regressions between estimated and observed link flows and analyzing goodness-of-fit measures such as R2 and, in case of “bad-performing” correlations, also Theil’s inequality coefficient U together with its proportions.
Results
Statistical trend analysis
In the first place, t-tests performed comparing datasets by date ranges (weekdays and weekends) and groups of Functional Road Classes (FRC 2-3 and FRC 4-6) returned overall p-values under the probabilistic significance level α = 0.001, so demonstrating that datasets presented significant differences to be evaluated through trend analyses.
In order to assess variations in traffic flow values, the investigated parameter was sample size adapted to actual values through expansion coefficients to represent real traffic flow, averaged over the entire cluster.
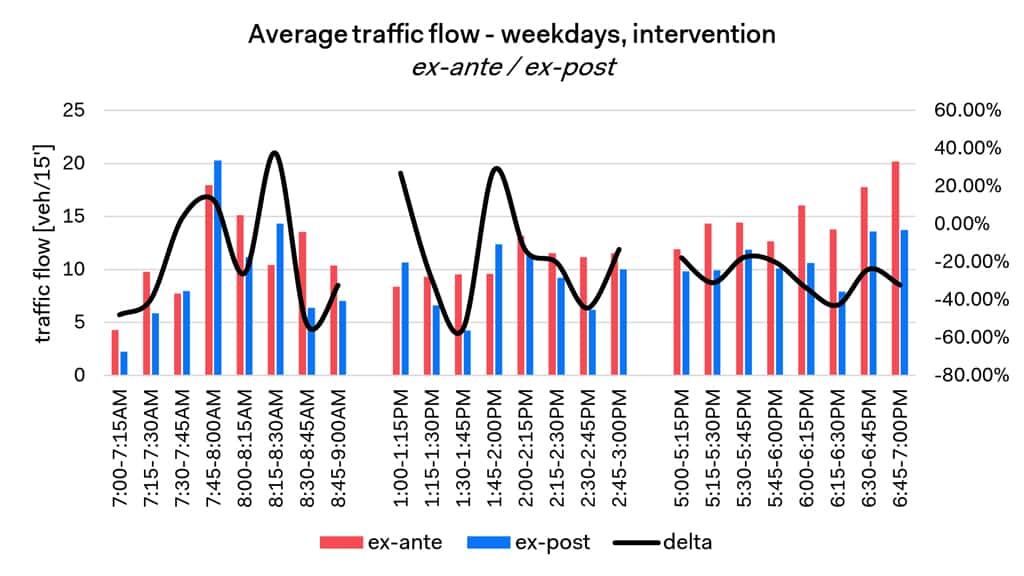
In Chart 1, average traffic flow data on intervention streets for weekdays are presented, suggesting despite the sharp peaks in delta curves (because of high susceptibility due to little flows) a considerable decrease after the implementation of the square.
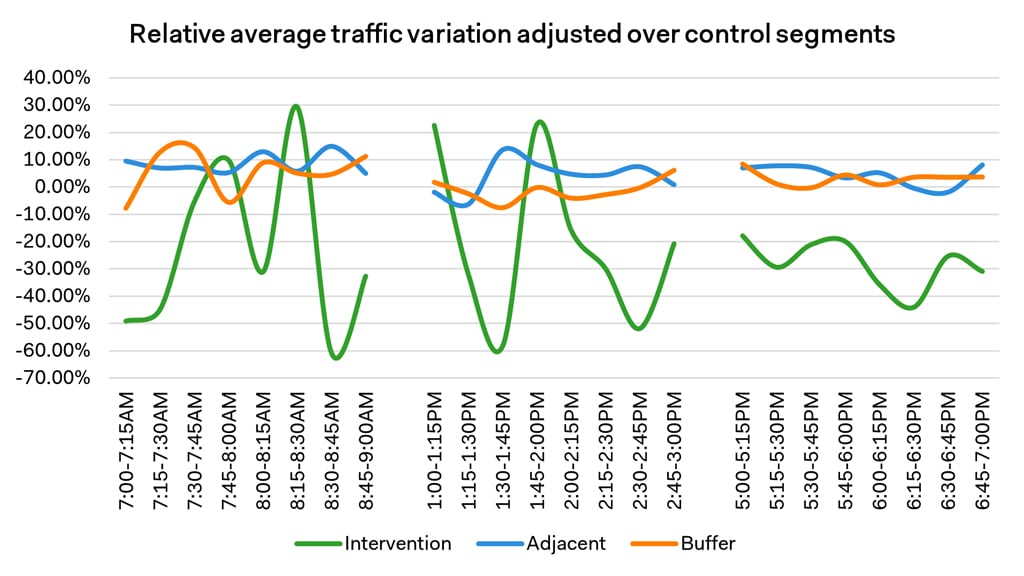
Expectations would suggest that also in adjacent or buffer segments traffic flows would decrease (traffic evaporation), but data presented a different outcome. Of course, traffic levels in a neighborhood may have changed because of other factors than the temporary school square implementation within a whole year. In order to understand if and how traffic patterns have changed because of the intervention, in Chart 2 the idea was to adjust buffer classes variations over control segments fluctuations, with the aim of cancelling the noise sourced from other events that may have affected other zones of the selected road network. Adjusted relative variations have been computed as the difference between delta values of the buffer classes and the ones for the control class in the same time fraction k.
Average indexes of traffic flow variation (see Table 1) consist of mean values per time slot of relative fluctuations for average traffic flows:
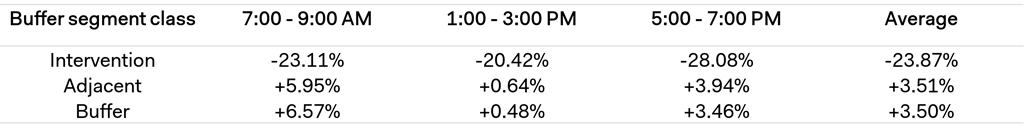
These figures suggest that the implementation of the new temporary school square moved traffic patterns from the intervention area to alternative paths which deviate from the former most convenient routes using adjacent streets. Thus, the phenomenon of traffic evaporation, encountered in other, more extensive street experiments (Nello-Deakin, 2022), did not occur here, pointing out that in the case under examination a punctual tactical urbanism could be disruptive to traffic patterns, even if slightly, but may not succeed in diminishing traffic flow in the neighborhood network.
GIS-generated maps below representing relative variation in traffic flows confirm what commented earlier about the relocation of traffic patterns from segments directly affected by the intervention to adjacent and buffer streets. It is to underline once again that, in spite of a quite consistent relative reduction in intervention streets, highlighted in the maps through stronger warm colors, surrounding segments have recorded a relatively slight increase in traffic flow, simple because of already considerable traffic flows interesting such segments.
Referring to absolute variation maps elaborated through GIS and supported by global indexes (see Table 1), a clear difference in vehicular patterns emerges focusing on the surroundings of the new temporary square:
- intervention segments have recorded a slight negative variation in every ad-dressed time slot;
- adjoining and neighboring segments such as the major axis which accesses the neighborhood from its northern side, or core axes for the east-west through-traffic phenomenon, figuring either in the adjacent or buffer class, have been affected by an appreciable increase in traffic flow.


OD matrix estimation
Following the choice of cutting off the number of possible paths between OD pairs into 4 most convenient routes in terms of travel times, nearly the majority of equation systems used in the algorithm resulted slightly underdetermined, with only a couple of exceptions of full-rank conditions. In a few cases, the number of equations dropped under the threshold of 70; however, this seems not to have affected the results in terms of correlation between estimations and observed flows.
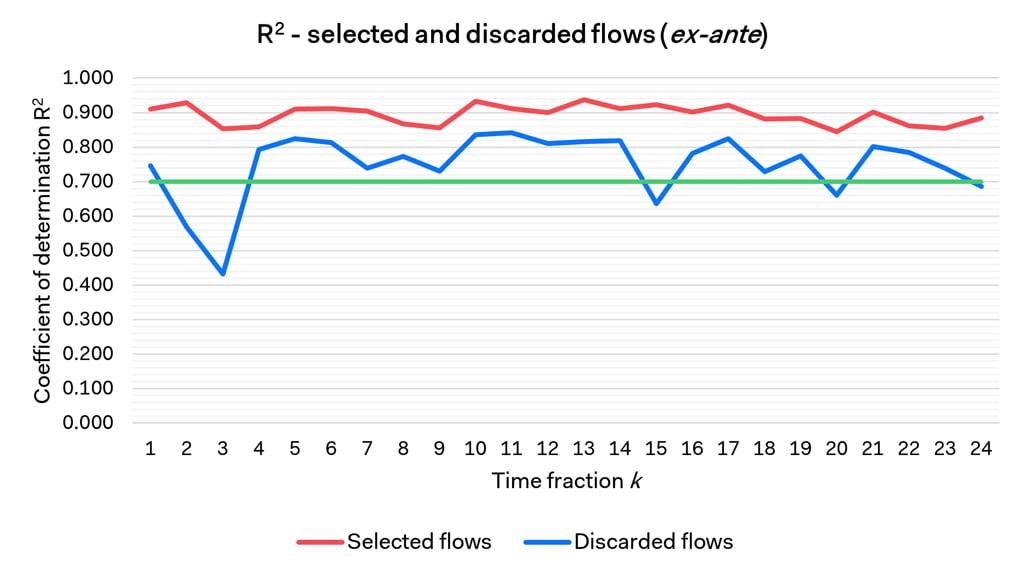
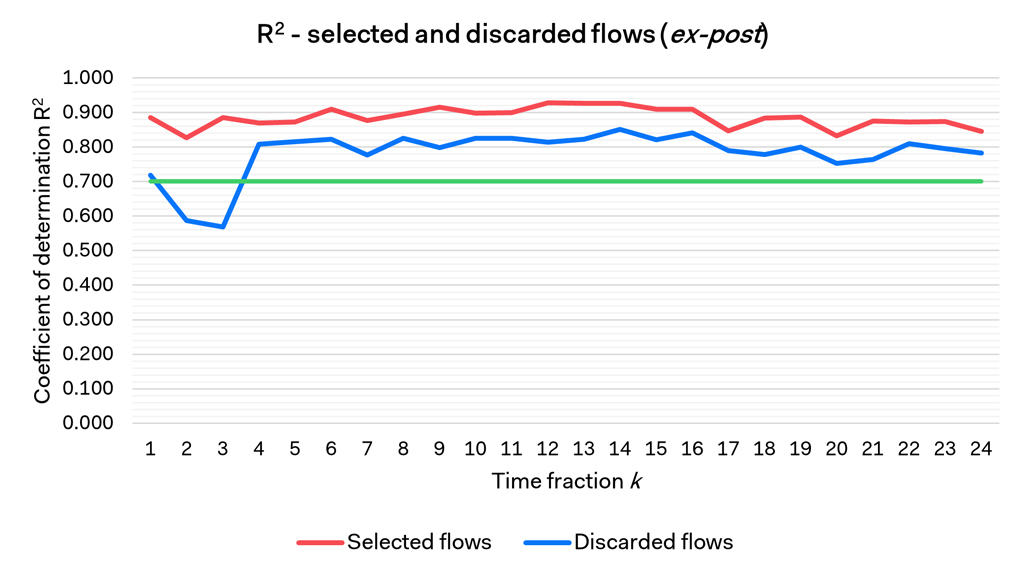
OD matrices for each 15-minute fraction k were extracted through the optimization problem which minimizes the norm of the difference vector between estimated and observed link flows. Linear regressions between observations and estimations were established in two separate sets, the first consisting of flows selected to take part in the coefficient matrix Ak, the second containing discarded flows used for the validation of the method. Hence, it was possible to compute coefficients of determination R2 for each linear regression and to evaluate the accuracy of the estimation process.
From the coefficients of determination calculated (see Charts 3 and 4), correlation between estimated and observed values of link flows was defined as strong, since R2 > 0.7 in every regression for selected flows and almost any correlation for validating the model through discarded flows.
For each of the “bad performing” correlations (R2 < 0.7), Theil’s inequality coefficient was computed, and later decomposed into its three indicators which should be able to explain (or at least exclude) which could have been the problem.
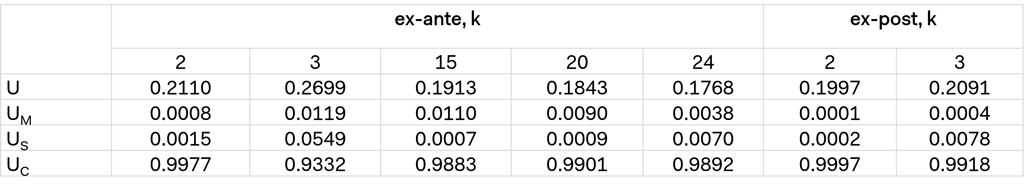
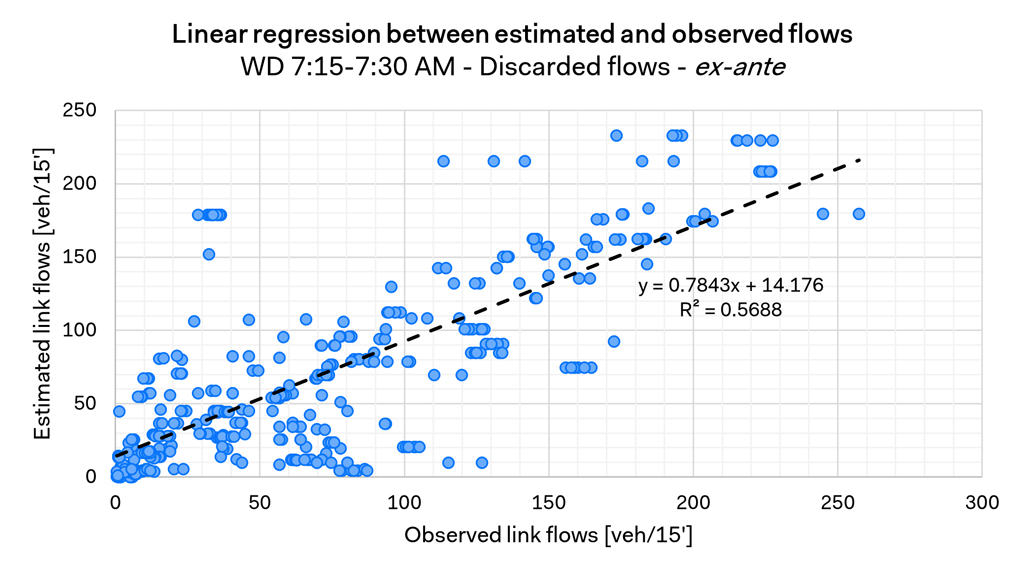
From the reported values, regressions featuring lower R2, and for this reason addressed here, present values of U close to the threshold of 0.2. By checking inequality proportions values, it seems that no issue is encountered relatively to systematic errors or variability, since the inequality proportions relative to bias and variance stick to small values, certifying the quality of the prediction. Since these statistics do not directly address the effect of outliers, through a qualitative check on linear regression scatterplots (see Chart 5) it was possible to highlight considerable incidence of isolated points (actually streams of points, due to the fragmentation of the underlying road graph). Such streams of points are thought to represent the major problem in linear regressions featuring a low coefficient of determination R2.
Conclusions and Future Work
This work aimed at assessing the effects on private vehicular patterns in the neighborhood of Bolognina, in the city of Bologna, following the implementation in March 2022 of a temporary square dedicated to young students in via Camillo Procaccini, under the principles of tactical urbanism approach. It made use of TomTom Floating Car Data collected over the months of September and October 2021 (before the intervention, ex-ante) and 2022 (after the intervention, ex-post), consisting of traffic counts, average speed values and travel times for each segment of the selected road network over three daily time slots and per time fractions of 15 minutes.
After validating datasets and data clustering through hypothesis tests on statistical significance, trend analyses showed that traffic flows experienced a slight global increase within a year. More in detail, under the classification of segments in accordance with graph distance from the intervention site, streets directly interested by the intervention recorded a considerable decrease (-23.87%), with adjacent streets and segments suffering a more contained but positive increase (+3.51% and +3.50%, respectively). This suggested that the phenomenon of traffic evaporation observed in findings related to more widespread implementations of tactical urbanism interventions did not occur at the neighborhood level in this situation, which instead exhibited a more impacting traffic flow relocation on alternative paths.
On the whole, extraction of OD matrices per 15-minute time fractions through data-driven procedures returned reliable results, which have been validated through coefficients of determination for regressions between observed and estimated link flows, also thanks to the large availability of data discarded from the equation system construction due to data dependence. Nonetheless, despite the big number of observations, almost every equation system adopted to extract matrices resulted, even if slightly, underdetermined: this is because many observations were dependent on the others, due to high fragmentation of the segments in the network (each one with their own supply pattern of traffic-related information), to the grid layout of the road network and to the cut-off of the number of possible paths per OD pair.
Future developments of this work could include:
- microsimulations of the road network exploiting as demand inputs the extracted OD matrices through the implementation of traditional traffic models, both as further validation of the extracting procedure and as a more thorough assessment of the impact the tactical urbanism intervention had on the private mobility patterns via extraction of traffic-related metrics (queue lengths at intersections, Level of Service);
- vehicular network performance-based evaluation of further developments of the design of the temporary school square with the already retrieved input data;
- a standardization of the trend analyses procedure, aimed at collecting data from other similar road interventions and organizing results based for instance on road graph distance or hierarchy of segments on the graph, in order to build a solid reference database designed to advise in the decision-making process;
- an improvement of the adopted procedure for the estimation of OD matrices through harmonization of the road graph and segments attributes in order to overcome issues such as encountered outliers or considerable data inconsistency;
- consequently, a standardization of the process aimed at automatizing the extraction of OD flows independently from network size and layout.
The results of this research have been presented at the 51st European Transport Conference – ETC 2023 (6-8 September, 2023, Milan, Italy). The results of this research have been published in the following scientific Journals: Pozzoni, M., Ceccarelli, G., Gorrini, A., Manenti, L., Sanfilippo, L. (2023). TomTom Data Applications for the Assessment of Tactical Urbanism Interventions: The Case of Bologna. Sustainability, 15, 12716. https://doi.org/10.3390/su151712716
Acknowledgments
The research work has been carried out in collaboration with Marco Pozzoni, as part of his M.Sc. in Civil Engineering – Transport Infrastructures at the Politecnico di Milano (Milan, Italy). We thank citiEU Consultancy LTD for their fruitful collaboration and for sharing data. The analyzed data were treated according to the GDPR-General Data Protection Regulation (EU, 2016/679). This research received no specific grant from any funding agency in the public, commercial, or not-for-profit sectors.
References
Bertolini, L. (2020). From “streets for traffic” to “streets for people”: can street experiments transform urban mobility?. Transport Reviews, 40(6), 1–20. https://doi.org/10.1080/01441647.2020.1761907
Bonnel, P., Fekih, M., & Smoreda, Z. (2018). Origin-Destination estimation using mobile network probe data. Transportation Research Procedia, 32, 69–81. https://doi.org/10.1016/j.trpro.2018.10.013
Cairns, S., Atkins, S., & Goodwin, P. (2002). Disappearing traffic? The story so far. Proceedings of the Institution of Civil Engineers – Municipal Engineer, 151(1), 13–22. https://doi.org/10.1680/muen.2002.151.1.13
Cariello, A., Ferorelli, R., & Rotondo, F. (2021). Tactical Urbanism in Italy: From Grassroots to Institutional Tool – Assessing Value of Public Space Experiments. Sustainability, 13(20), 11482. https://doi.org/10.3390/su132011482
Ceccarelli, G., Messa, F., Gorrini, A., Presicce, D., Choubassi, R. (2023, submitted). Deep Learning Analytics for Pre-post Evaluation of Tactical Urbanism Interventions: The Case of Bologna. Journal of Public Space.
Croce, A. I., Musolino, G., Rindone, C., & Vitetta, A. (2021). Estimation of Travel Demand Models with Limited Information: Floating Car Data for Parameters’ Calibration. Sustainability, 13(16), 8838. https://doi.org/10.3390/su13168838
D’Andrea, E., & Marcelloni, F. (2017). Detection of traffic congestion and incidents from GPS trace analysis. Expert Systems with Applications, 73, 43–56. https://doi.org/10.1016/j.eswa.2016.12.018
Demissie, M. G., & Kattan, L. (2022). Estimation of truck origin-destination flows using GPS data. Transportation Research Part E: Logistics and Transportation Review, 159, 102621. https://doi.org/10.1016/j.tre.2022.102621
Deng, B., Denman, S., Vassilis Zachariadis, & Jin, Y. (2015). Estimating traffic delays and network speeds from low-frequency GPS taxis traces for urban transport modelling. European Journal of Transport and Infrastructure Research, 15(4). https://doi.org/10.18757/ejtir.2015.15.4.3102
Espitia Echeverría, E. A. (2018). Analisi dell’influenza della localizzazione di sensori di rilevamento di traffico nell’aggiornamento di matrici OD – caso di studio: Torino. Master’s thesis, Politecnico di Milano.
Fekih, M., Bellemans, T., Smoreda, Z., Bonnel, P., Furno, A., & Galland, S. (2021). A data-driven approach for origin–destination matrix construction from cellular network signalling data: a case study of Lyon region (France). Transportation, 48(4), 1671–1702. https://doi.org/10.1007/s11116-020-10108-w
Global Design Cities Initiative. How to Implement Street Transformations. A Focus on Pop-up and Interim Road Safety Projects. Available online: https://globaldesigningcities.org/publication/how-to-implement-street-transformations (accessed on 29 June 2023)
Krishnakumari, P., van Lint, H., Djukic, T., & Cats, O. (2020). A data driven method for OD matrix estimation. Transportation Research Part C: Emerging Technologies, 113, 38–56. https://doi.org/10.1016/j.trc.2019.05.014
Necula, E. (2015). Analyzing Traffic Patterns on Street Segments Based on GPS Data Using R. Transportation Research Procedia, 10, 276–285. https://doi.org/10.1016/j.trpro.2015.09.077
Nello-Deakin, S. (2022). Exploring traffic evaporation: Findings from tactical urbanism interventions in Barcelona. Case Studies on Transport Policy, 10(4), 2430–2442. https://doi.org/10.1016/j.cstp.2022.11.003
Ortúzar, J., & Willumsen, L. (2011). Modelling Transport (4th). United Kingdom: John Wiley & Sons.
United Nations (2016). Transforming Our World: The 2030 Agenda for Sustainable Development. United Nations. Available at: https://sustainabledevelopment.un.org/post2015/transformingourworld/publication
Yang, H., & Zhou, J. (1998). Optimal traffic counting locations for origin–destination matrix estimation. Transportation Research Part B: Methodological, 32(2), 109–126. https://doi.org/10.1016/s0191-2615(97)00016-7
Yassin, H. H. (2019). Livable city: An approach to pedestrianization through tactical urbanism. Alexandria Engineering Journal, 58(1), 251–259. https://doi.org/10.1016/j.aej.2019.02.005
Yen, J. Y. (1971). Finding the K Shortest Loopless Paths in a Network. Management Science, 17(11), 712–716. https://doi.org/10.1287/mnsc.17.11.712