: Prioritizing the Implementation Through a Multicriteria Analysis")
Rome aims to increase cycling levels and its cycling infrastructure. The Grande Raccordo Anulare delle Bici (GRAB) is a planned 48.300 km cycle route. This investigation used a multicriteria analysis to evaluate the six implementation sections of the GRAB against four criteria (i.e., cycle demand, network connectivity, urban accessibility, cycle safety) that were operationalized through twelve indicators to suggest how to prioritize the implementation order. The results suggest a clear preference for which section should be implemented first and last, however the order of the remaining sections is impacted by prioritization.
Introduction
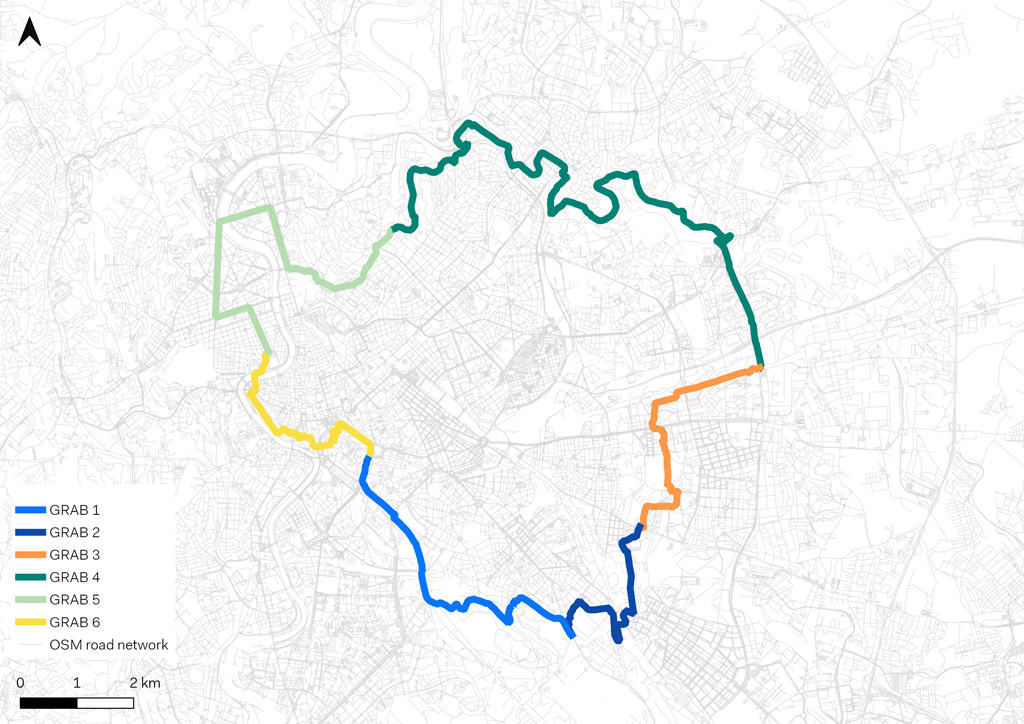
Rome is prioritizing cycling as a form of transportation, in accordance with national and European Union objectives, given its many environmental, health, and economic benefits (Department of Mobility and Transportation Roma Capitale, 2017; European Commission, 2023; WHO Regional Office for Europe, 2022). The Grande Raccordo Anulare delle Bici (GRAB) is a 48.300 km cycle route that will connect significant cultural, historical, touristic sites and green spaces(see Figure 1). The GRAB is intended to help Rome achieve its sustainable mobility objectives by expanding the cycling network, improving connections with the public transportation network, increasing urban accessibility, facilitating 10-minute neighborhoods, and promoting sustainable, “slow” tourism (Caravaggi, et al., 2022; Roma Servizi per la Mobilità, 2021).
Enabling Data and Methodology
Multicriteria Analysis
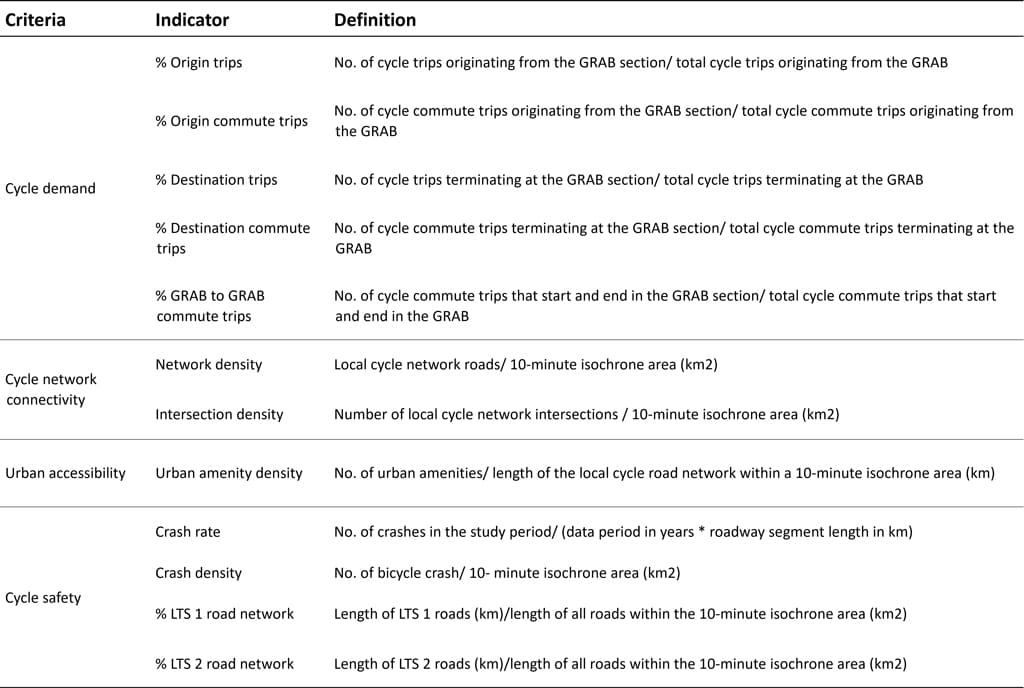
The implementation prioritization ranking of each GRAB section was determined using a multicriteria analysis. The Elimination and Choice Translating Reality III (ELECTRE III) methodology was selected for its ability to rank options, incorporate decision-makers’ preferences through criteria weights and indifference and preference thresholds, and compare criteria of different scales (Govindan & Jepsen, 2016). Four criteria were selected based on their relevance to the GRAB’s policy objectives and operationality and were operationalized through twelve indicators (see Table 1). Four scenarios using different criteria weights were run to assess sensitivity of the rankings to different priorities.
The evaluation criteria
The Cycle Demand criterion aimed to evaluate the cycling potential of each GRAB section from current cycling patterns. The indicators were based on annual origin and destination (OD) cycling data for 2022 obtained from Strava Metro (Strava, n.d.). The indicators included the share of trips that started or ended within the H3 cells that intersected with each GRAB section, as well as the share of GRAB-to-GRAB commute trips within each section (see Table 1). The latter indicator was calculated by pairing OD commute data to generate desire lines, weighted by the number of trips.
The cycle network connectivity, urban accessibility, and cycle safety criteria required estimating the local cycle network, i.e. all roads that people might cycle on. It was created by applying Wasserman’s Level of Traffic Stress (LTS) methodology (adapted to account for road slope, local road regulations, and planned sustainable infrastructure projects). Roads were classified into four levels according to how stressful they are to cycle on based on certain road characteristics (Mekuria, et al., 2012; Wasserman, et al., 2019). The LTS analysis was applied to the Open Street Map (OSM) road network for Rome. The local cycle network was defined as the roads classified as LTS level 1 and 2.
The Network Connectivity criterion aimed to measure the size of the local cycle network that is connected and directly accessible from each GRAB section. It was selected because a well-connected cycle network is fundamental for increasing cycling levels and urban accessibility. It was operationalized through 2 indicators- network density and intersection density (see Table 1). Isochrone and service area analyses were run on the local cycle network to determine the extent of the connected network that could be reached in 10 minutes by bicycle.
The Urban Accessibility criterion captured how many public transportation, schools, public libraries, leisure facilities, healthcare facilities, tourist attractions, sport facilities, and administrative service buildings could be reached in 10 minutes by bicycle from each GRAB section. It was selected to better understand each section’s potential to spur the development of 10-minute neighborhoods. The indicator, urban amenity density, was calculated using amenities extracted from Rome’s open data portal and OSM (see Table 1). Amenities within 100m were snapped to the local cycle network generated from the LTS, isochrone, and service area analyses.
The Cycle Safety criterion captured how dangerous it is to cycle on each GRAB section and its surrounding area. It was selected because Rome is trying to reduce death and injury from road accidents (Roma Servizi per la Mobilità, 2017). The cycle safety indicators (see Table 1) were calculated using georeferenced bicycle crash data collected by the local police from January 2018 to August 2022 from Rome’s open data portal. Bicycle accidents were mapped onto the proposed GRAB route and the local cycle network. An isochrone analysis was conducted on the entire road network to determine the area used for calculating the bicycle crash density and share of safe roads (LTS 1 and 2) within 10 minutes of each GRAB section.
Results
Cycle Demand
Figures 2, 3 show the origin or destination trip density of each H3 cell that intersects with the GRAB route by section. The darker the red corresponds to a higher trip density. It highlights that most trips originated and terminated in GRAB sections 4, 5, and 6- regardless of trip type (leisure and/or commute). Figure 4 shows the weighted commute desire lines, it reveals that the most trafficked origin and destination pairs are in sections 4 and 6.


Figure 2 Origin cycle trip density by GRAB section, 2022. Figure 3 Destination cycle trip density by GRAB section, 2022. Figure 4 Weighted GRAB to GRAB commute desire lines.
Cycle Network Connectivity
Figures 5 and 6 show the local cycle network (dark gray) that is connected and directly accessible from the GRAB section within a 10-minute isochrone area (delineated by the dashed colored line). The analysis of network and intersection density found that section 6 had the greatest (see Figure 5) and section 4 (see Figure 6) had the lowest densities for both indicators. In general, the size of the local cycle network is influenced by the presence of environmental islands and green spaces.


Figure 5 GRAB section 6 local cycle network density. Figure 6 GRAB section 4 local cycle network density.
Urban Accessibility
Figures 7 and 8 show the urban amenities on the local cycle network (dark gray) that is connected and directly accessible from the GRAB section within a 10-minute travel time (area delineated by the dashed colored line). Different color points correspond to different types of amenities (e.g., tram stops). Section 6 had the highest density of urban amenities (see Figure 7) and section 4 had the lowest (see Figure 8). Leisure amenities were the most common type of urban amenity found across all GRAB sections.


Figure 7 GRAB section 6 urban amenity density. Figure 8 GRAB section 4 urban amenity density.
Cycle Safety
Figure 9 shows the bicycle crashes (red points) that occurred on each GRAB section between 2018 and 2022 and it illustrates that section 5 had the highest crash rate and section 4 had the lowest crash rate. Figures 10 and 11 show the bicycle crashes that occurred on the road network within a 10-minute travel time (area delineated by the dashed colored line) of the GRAB section. Section 6 had the highest crash density (see Figure 10) and section 4 had the lowest (see Figure 11). Figures 12 and 13 show the LTS 1 (green lines) and 2 (yellow lines) roads that are found within the 10-minute isochrone area of the respective GRAB section. It shows that section 6 has the highest share of low stress roads for cyclists, over 65% of the road network is classified as safe for cycling (see Figure 12). Conversely, section 4 has the lowest share- less than 40% of its road network is considered safe for cycling (see Figure 13).


Figure 9 Bicycle crashes on the GRAB, 2018-2022. Figure 10 GRAB section 6 bicycle crash density. Figure 11 GRAB section 4 bicycle crash density. Figure 12 GRAB section 6 LTS 1 and 2 roads. Figure 13 GRAB section 4 LTS 1 and 2 roads.
GRAB section rankings
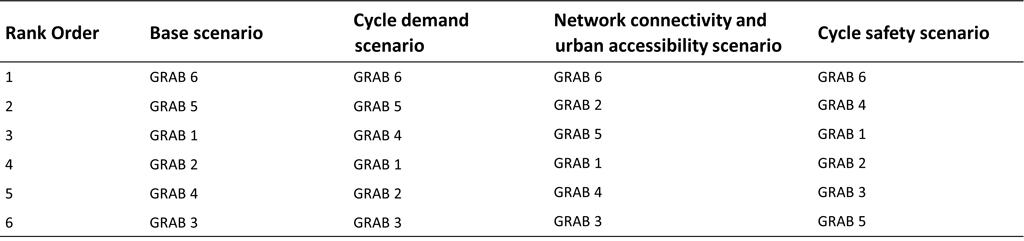
Table 2 shows the implementation order of the sections in the four scenarios run. The results indicate that overall section 6 should be prioritized for implementation first and section 3 last, however the ranking orders of the other sections were affected when priorities are changed (see Table 2). For example, when cycle safety was weighted more, the rank order of section 4, which had the lowest crash rate and crash density, was the highest compared to all other scenarios.
Conclusions and Future Works
An objective methodology is key for decision-makers to effectively implement the GRAB – especially given its strict implementation timeline. Deciding which section should be built first is critical because it has the potential to build momentum for the rest of the project. This investigation provides a comprehensive and robust approach to decision-making that incorporates the GRAB’s policy objectives and considers the local road regulations and other planned sustainable infrastructure projects in Rome.
The main limitations of this investigation were the lack of data and the lack of involvement from actual decision-makers. The definition of the local cycle network could be improved if better road network data were available, and estimating cycling potential would be improved with representative cycle trip data. Consultations with decision makers and stakeholders would strengthen the criteria and indicator selection as well as the criteria weights and threshold inputs. The availability of higher quality data would allow decision-makers’ preferences to be more accurately expressed. If policymakers aim to increase cycling levels and evaluate the impacts of cycling infrastructure projects, greater investments in collecting, standardizing, and providing open access to high-quality data is needed. A complex and ambitious infrastructure project such as the GRAB demands practical evidence- based decision-making to ensure that residents and tourists can take advantage of its many benefits.
Acknowledgments
The research work has been carried out in collaboration with Simone Fukuda, as part of her M.Sc. in Territorial, Urban, Environmental and Landscape Planning at the Politecnico di Torino (Turin, Italy). We thank Prof. Pronello (Department of Regional & Urban Studies and Planning, Politecnico di Torino) for her contribution to this research. The analyzed data were treated according to the GDPR-General Data Protection Regulation (EU, 2016/679). This research received no specific grant from any funding agency in the public, commercial, or not-for-profit sectors.
References
Caravaggi, L., Imbroglini, C., & Lei, A. (2022). Rome’s GRAB—Great Bicycle Ring Route—As Complex Landscape Infrastructure. Sustainability, Vol. 14, Page 1023, 14(2), 1023. https://doi.org/10.3390/su14021023
Department of Mobility and Transportation Roma Capitale. (2017). Roma-Piano Urbano della Mobilità Sostenibile Documento PUMS-Volume 1 Quadro conoscitivo ed obiettivi (Vol. 1). Accessed March 17, 2023. Available at: https://www.comune.roma.it/web-resources/cms/documents/PUMS_roma_vol1.pdf
European Commission. (2023). European Declaration on Cycling. Accessed December 3, 2023. Available at: https://transport.ec.europa.eu/system/files/2023-11/European_Declaration_on_Cycling_text.pdf
Govindan, K., & Jepsen, M. B. (2016). ELECTRE: A comprehensive literature review on methodologies and applications. European Journal of Operational Research, 250(1), 1–29. https://doi.org/10.1016/j.ejor.2015.07.019
Mekuria, M. C., Furth, P. G., & Nixon, H. (2012). Low-Stress Bicycling and Bike Network Connectivity. Mineta Transportation Institute. Accessed April 29, 2023. Available at: https://transweb.sjsu.edu/sites/default/files/1005-low-stress-bicycling-network-connectivity.pdf
Metro, S. (n.d.). Strava Metro Dashboard. Accessed March 10,2023. Retrieved from: https://metroview.strava.com/
Roma Servizi per la Mobilità. (2017). Programme straordinario per la sicurezza stradale “Vision zero.” Accessed November 3, 2023. Available at: https://romamobilita.it/sites/default/files/PROGRAMMA STRAORDINARIO_Terza Parte.pdf
Roma Servizi per la Mobilità. (2021). I cantieri del GRAB Laboratori Territoriali, Documento finale di partecipazione. Accessed March 8, 2023. Available at: https://romamobilita.it/sites/default/files/GRAB_Doc_Cantieri_0.pdf
Torrioli, M. (2023, December 20). Il Grab si farà, primi interventi nell’area del Colosseo. I tempi però stringono. Roma Today. Accessed December 23, 2023. Retrieved from: https://www.romatoday.it/attualita/roma-grab-lavori-colosseo.html
Wasserman, D., Rixey, A., Zhou, X. (Elynor), Levitt, D., & Benjamin, M. (2019). Evaluating OpenStreetMap’s Performance Potential for Level of Traffic Stress Analysis. Transportation Research Record, 2673(4), 284–294. https://doi.org/10.1177/0361198119836772
WHO Regional Office for Europe. (2022). Walking and cycling: latest evidence to support policy-making and practice. World Health Organization. Accessed November 2, 2023. Available at: https://www.who.int/europe/publications/i/item/9789289057882, ISBN: 9789289057882