
The 15-minute city idea is founded on a radical approach to urban planning that revaluates the neighbourhood scale and prioritizes accessibility to daily services on the basis of walking and cycling. It is essentially a rights-based model promoting hyper-proximity as a vision for an equitable, viable and liveable urban system centralized around walking. In the following analysis, we utilize the chrono-centric ‘15-minute’ framework to evaluate the spatial distribution of walkable neighbourhoods across the city of Milan, Italy. Experimenting with a multi-level spatial analysis using heat maps, we propose a population-driven narrative of the walkable city.
Introduction
Across the world, lockdown measures introduced at the start of the pandemic aimed to drastically restrict people’s movements to the most essential shortest trips from one’s place of residence. In Milan, as in other cities, there were ordinances that prevented inhabitants from traveling beyond their domiciled neighbourhood and effectively reduced trip purposes to essential trips such as grocery shopping and pharmacy stops. Far from the stringent early lockdown urban experiences, cities today have returned nearly to their 100% potential and inhabitants are generally allowed to roam freely within the city provided that they follow certain health requirements as mandated at the state level.
Despite the major recovery of many urban mobility trends to pre-pandemic states in many parts of the world, the legacy of the lockdown state of near-immobility remains. For many reasons, this interim phase has provoked questions about our collective mobility behaviours and placed emphasis on the long-studied neighbourhood scale and its importance in quotidian urban life, particularly as a vehicle for promoting walkability and particularly in the European context. Albeit for entirely different motives, the 15-minute city (Moreno et al., 2021) concept gained traction during this period for its similarities with the lived experiences of the lockdown period(s).
As mobility experts, intrigued by the chrono-centric and walkability-based principles herein, we decided to test the concept’s practical application in a dense, mid-sized city such as Milan – incidentally, the first European epicentre of the pandemic in the early days of the crisis. Our initial models (discussed at length in the article, Mapping Milan Micro-centers) focused on supply-side metrics: the model looked at the variety and quantity of important daily services in neighbourhoods across Milan and analysed the population distribution across the city as a way to gauge the share of residents reaping the benefits of these successful micro-centers.
This study, in contrast, starts from the distribution of the population as a way to identify the areas accessible by walking by the largest number of people in Milan and comparing it to a static assessment of the distribution of daily services and walkable environmental conditions across the city. Pushing the envelope further, the demand-based model is dynamic in the sense that the ‘population density’ in a certain parcel/cell does not only represent people directly located in this unit, but also includes those able to access the unit within 15 minutes on foot.
This shift in the approach allowed us to achieve two things: (a) by looking at both resident and working populations, we enlarged the concept of 15-minute access to include foot access from place of work as well as place of residence, accounting for the fact that the walkable environs of the working population on a typical week day is more realistically tied to their place of work as opposed to their residential address; and (b) by mapping population using the ‘ cumulative population’ method (i.e.: people present in each cell as well as those able to reach this cell in a given timeframe), we draw attention to the areas of the city that are accessible to the largest share of the population as a basis for analysis, discussion and intervention.
The Complex Nature of Walkability
The path to achieve the 15-minute city is intricately tied to the potentials to deliver safe, comfortable and desirable walking environments. In other words, the idea is deeply intertwined with the concept of walkability. According to Speck’s (2013) General Theory of Walkability, the level of walkability of an area is driven not only by ‘usefulness’ (i.e. the utilitarian gain of a walking trip – to get from point A to point B), but is also a result of the safety, comfort and attractiveness of this walking environment. It is driven by a complex set of tangible and intangible characteristics including the physical infrastructure conditions, the level of network connectivity, high land-use mix, vitality and distinction of urban character. As shown in the article Sidewalks Map in Chapter 1, 45% of Milan’s sidewalks do not adhere to the minimum width required for two-person movement following the one-meter social distancing recommendation by local and global authorities (Regione Lombardia; 2020; World Health Organization, 2020) and consistent with the standard for comfortable sidewalk conditions as recommended in the street design guidelines by the Global Designing Cities Initiative & NACTO (2016).
However, in order to gain a holistic understanding of walkability as described herein, a walkability index, i.e. Walk Score will be used in this study to reflect the complex nature of walkability. Walk Score is a compound metric that considers various factors including both proximity and variety of services accessible by foot in a definite amount of time. Among the various indices used to measure walkability, the Walk Score index is chosen here for its consideration of travel time as a key variable, allowing us to tailor the analysis to reflect the 15-minute city approach.
A demand-driven approach to the chronocentric city
This study is organized on 3 levels of analysis: (i) mapping resident population and the density of workers/employees at their place of work (workplace density) to give a first reading of the mobility character of its various districts (i.e. where trips are generated versus where they are attracted to most across the city); (ii) a static mapping of essential daily services to understand which areas have the highest variety and density of a predefined list of services which we identified as critical to the daily urban experience as based on a reinterpretation of the Parisian 15-minute city plan (Paris En Commun, 2020); and (iii) a compound walkability analysis using the patented Walk Score metric.
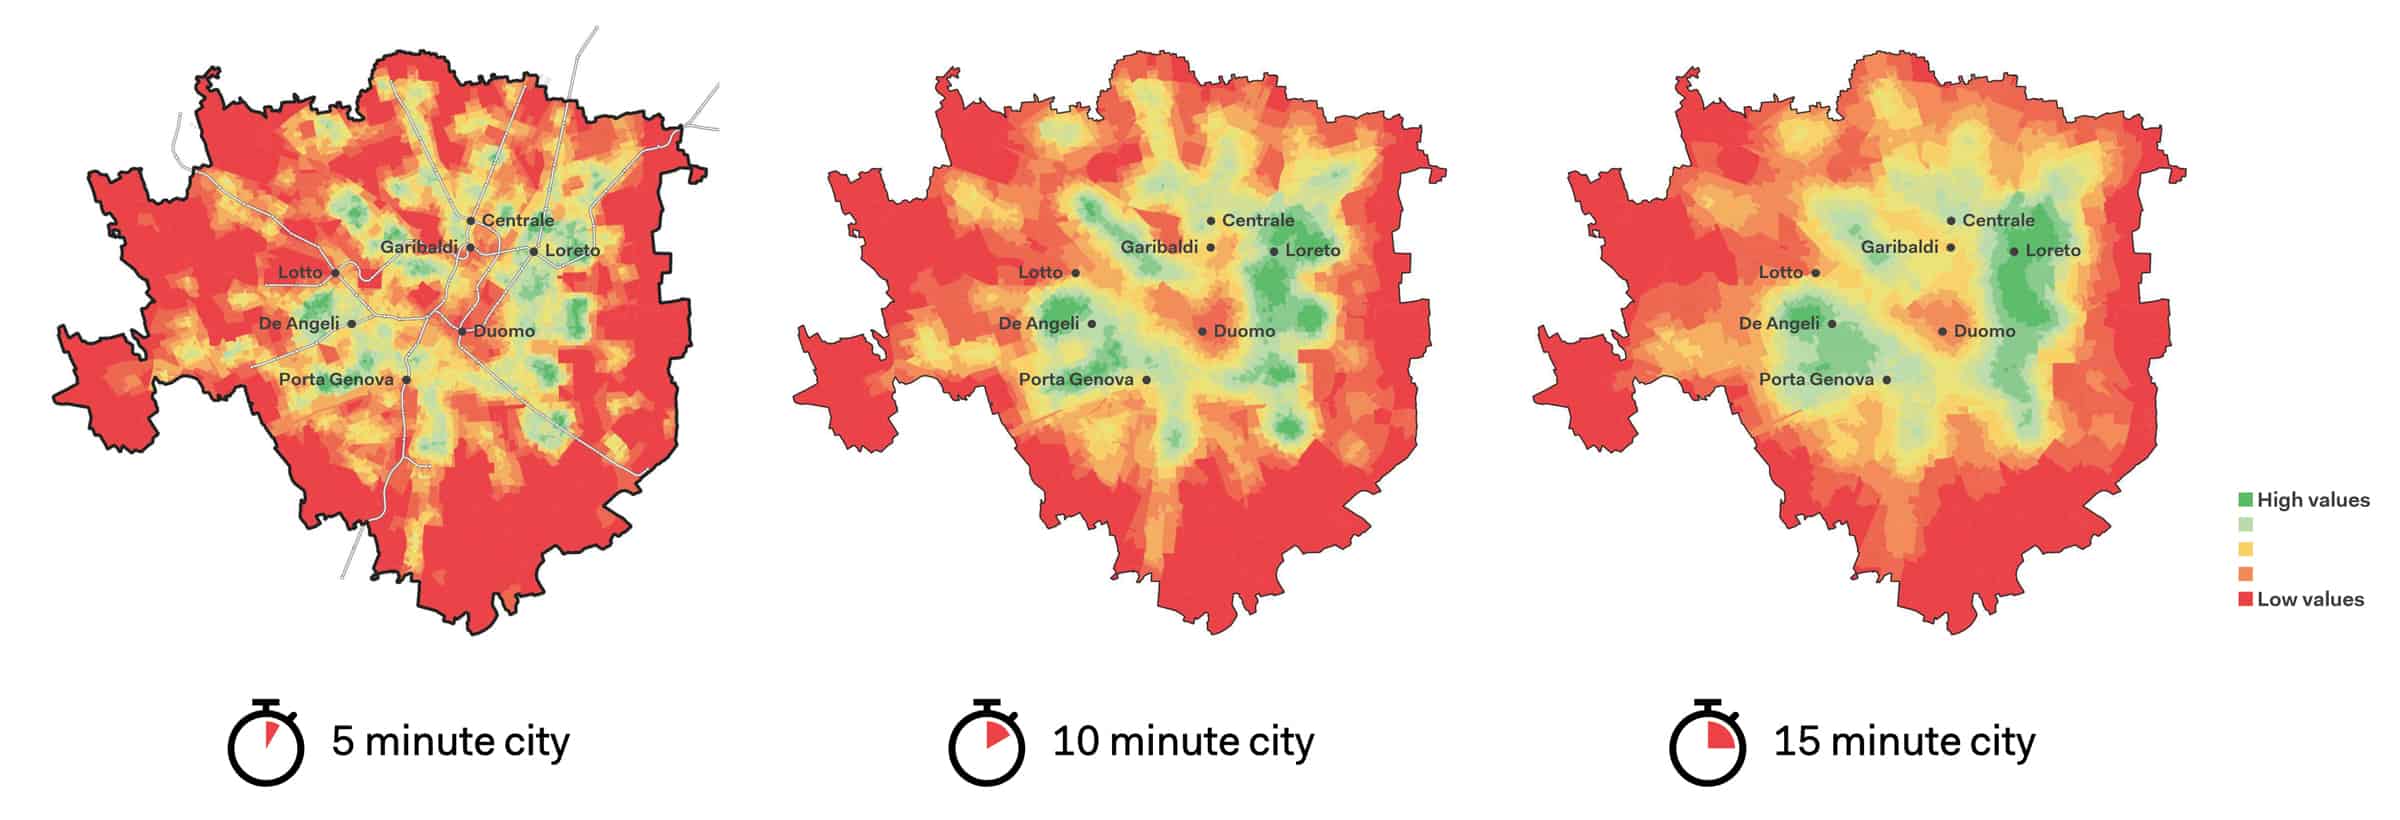
The first layer of analysis (i) aims to evaluate the density of the resident population and workplace population across Milan in relation to the pedestrian accessibility levels as allowed by the morphology of the urban fabric. The main result is therefore mapped as a “cumulative” value in the sense that it represents not only the resident or workplace population present in each cell, but also includes those who are able to reach this cell in a given timeframe (i.e. 5, 10 and 15 minutes).
The service proximity analysis (ii) is a pure compresence analysis calculated using simple distance buffers. It shows areas where residents can reach the majority of (at least 7 out of 9) service categories identified as crucial to support a balanced daily lifestyle of inhabitants. In total, the 9 service categories are: food/grocery stores, commercial stores (including clothes shops, electronics shops, etc.), cultural venues, educational facilities, parks and green spaces, restaurants, health facilities, sports facilities and other (post offices, banks, etc.). Each of these service groups includes a number of services based on open-source datasets available for the municipality of Milan. For example, educational facilities include nurseries, primary schools, high schools, etc. A GIS-based analysis of the static compresence of these services was carried out based on a pure isometric analysis with respect to 3 walking buffers – 300, 600 and 900 meters – which roughly correspond to the 5, 10 and 15-minute timeframes.
The Walk Score mapping (iii) measures the actual accessibility levels through isochronal analysis. It is based on the analysis of accessibility within 15 minutes to each group of services (there are 9 groups in total) calculated on a graph with the cost of the links based on travel time and inversely proportional to the slope of the road. The results of the 9 pedestrian accessibility analyses were then reported as indicators of accessibility to each service group on 150-meter grid. The final Walk Score value is a simple summation of these 9 individual analyses.
Results of the analysis: A mismatch between supply and demand
The resident and workplace pedestrian access maps offer an alternative approach to chrono-centric mapping based on population density as opposed to service density, highlighting distributional differences at different time scales, giving an indication of the urban character of each district. This conceptual analysis demonstrates how isochrones change shape and intensity depending on the given timeframe. In the resident pedestrian access map, micro-clusters of local centralities emerge from the 5-minute map. As the timescale is stretched, the donut shape of Milan’s second ring-road area in which the highest concentration of the resident population is located, begins to emerge (see Figure 1).
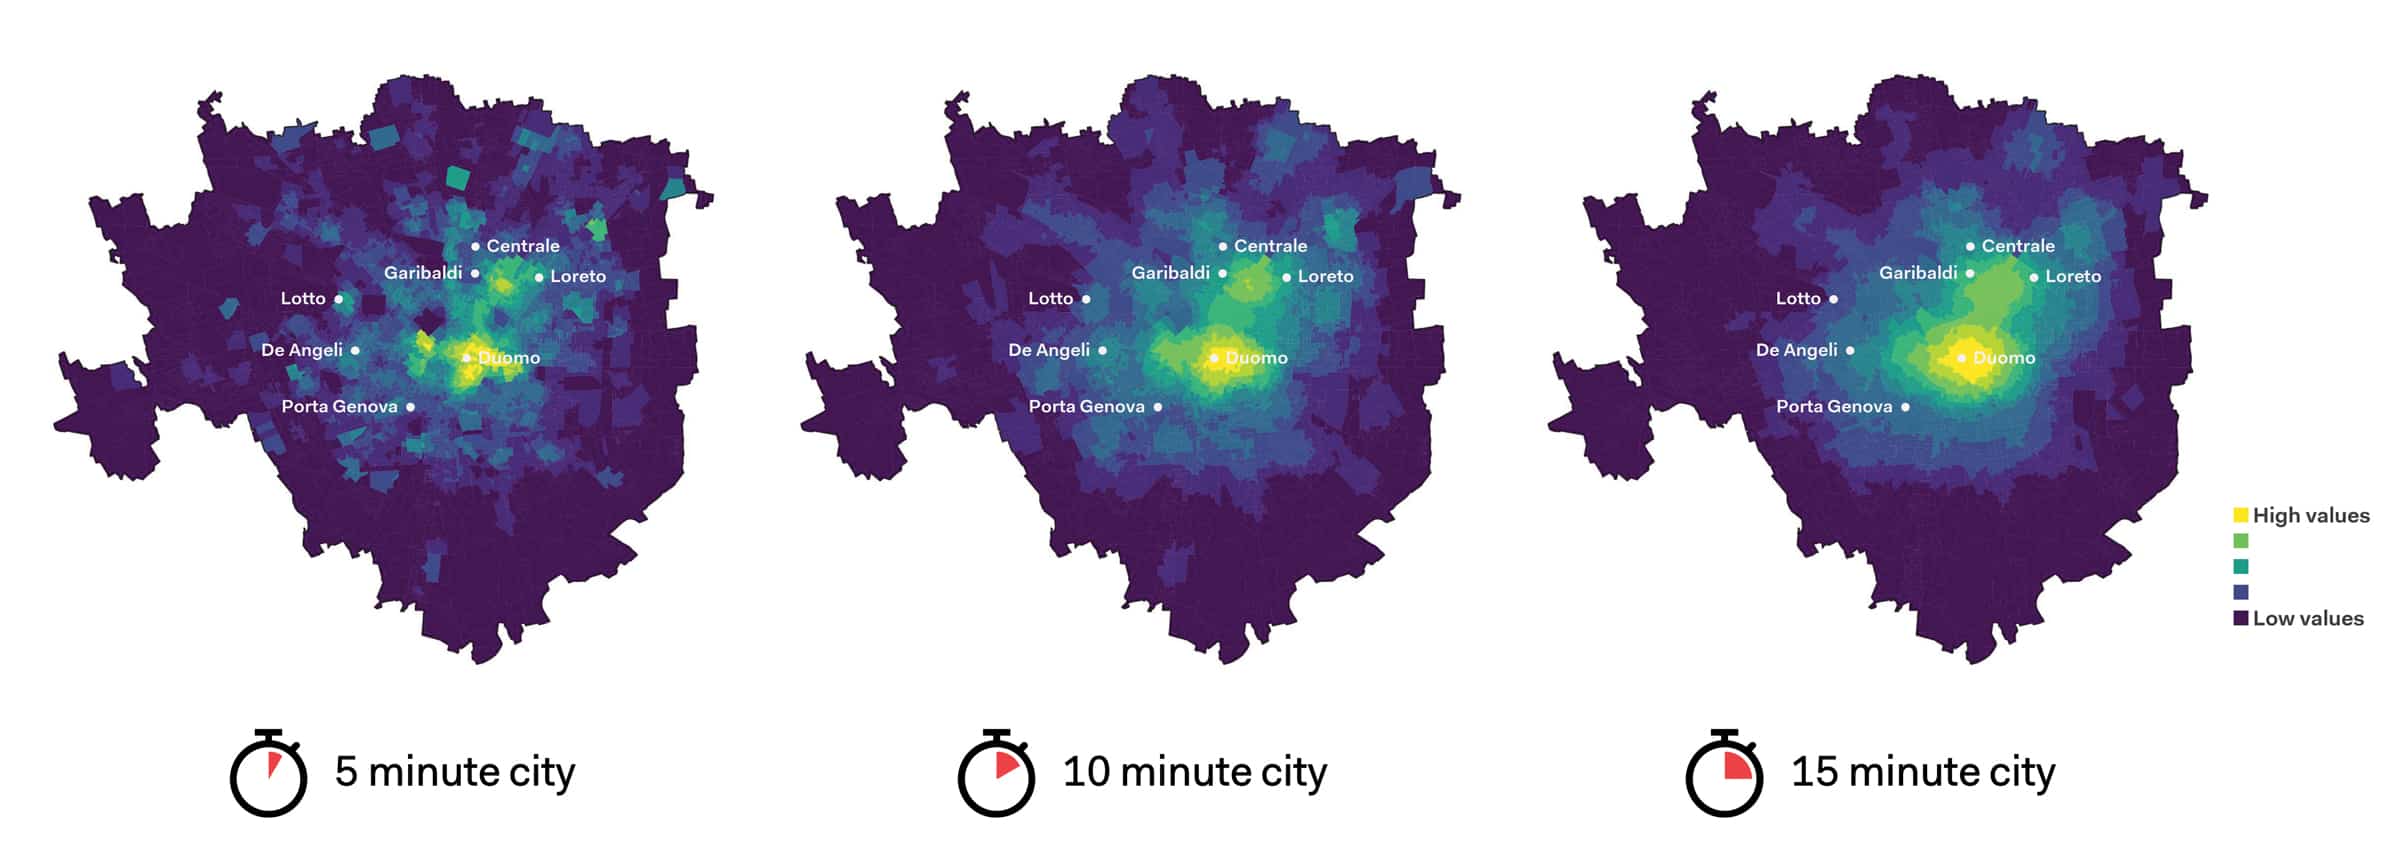
A similar interpretation can be drawn from the distribution of the workplace population. The worker pedestrian access maps show a more scattered pattern of highly accessible areas within 5 minutes of walking. At 15 minutes of walking, central districts of Milan emerge as the main cluster and a center-to-periphery gradation becomes clear. The centers with the highest pedestrian access to workplace populations at 15 minutes are the Duomo district followed by secondary concentrations in the north-east districts of Loreto, Centrale and Porta Garibaldi (see Figure 2). Areas scoring lowest in both clustering scenarios (resident population and workplace population) are peripheral neighborhoods and agricultural non-built areas, such as those on the southern end of the municipality map.
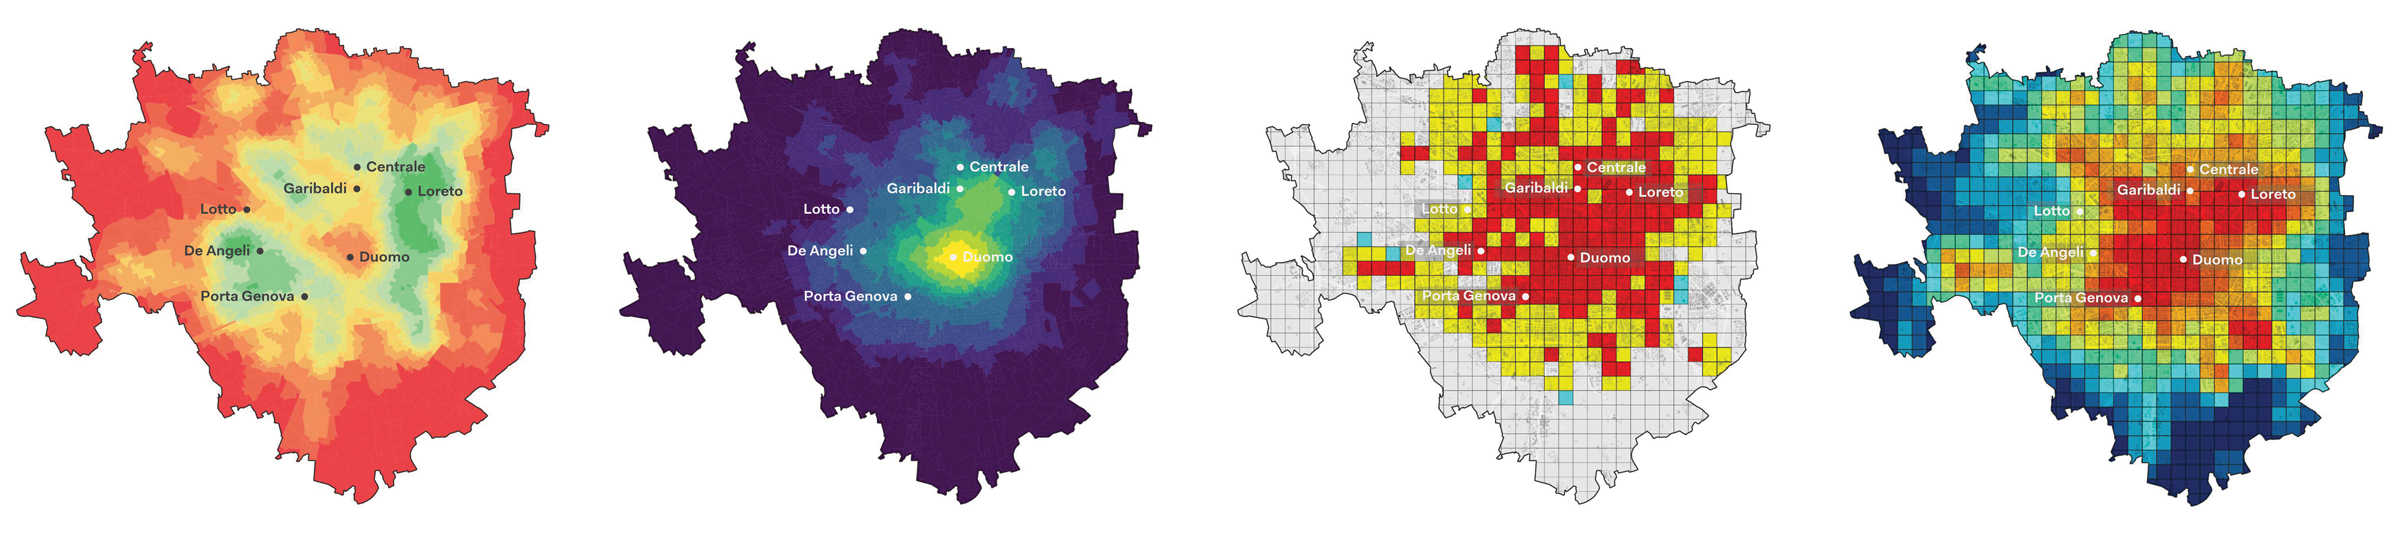
In contrast to the demand-based models, the service compresence accessibility analysis offers a first look at supply side distribution of services across the city. The map highlights the distributional differences in service diversity and density in 5, 10 and 15-minute ranges. It is clear from the map that a large portion of the city by area does not guarantee the minimum access to 7 basic service groups within a 15-minute walk.
When compared to the demand-side maps, it is possible to observe that despite the high number of residents within 15 minutes reach of the districts of De Angeli, Lotto and Porta Genova, they are not adequately covered by all primary service groups. Central areas of Milan predominantly outnumber peripheral areas in terms of density and variety of their basic service offering.
The Walk Score analysis set at a 15-minute radius confirms the static findings of the service compresence map. In addition, it highlights further lower scoring areas in the north of Milan that, despite adequate service density, are potentially less walkable for the failure of the urban structure to support comfortable and efficient walking trips (see Figure 3).
Overlaying the Walk Score results with the NIL (Nuclei di Identità Locale) neighborhood classification allows us to study the results of the analysis in relation to typically recognized neighborhood units at the city level. The result of this comparison reveals a striking correlation between nearness of a neighborhood to the city center and high walkability levels as illustrated on the chart below (see Figure 4). This correlation does not translate, however, to population distribution trends.
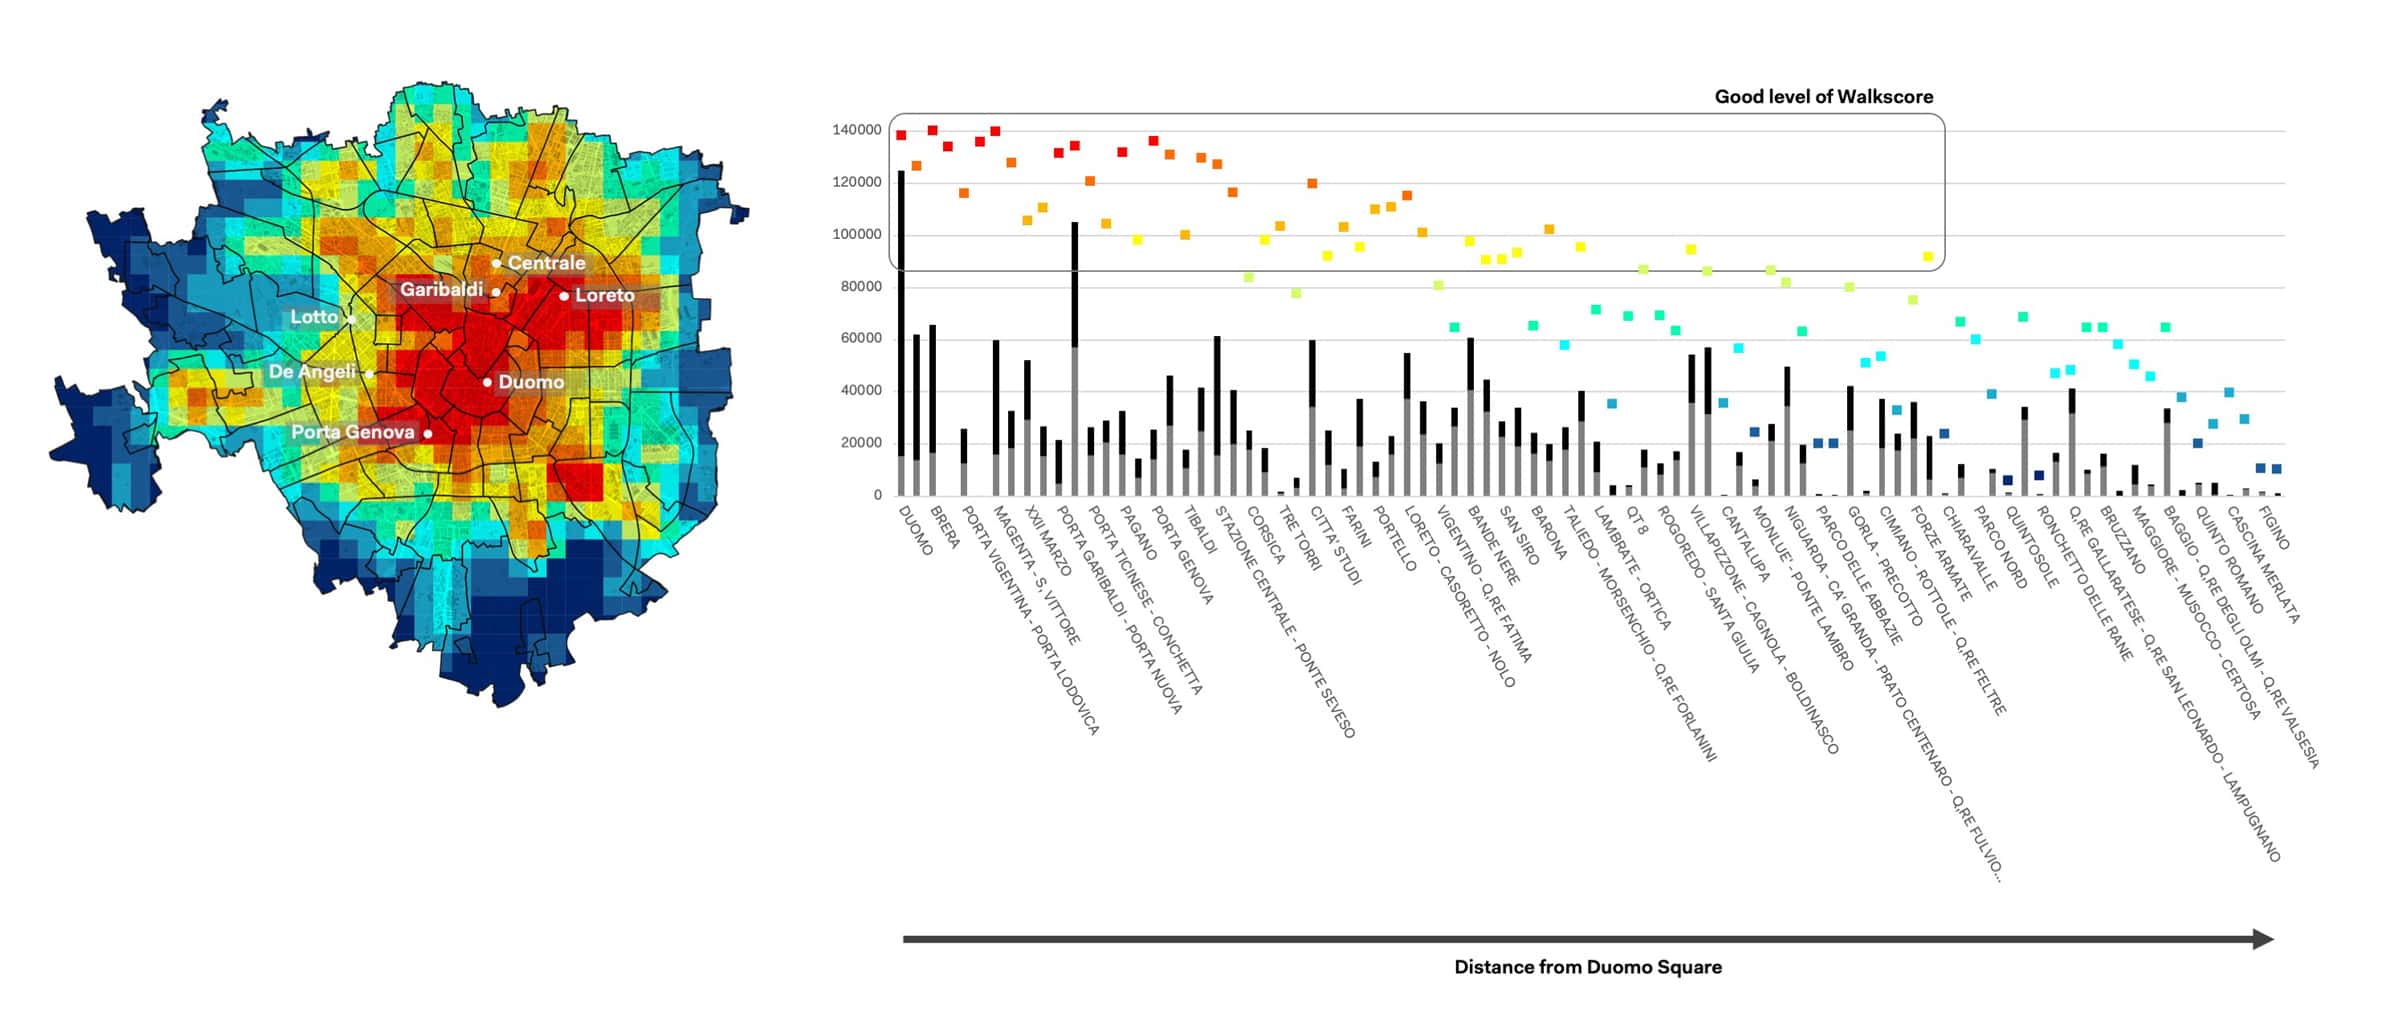
As shown in the same chart, apart from a few spikes in the number of people in close reach of well-performing and walkable districts such as Duomo and Porta Garibaldi-Porta Nuova, there is no clear trend in population distribution amongst the remaining neighborhoods. In fact, many neighborhoods with high population accessibility have low walkability scores such as Gorla, Cimiano and Gallaratese. Such neighborhoods have high attraction potential but low pedestrian access to services. These neighborhoods have high attraction potential but low pedestrian accessibility to services, signifying a need for intervention to promote equal access to services on foot across the city.
Intermodal support for the transitional phase
lleviate the burdens of a low walkable environment in the short run. Currently, only half of Milan benefits from the ease and convenience of a 15-minute city. A practical solution to support the model could be to boost first-and-last-mile mobility solutions to extend accessibility ranges while maintaining limited trip times and energy costs. Global trends show that micro-mobility devices have a significant role in reducing the first-and-last-mile gap and are often paired with public transport (Heineke et al., 2019; Zagorskas & Burinskienė, 2020; Boglietti et al, 2021). One of the main limitations of micro-mobility, however, is its demographic exclusion of higher age groups (ibid.). For older citizens and users with assisted mobility needs, on-demand transport may be a more suitable intermodal solution.
Final Discussion
The mapping analysis shows that Milan’s human-scale spatial structure has great potential to support walkability, should distributional differences and the mismatch between supply and demand in certain areas be addressed. From a demand perspective, the highest concentration of the resident population is within reasonable walking distance to the districts of the second ring road area, whereas the distribution of the working population cluster strongly in central districts.
On the other hand, if we look at the supply side of the equation, i.e. the walkability of the pedestrian network and the distribution of services, we find that there is missed potential in several pockets of high demand that are not adequately served by everyday destinations and are not sufficiently walkable from a multi-dimensional standpoint. By considering both sides of the equation, the combined series of maps captures not only the current state of the city, but the potential to extend its reach based on its intrinsic morphological capacity to attract daily users (i.e. residents and workers).
This research highlights the diversity of approaches to address walkability in cities and proposes a demand-driven approach to measure the 15-minute city. It progresses the view that 15-minute cities can only work if cities are not only efficient but are also designed to encourage more walking from a multi-angular perspective that includes both functional and experiential factors.
Walking infrastructure shortages could be overcome by broadening the perspective of the public realm as a whole and adopting a holistic approach of the walkable ‘urban living’ model. Short-term flexible interventions could focus on upgrading existing open spaces (through sidewalk redesign and integration of new micro-mobility modes) whereas long-term strategies should extend to policy design promoting egalitarian access opportunities across different districts in the city – and in particular in peripheral neighborhoods – while placing the walkability agenda at the center of neighborhood design. Ongoing local plans in the City of Milan reflect the shift to prioritize walkability as a sustainable growth principle. Both the Territorial Government Plan (PGT) 2030 and the Milan 2020 Adaptation Strategy developed in the wake of the pandemic crisis highlight the importance of pedestrian-focused interventions to improve urban connectivity and accessibility (Comune di Milano, 2019; Comune di Milano and AMAT Agenzia Mobilità Ambiente Territorio, 2020).
Moving Forward
A critical understanding of mobility under contemporary circumstances, which considers digital as well as physical infrastructure is essential for accurately representing the 15-minute city. There is potential in exploring the introduction of ‘zero-minute trips’ as part of a new hybrid conception of the 15-minute city that considers the contributions of digital services in replacing physical trips. Especially in the context of unprecedented growth of remote working since the start of the pandemic, urban mobility models stand to benefit from reductions in work commutes and thereby traffic congestion, which can both directly (hyper-proximity) and indirectly (road safety, reduced noise and environmental benefits) improve walkability prospects in cities. On the other hand, the marked drop in retail and replacement with online shopping has myriad effects on the urban mobility system. Whereas on the one hand it reduces user trips, it is replaced by increased logistics and delivery trips which has various implications on traffic and curbside utilization in urban areas. Both of these trends have been largely influenced by the pandemic situation.
A comprehensive view of mobility that considers the augmented role of digital infrastructure in fulfilling daily urban needs is essential for a critical analysis of mobility systems in the contemporary urban landscape. Notwithstanding the potentials offered by digital infrastructure substitutions, we also caution that an excessive reliance on these solutions could lead to the denial of what we believe is the key role of public space from a contemporary interpretation: fertile ground for triggering opportunities of relationship and aggregation, which is the basis of the concept of walkability.
The results of this research activity have been published in the following scientific Journals:
The results of this research activity have been featured in the Global Observatory of Sustainable Proximities (IAE Paris Sorbonne Business School Chair ETI, UN-Habitat, UCLG and C40, 2023): http://sustainableproximities.org/
The research has been also published in the following scientific Journals:
Abdelfattah L., Deponte D., Fossa G. (2022). The 15-minute city as a hybrid model for Milan. TeMA – Journal of Land Use, Mobility and Environment, 71-86. https://doi.org/10.6093/1970-9870/8653
Abdelfattah, L., Deponte, D., Fossa, G. (2022). 15-Minute City: Interpreting the Model to Bring Out Urban Resiliencies. Transportation Research Procedia, 60, 330-337. https://doi.org/10.1016/j.trpro.2021.12.043
References
Boglietti, S., Barabino, B., Maternini, G. (2021). Survey on e-Powered Micro Personal Mobility Vehicles: Exploring Current Issues towards Future Developments. Sustainability, 13(7), 3692. https://doi.org/10.3390/su13073692
Comune di Milano (2019). Milano 2030 Visione, Costruzione, Strategie, Spazi. Piano di Governo del Territorio (PGT). Available at: https://www.comune.milano.it/documents/20126/2053134/01DP_Relazione_Generale.pdf/baba55b0-c49a-ce8a-d9d2-68380cce21d2?t=15547220560977
Comune di Milano and AMAT Agenzia Mobilità Ambiente Territorio (2020). Milan 2020. Adaptation Strategy. Open Streets: Strategies, actions and tools for cycling and walking, ensuring distancing measures within the urban travel and towards a sustainable mobility. Available at: https://www.comune.milano.it/documents/20126/7117896/Open+streets.pdf/d9be0547-1eb0-5abf-410b-a8ca97945136?t=1589195741171
Global Designing Cities Initiative and National Association of City Transportation Officials (2016). Global street design guide. Island Press.
Heineke, K., Kloss, B., Scurtu, D. and Weig, F., 2019. Micromobility’s 15,000-mile checkup. Retrieved from McKinsey & Company Automative & Assembly: https://www. mckinsey. com/industries/automotive-andassembly/our-insights/micromobilitys-15000-mile-checkup.
Moreno, C., Allam, Z., Chabaud, D., Gall, C., & Pratlong, F. (2021). Introducing the “15-Minute City”: Sustainability, Resilience and Place Identity in Future Post-Pandemic Cities. Smart Cities, 4(1), 93–111. https://doi.org/10.3390/smartcities40100066
Paris En Commun (2020). Ville du 1/4h. Le Programme d’Anne Hidalgo. Available at: https://annehidalgo2020.com/le-programme/
Regione Lombardia (2020). Ordinanza n. 604 del 10/09/2020. Ulteriori misure per la prevenzione e gestione dell’emergenza epidemiologica da Covid-19. Available at: https://www.regione.lombardia.it/wps/wcm/connect/209b7430-4bbf-4203-b9ab-89c97bb599a2/ORDINANZA+604+del+10+settembre+2020.pdf?MOD=AJPERES&CACHEID=ROOTWORKSPACE-209b7430-4bbf-4203-b9ab-89c97bb599a2-nhUNJzC
Speck, J. (2013). Walkable city: How downtown can save America, one step at a time. Macmillan.
World Health Organization (2020). Corona-virus disease (COVID-19) advice for the public. World Health Organization. Available at: https://www.who.int/emergencies/diseases/novel-coronavirus-2019/advice-for-public
Zagorskas, J. and Burinskienė, M. (2020). Challenges Caused by Increased Use of E-Powered Personal Mobility Vehicles in European Cities. Sustainability, 12(1), 273. https://doi.org/10.3390/su12010273