
This article was originally published by Fondazione Eni Enrico Mattei (FEEM), Editor: Prof. Stefano Pareglio, Firms and Cities Transition towards Sustainability (FACTS) Program Scientific Coordinator, ISBN 9791280348029
Abstract
FEEM Policy Brief
The availability of ubiquitous location-based data in cities has had far-reaching implications on analytical powers in various disciplines. This article focuses on some of the accrued benefits to urban transport planners and the urban planning field at large. It contends that the gains of Big Data and real-time information has not only improved analytical strength, but has also created ripple effects in the systemic approaches of city planning, integrating ex-post studies within the design cycle and redefining the planning process as a microscopic, iterative and self-correcting process. Case studies from the field are used to further highlight these newfound abilities to process fine-grained analyses and propose more customized location-based solutions, offered by Big Data. A detailed description of the Torrance Living Lab experience maps out some of the potentials of using movement data from Big Data sources to design an alternative mobility plan for a low-density urban area. Finally, the paper reflects on Big Data’s limited capacity at present to replace traditional forecast modelling tools, despite demonstrated advantages over traditional methods in gaining insight from past and present travel trends.
Introduction
Big Data is simply data—but in orders of magnitude that were previously unimaginable. The volumes of data collected from our mobile devices, GPS devices, credit card transactions, etc. are so large that they are transforming multiple disciplines; both from an analytical point of view and from an action point of view. Transport planning is one of those transformed disciplines. Amongst other things, the ability to harness continuously monitored real-time information has had profound effects on the way transport planners perceive mobility trends and the way they plan for them. Traditionally, organized (manual or automatic) traffic counts were the main reference for traffic data, coupled with household and travel diary surveys to collect qualitative and behavioral information or complete missing quantitative information that could not be logged at a large scale in an era before digital tracking devices hardly parted with the pockets, wallets and cars of millions of users around the globe.
Not at the total expense of traditional methods, continuous monitoring offers possibilities to produce information on travel behavior at a high-level resolution, particularly with respect to temporal aspects. Traditionally collected datasets tend to focus on rush hours movements, leaving much of what happens outside of these short timeframes untapped. Due to the large costs incurred in traditional survey methods, peak traffic movements where used as the industry standard in order to plan for current and future mobility scenarios. Today, highly accurate location-based data mined from millions of devices at a time offers disruptive potential to the typical planning approach and creates the opportunity to design far more tailored mobility plans that respond to the precise, unique needs of cities at a much finer grain of observation.
Transforming the Planning Process
In cities of the previous century, urban planning was a highly centralized process based on centralized structures of knowledge, usually conceptualized and implemented by a single visionary, in a single sweeping measure and over an extended period of time. The role of the master planner in 19th Century Paris, for example – the famed Baron Haussmann – was to enforce order and propose corrective measures to fight plague and disease in the city, drawing some resemblance to our situation today. Then as now, the imperative was to distance city dwellers and rethink the city structure in ways that correspond to the city’s sanitary needs. In principle, the Haussmann program’s core objective focused on circulation efficiency, albeit the displacement of thousands and the eradication of valuable heritage in its wake (Glaeser, 2012; Jones, 2004). Despite stark differences between the planning principles of 19th Century Paris and those of the current 21st, the planning process itself endured.
Evolution of the planning process: a gradual shift in the paradigm
The five major stages within the life cycle of any given project are planning, design, implementation, operation and validation. The last step, though often overlooked, is an integral component whereby planners and experts look at the consequences of the implemented actions, which before the availability of Big Data had been confined to an ex-post position. The (often long) time span between the planning and validation of planning decisions (after implementation) had made any attempt to correct planning decisions fully futile, dissociating cause and effect association of planning decisions and their results. As data becomes more readily available and data-driven approaches become the norm, the length of this process is significantly compressed.
Big Data is perceived by some as ‘the end of theory’ because it creates an opportunity to derive immediate insight from empirical evidence rather than building it on theoretical constructs (Milne and Watling, 2019). The consistent availability of real-time data can reveal patterns and correlations in a systemic manner at a much faster pace than when following a symptomatic approach as in traditional methods (Curry, 2019). By constantly sifting through robust and comprehensive datasets, the system is apt to identify trends long before the causal links within the system are fully understood (Milne and Watling, 2019). Our hypothesis is that this shift in the process is transforming urban planning from a linear process to a microscopic, iterative and self-correcting process; which is in turn contributed to by a much wider multi-disciplinary collective. In essence, the process is becoming less definitive and more adaptive, less about what to do and more about what to do next.
Towards a more democratic planning process
Smartphone ownership rates vary around the world from as high as 83% in the United Kingdom to as low as 16% in Pakistan, for example (Statista, 2019a). What is certain though is a consistent upward global trend, which took the number of smartphone users around the world from 2.5 billion users in 2016 to 3.2 billion in 2019 in just three short years (Statista, 2019b). Surveys conducted by the Pew Research Center show that in the U.S. alone, smartphone penetration blew up from just 35% in 2011 to 81% in 2019 (Pew Research Center, 2019). These consolidated smartphone-in-every-pocket trends, at least in the rich countries of the world, are giving rise to more democratized data collection methods and results.
The spread of smartphones and other digital communication tools gave rise to crowd-sourced data platforms, which rely on open-data networks and accessible data input methods to source data from worldwide users. Moovit for example is a public transit focused data company that relies on real-time information collected from over 710,000 local editors called ‘Mooviters’ in 3,400 cities across 112 countries combined with information from public authorities[1]. Using amateur-oriented digital mapping tools, the Mooviter community is able to disseminate and maintain often obscured or missing public transit information to local communities in a fast, efficient and user-verified manner. With Mooviters accounting for 77% of new market entries, Moovit is marketing itself as the ‘Wikipedia of Transit’. Moovit is just one application demonstrating how bottom-up community approaches can have a major impact on the industry of mobility, breaking down the hegemonic structures of knowledge and design in urban services.
[1] https://moovit.com/about-us/
Progressive smartphone penetration also means that data is gradually being sourced from a wider array of users and areas. Sampling bias is a much-discussed topic when it comes to Big Data. Due to the high mark-up prices of these devices and their technological complexity, data mined from these devices tends to overrepresent more affluent and younger demographics (Milne and Watling, 2019). However, given the far larger sampling capacities that Big Data offers, the absolute amount of data that reflects travel trends of these and other minority groups are far larger than those offered by traditional travel surveys, allowing for more robust targeted analyses (ibid.). Moreover, the fast pace of technological development and the sheer abundance of it in our day and age has led to more price point diversity. In addition, as more tech-savvy generations age, the age demographic sampling bias will fade out as well.
Data in more pockets has also meant that the centralized knowledge structures of urban planning towards big cities is challenged. In the same way as with users, traditionally understudied areas from small cities to low-density suburban areas of large metropolitan cities are given a voice in data. Rather than relying on near approximations of data and tools designed to serve large urban centers, small urban territories can harness information from locally-referenced data to support local mobility plans without relying on centralized urban structures or deploying substantial resources.
Towards a “web way of thinking”
To apply a metaphor from human biology, the system by which Big Data makes sense of the city is similar to the one that neuroscientists use to study the nervous system. Like the human brain, the city is made up of immense networks of complex interactions, or ‘organized complexities’ as originally coined by the urban thinker and activist, Jane Jacobs who first made the analogy between the mechanics of the urban and natural worlds (Jacobs, 1961). What Big Data offers is the chance to view these systems in their totality; expanding the view from the scale of neurons to distinguish overarching repetitive patterns of neural connections in the system at large (Mehaffy, 2019). We are at an unprecedented moment for urban science; the city has never been so perceptive an organism and so abundantly supported by data and information.
Such timely
perceptiveness is key during disruptive times such as the current moment of the
COVID-19 pandemic, which has created a myriad of unprecedented situations in a
short amount of time that cities around the world must learn to dance with. Available
real-time information has guided and will continue to guide local city administrations’
pandemic response from new urban policies to mobility services within the
emergency situation, as well as inform ideas about the ways to reshape the
cities of the future. Already, the dynamic workings of abrupt changes in mobility
patterns are coming to light. A recent report by StreetLight Data, for example reveals
a remarkable shift in the hourly distributions of VMT in the U.S. from the
typical AM/PM peaks to a flattened AM replaced by elevations in mid-day
movements, a shift with major implications for transport planning at large (Grogan,
2020).
Finetuning Industry Standards
‘Torture the data, and it will confess to anything.’ – Ronald Coase, Economist and Author.
The rise of Big Data is slowly establishing new ways for reading data everywhere, understanding them in deeper and more interconnected ways than ever before. Industry specialists are developing new ways of approaching the data to create new meanings and new semantic relationships by overlapping various strings of geospatial information. The GIS data analytics company, Esri for example overlaps segmentation data with movement data to understand people’s travel habits, preferences and behaviors. Esri’s Tapestry Segmentation[2] classifies neighborhoods into 67 distinct segments based on demographic and socio-economic characteristics, producing a number of relatable culturally referenced district profiles, such as ‘Urban Chic’ and ‘Senior Escapes’. Alternatively, Streetlytics by Citilabs[3] innovatively combines tapestry information with daily movement profiles divided by traffic flow directions to not only reveal the traffic flow volumes but also the characteristics of the users generating these flows. This is one of the rare attempts to look into user preferences and how different user types and tiers move and use the city differently. It is a first instance in which traffic analysis goes beyond the typically anonymous nature of users to analyze them as beings with specific needs and desires. Such examples shed some light on the different ways individual organizations read into Big Data to reconstruct new narratives and better understand socio-spatial relationships.
[2] https://www.esri.com/en-us/arcgis/products/tapestry-segmentation/overview
[3] https://www.bentley.com/en/products/brands/streetlytics
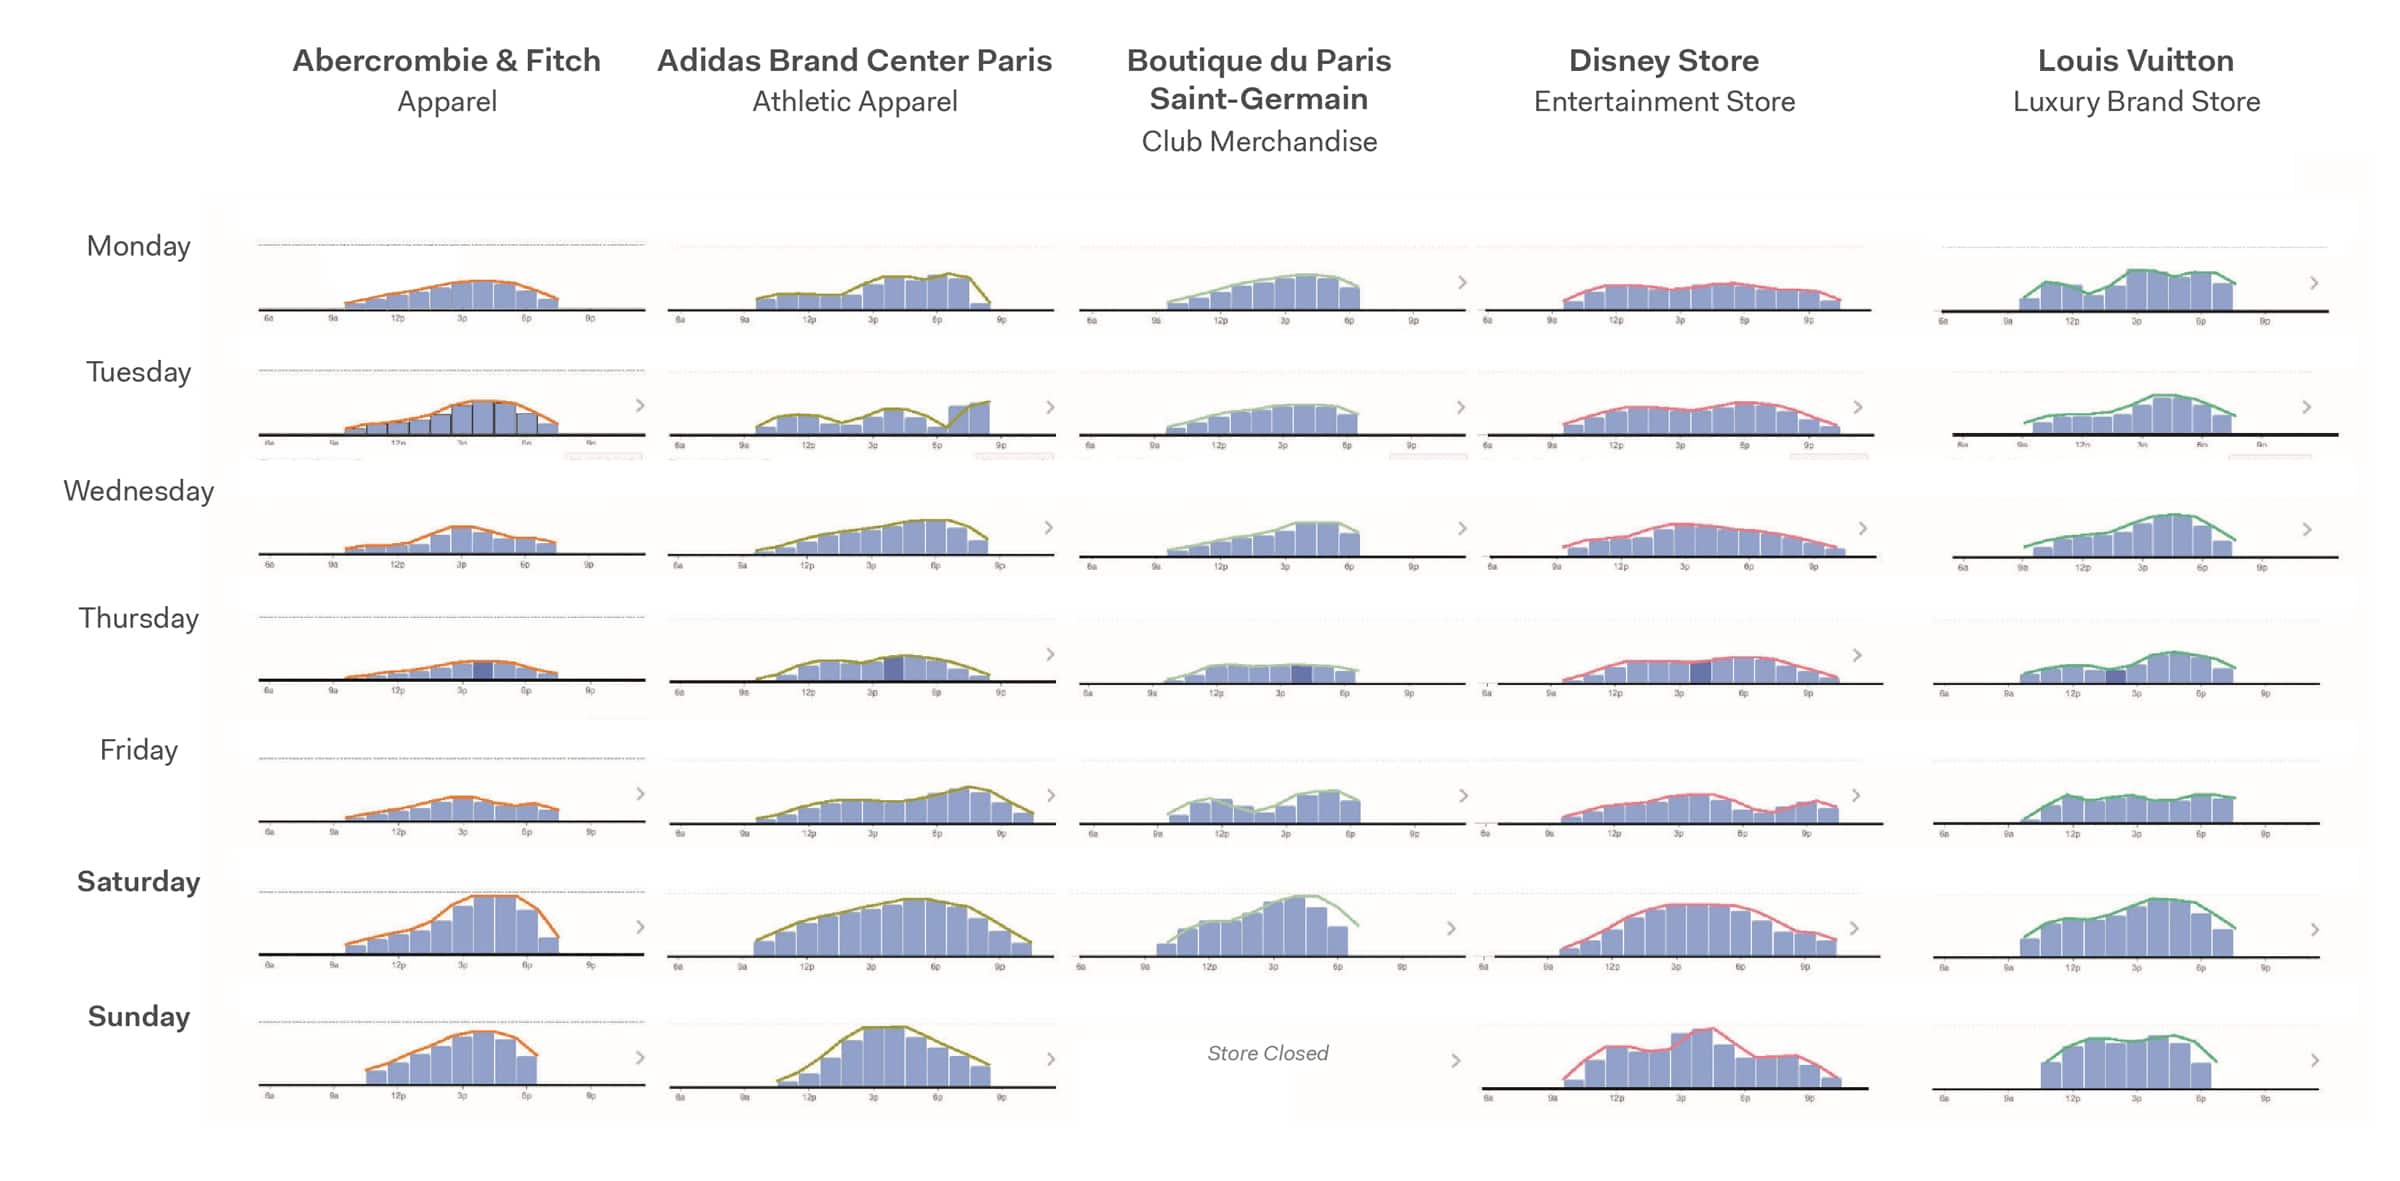
This fast-paced evolution is leading to a shift away from total reliance on standardized, institutional transportation engineering manuals, such as the Institute for Transportation Engineers (ITE)’s Traffic Engineering Handbook, which served well in a moment of time when the strongest tools we had were precedents from existing projects as guides for future developments. In their place, a significant number of real-time data sources have emerged providing a far more detailed database in comparison to the generalized averages and peak-traffic representations taken as rule of thumb in earlier models of the field. Far more detailed data allows us to delve into deeper levels of analysis, detecting subtler nuances. The series of graphs below following the mobility profiles for a number of retail functions along the Champs-Élysées Avenue in Paris reveal staggering diversity between retail stores of different types, customer bases, etc. despite their clustering on a single shopping street (figure 1).
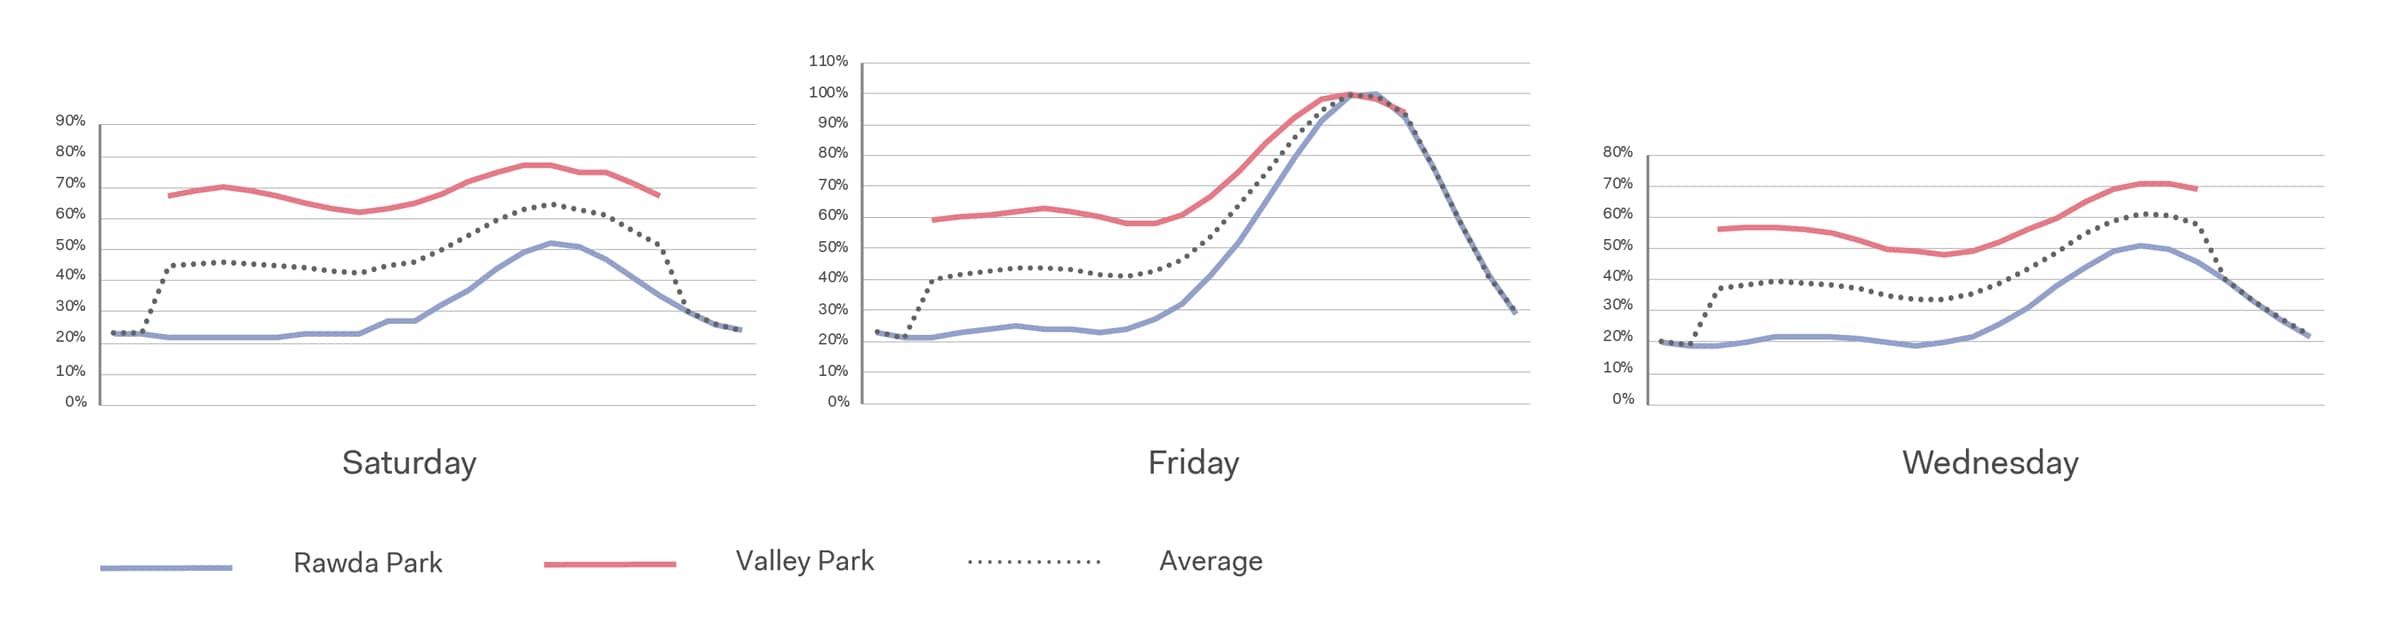
Context also matters. A far cry from the Parisian Champs Champs-Élysées, data for park visitor traffic in the Saudi Capital, Riyadh highlights contextual variances in day-to-day behavioral trends. Figure 2 shows the typical Wednesday profile, which represents the average working day, contrasted with Friday and Saturday profiles, the official weekend or rest days in Saudi Arabia. Apart from weekday/weekend diversity, data shows that Friday and Saturday trends vary significantly from each other as well. The local particularity of Friday in the Islamic state, where daily rhythms pivot around a midday prayer and a number of other coordinated community rituals, contribute to the relative spike in park visits in the second half of the day (figure 2). This variety of data allows us to move into more localized analytical approaches and to tailor design aspects according to specific rather than generic attributes in international settings.
Company Showcase: Torrance Living Lab
In 2018, Systematica undertook a project studying mobility patterns in the city of Torrance, Los Angeles through extensive use of Big Data, with the purpose of designing a demand-driven location-based mobility strategy for the city. The city of Torrance, located on the outskirts of Los Angeles County (California) presents a great case for tackling the difficult task of designing a mobility strategy for a low-density urban environment and demonstrates the potentials of fine-grain analysis offered by Big Data. Proposed solutions were piloted in a localized project on Torrance’s Sepulveda Boulevard.
The project relies on data retrieved from StreetLight Data, a pioneering company that combines machine learning with deep transportation knowledge to provide data for mobility and transport engineers. Using anonymized location-based data from GPS devices and personal mobile phones, StreetLight provides origin-destination data assimilated into a wide variety of measurable, explicit metrics such as trip length, speed, etc. and which can be analyzed for implicit information, such as trip purpose, travel mode, etc.
Analyzing mobility demand in Torrance
The basic geospatial unit in transport engineering is the Traffic Analysis Zone (TAZ). It is defined according to specific transportation attributes, which had traditionally reflected census block or other administrative divisions. Location data, on the other hand, allows for more flexibility in defining the shape and size of TAZs taking city characteristics and patterns into consideration as opposed to relying exclusively on preset boundary definitions. Following this spatial partitioning logic, the data allows us to distinguish between internal movements (from one zone to another) and intrazonal movements (movements happening within each TAZ or distinct zone).
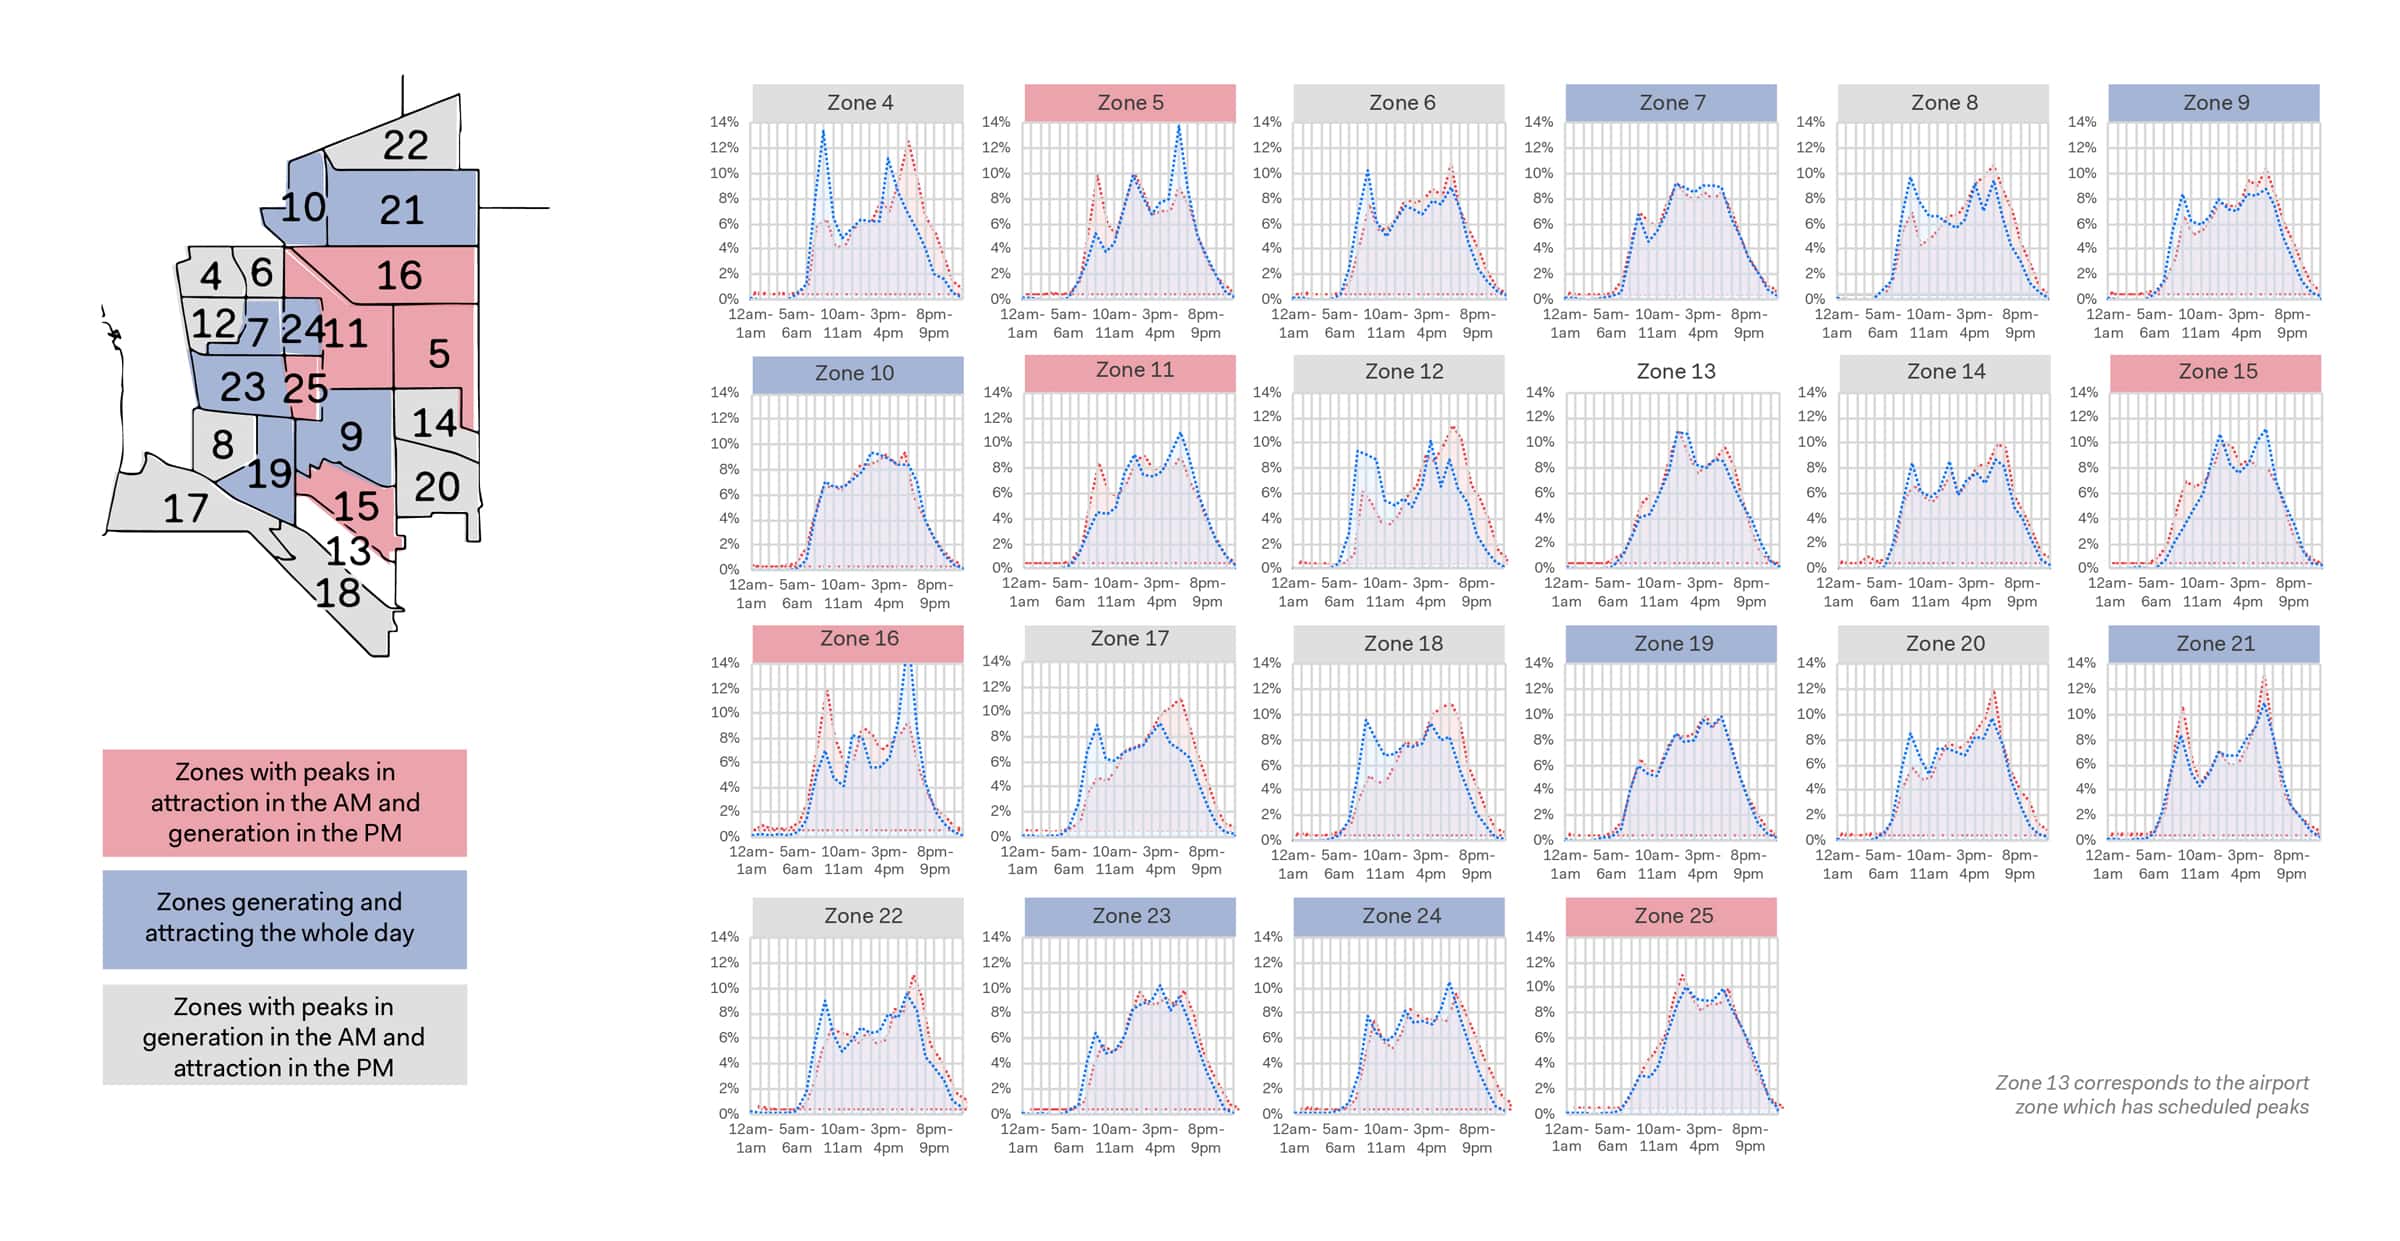
By analyzing the daily profiles of all 25 zones in Torrance, three types of profiles were identified: (i) zones which attract trips in the AM and generate them in the PM, (ii) zones which attract and generate trips throughout the day, and (iii) zones which generate in the AM and attract in the PM, as shown in (figure 3). Zone 13 was an outlier since it corresponds to the airport zone, which has its own scheduled peaks depending on organized airport activity. The contrasting profiles help distinguish more monofunctional areas: office-oriented zones in the case of (i) and residential-oriented zones in the case of (iii); with respect to more mixed use and commercial zones in the case of (ii). This level of detail in trip analysis produced at such a microscopic geographical scale is unprecedented and represents another breakthrough in traffic engineering capabilities.
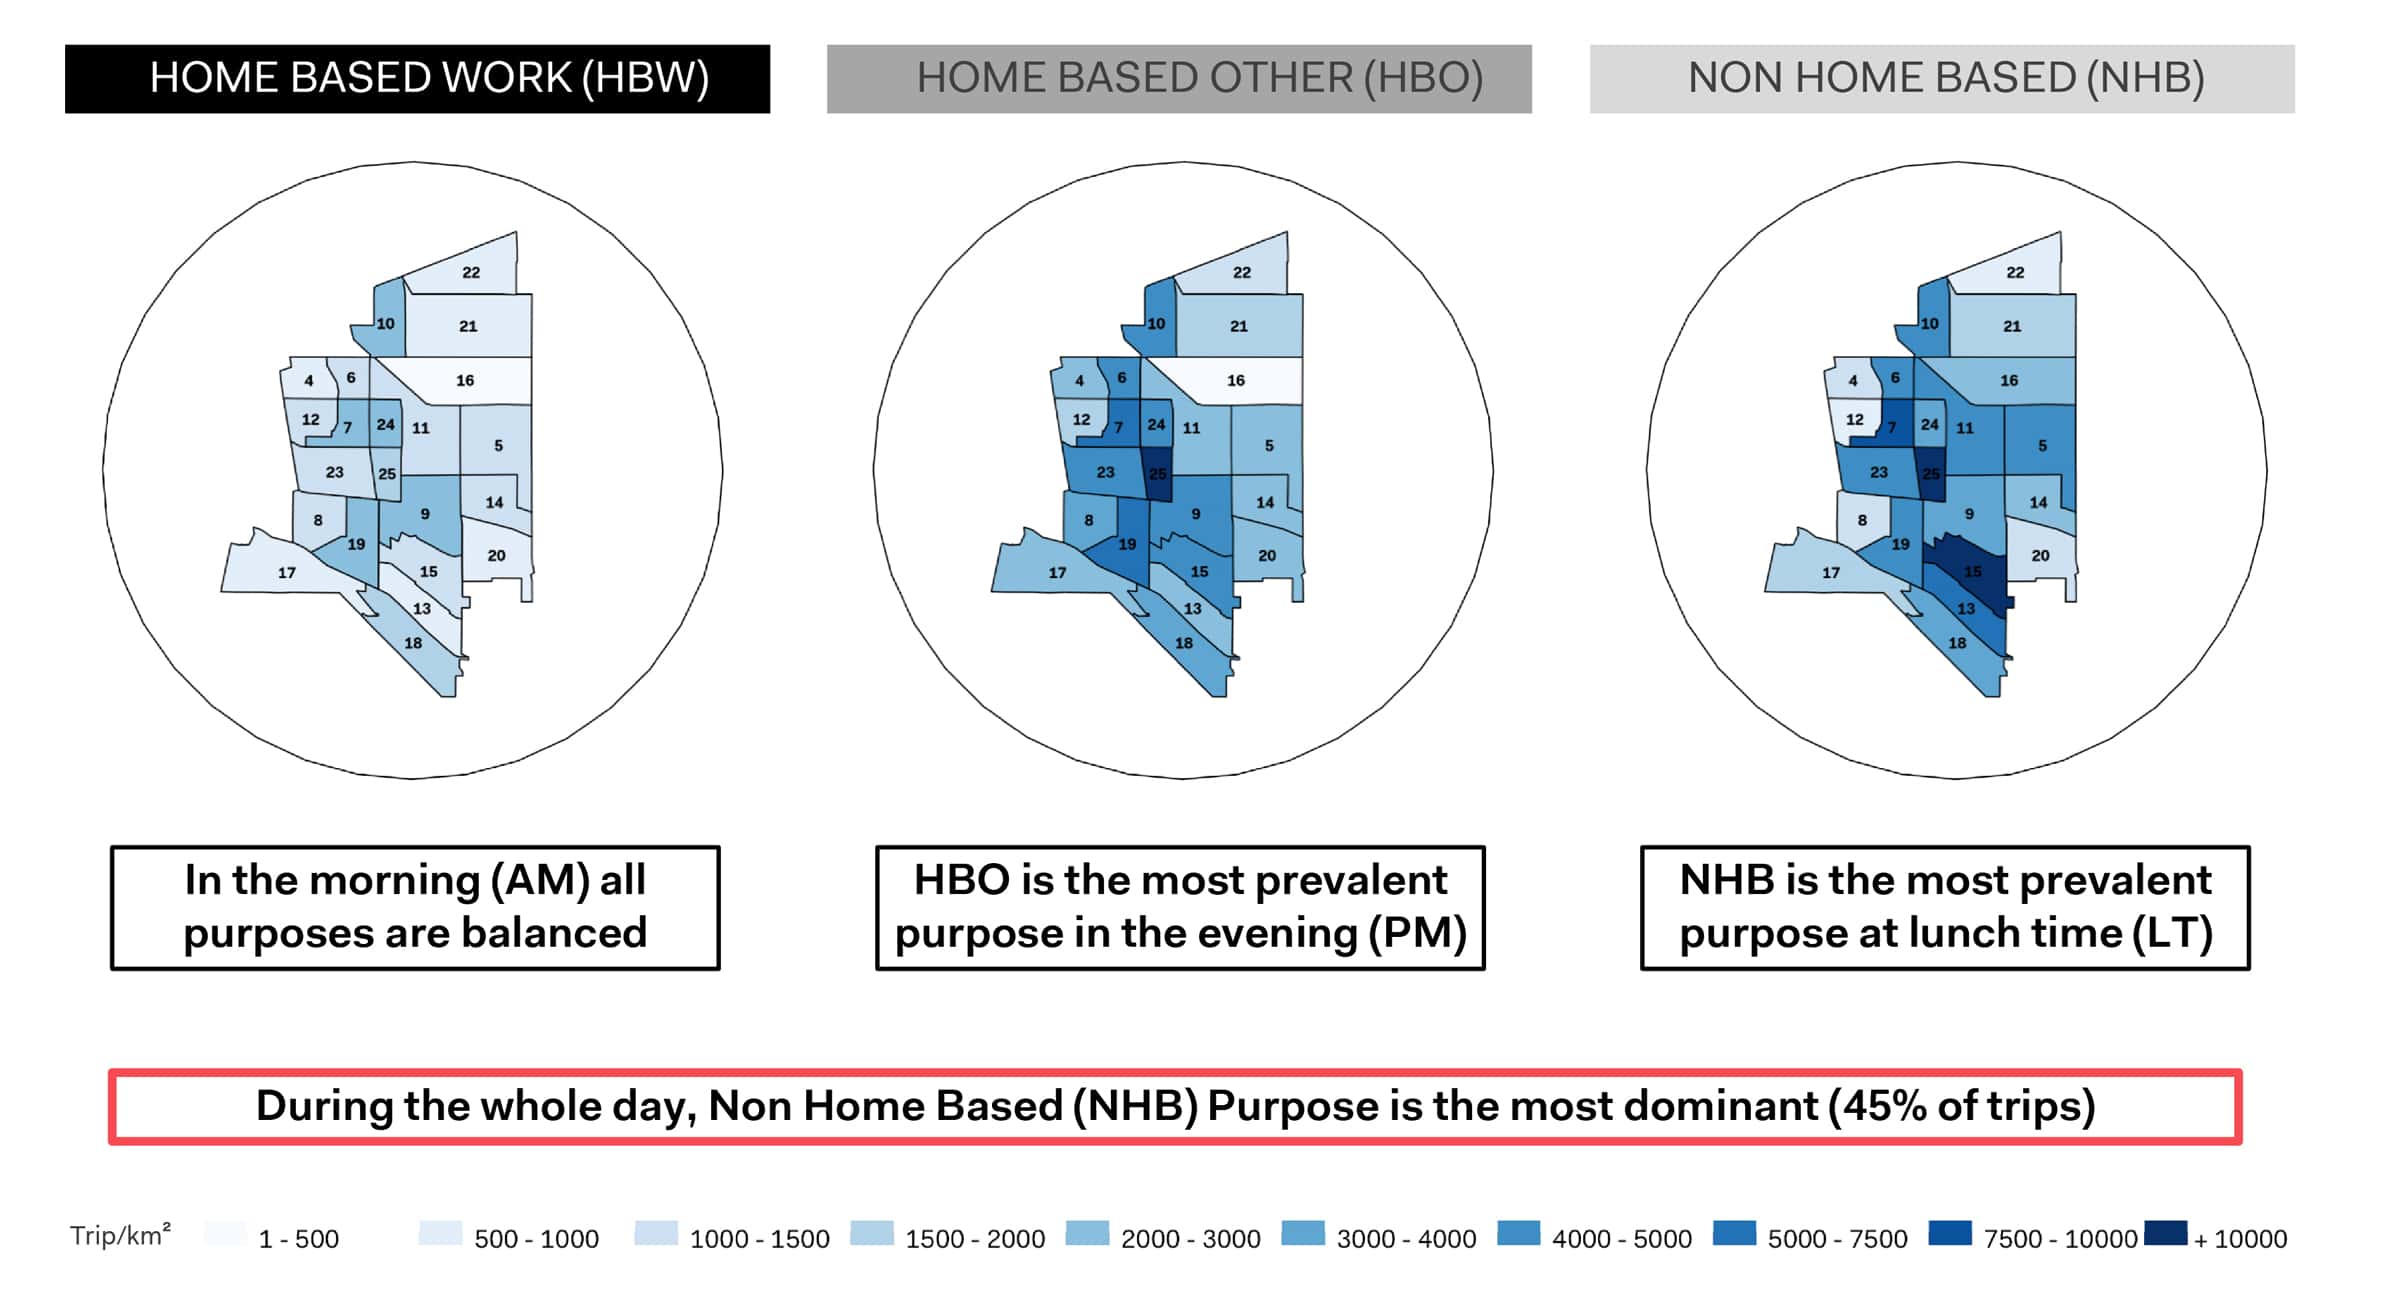
Trip Purpose data is one of the implicit analytical constructs designed for Big Data analysis. In the lack of user surveys, such qualitative information is retrieved through the use of proxy information and algorithms to infer the purpose of individual trips based on macroscale pattern analysis. These categories are broadly defined into Home-Based Work (HBW) trips, Home-Based Other (HBO) trips and Non-Home-Based (NHB) trips. An analysis of trip purpose dominance at different times of the day reveals a homogenous trip purpose across the city in the morning, a prevalence of NHB trips during lunchtime hours and a prevalence of HBO movements in the evening. Non-Home-Based trips are dominant throughout the day, making up an average of 45% of all movements in the city.
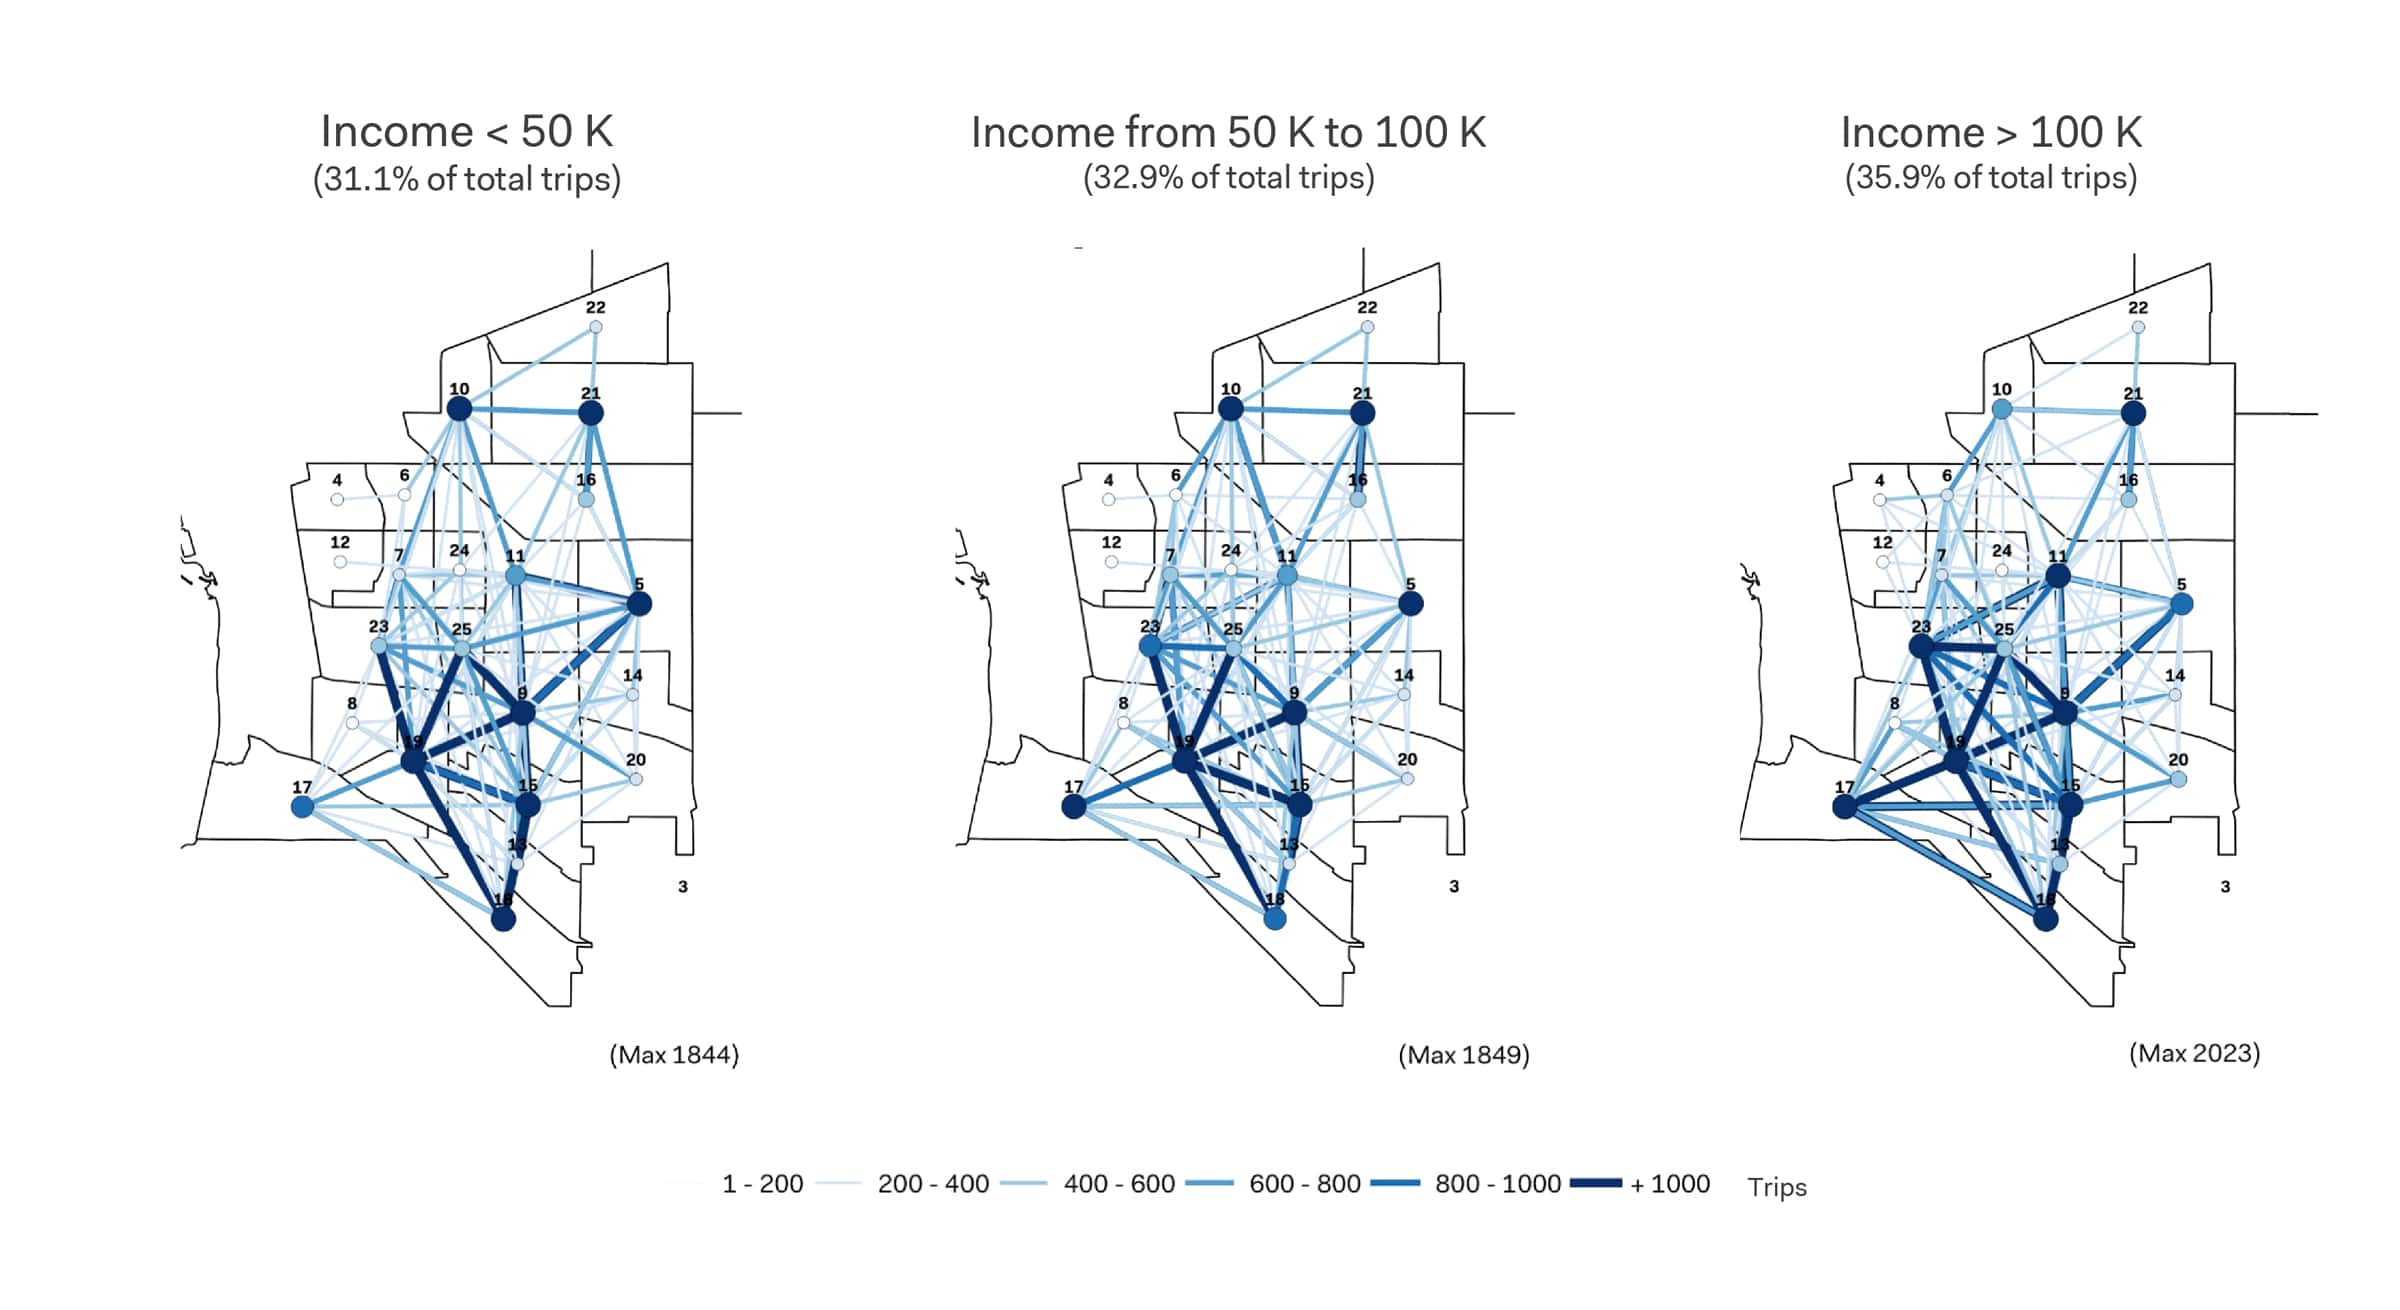
Looking at socio-economic traits can reveal shared patterns of movement between people with similar circumstances. Superimposing income data on internal movements within Torrance reveals a more or less homogenous distribution of movement density between households under the 50k income threshold, those falling within the 50k-100k income group, and those whose income is above 100k. There is no clear spatial demarcation between desire lines of the Origin-Destination patchwork of the two lower income groups. The desire lines of the highest income group have the same clustering tendencies but seem to have stronger interzonal connections within this spatial range. It is important to note in the context of this data that the median inflation-adjusted household income in 2018 in the U.S. was around $63k, while that of the metropolitan area of Los Angeles is around $73k (Guzman, 2020). Data readings that focus on income levels can help planners predict proneness to shift mobility modes based on willingness to pay and other relevant indicators, typically in favor of greener modes of transportation, such as Public Transport, active mobility and others.
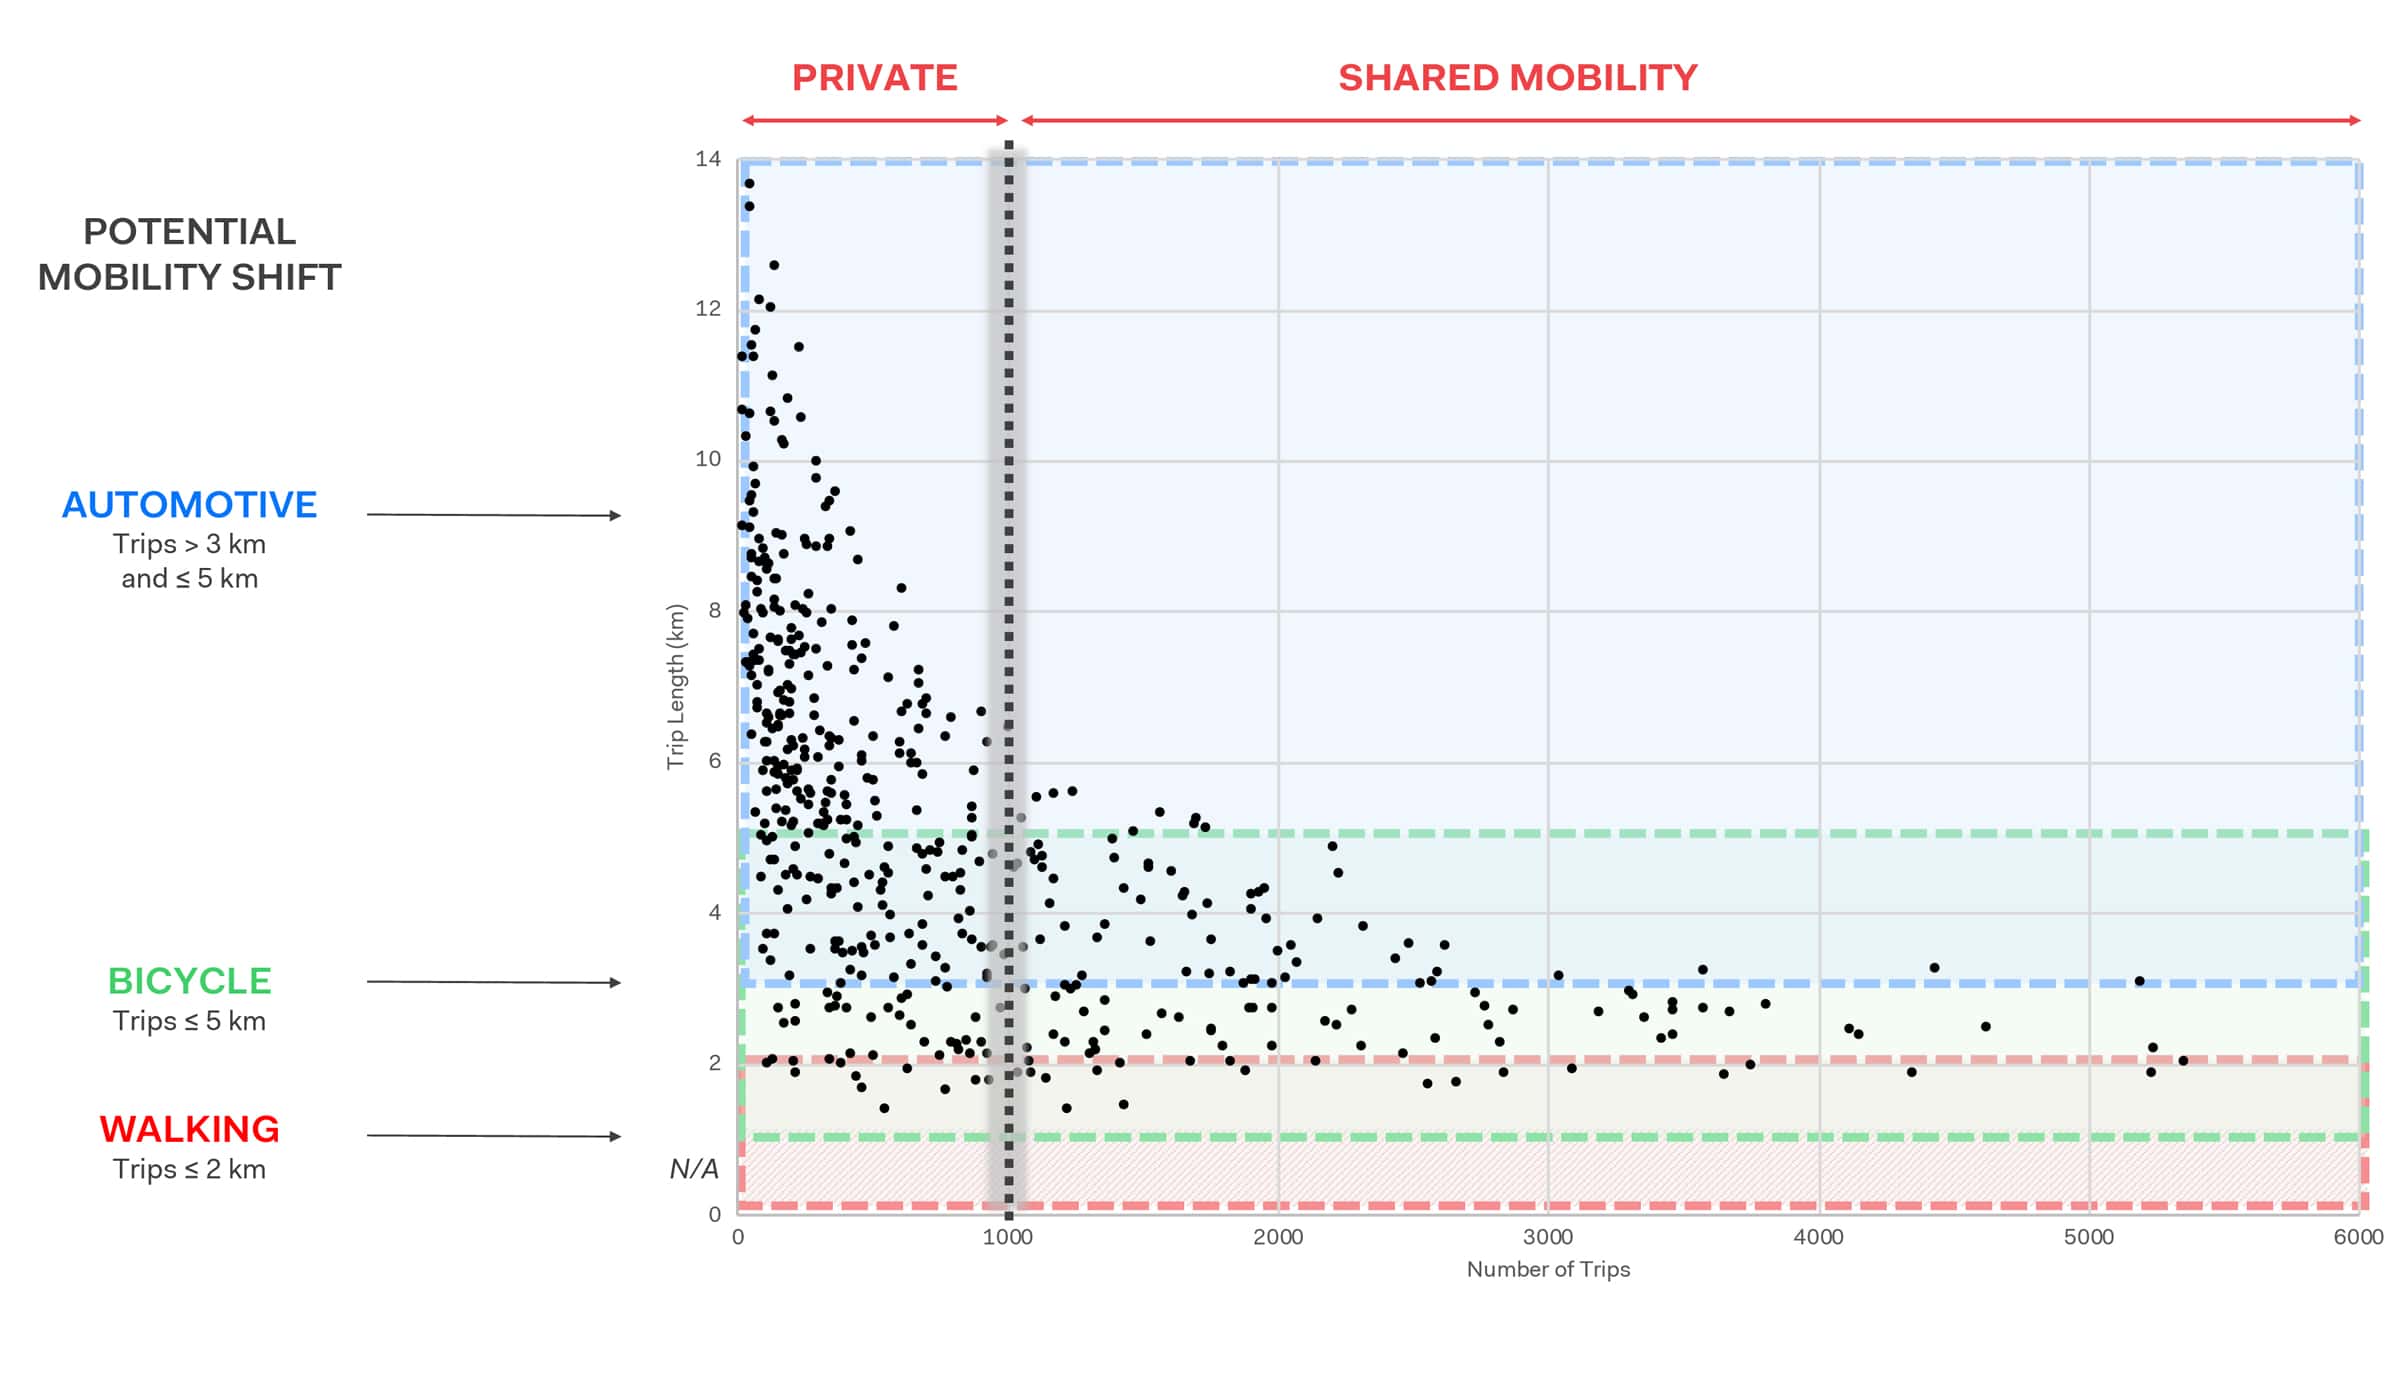
Trip length is a suitable measure to study potentials for mobility shifts from car-based modes to alternative mobility modes depending on the typical distance range of each mode. The typical ranges for automotive modes are anything above 3km, under 5km for cycling and under 2km for walking trips. Most trips are currently made by car[4] with the average trip length completed within the city found to be 3.6km. Trip distances in the range dominated by car movements can potentially be replaced by bus, those under 5km have potential to be captured by the cycling and micro-mobility market, while the shortest trips made by car (within the 2km range) can be converted to walking trips. The following chart shows the current trip distribution in Torrance by trip length and trip volume (figure 6). Higher volumes of trips within these specified ranges highlight potential markets for shared mobility services as opposed to private ones, given opportunities for economies of scale.
[4] At the time of analysis, StreetLight was not capable of attributing transport modes to movement. Today, with its StreetLight Multimode feature, proprietary machine learning is used to differentiate bike and pedestrian movement from vehicular traffic.
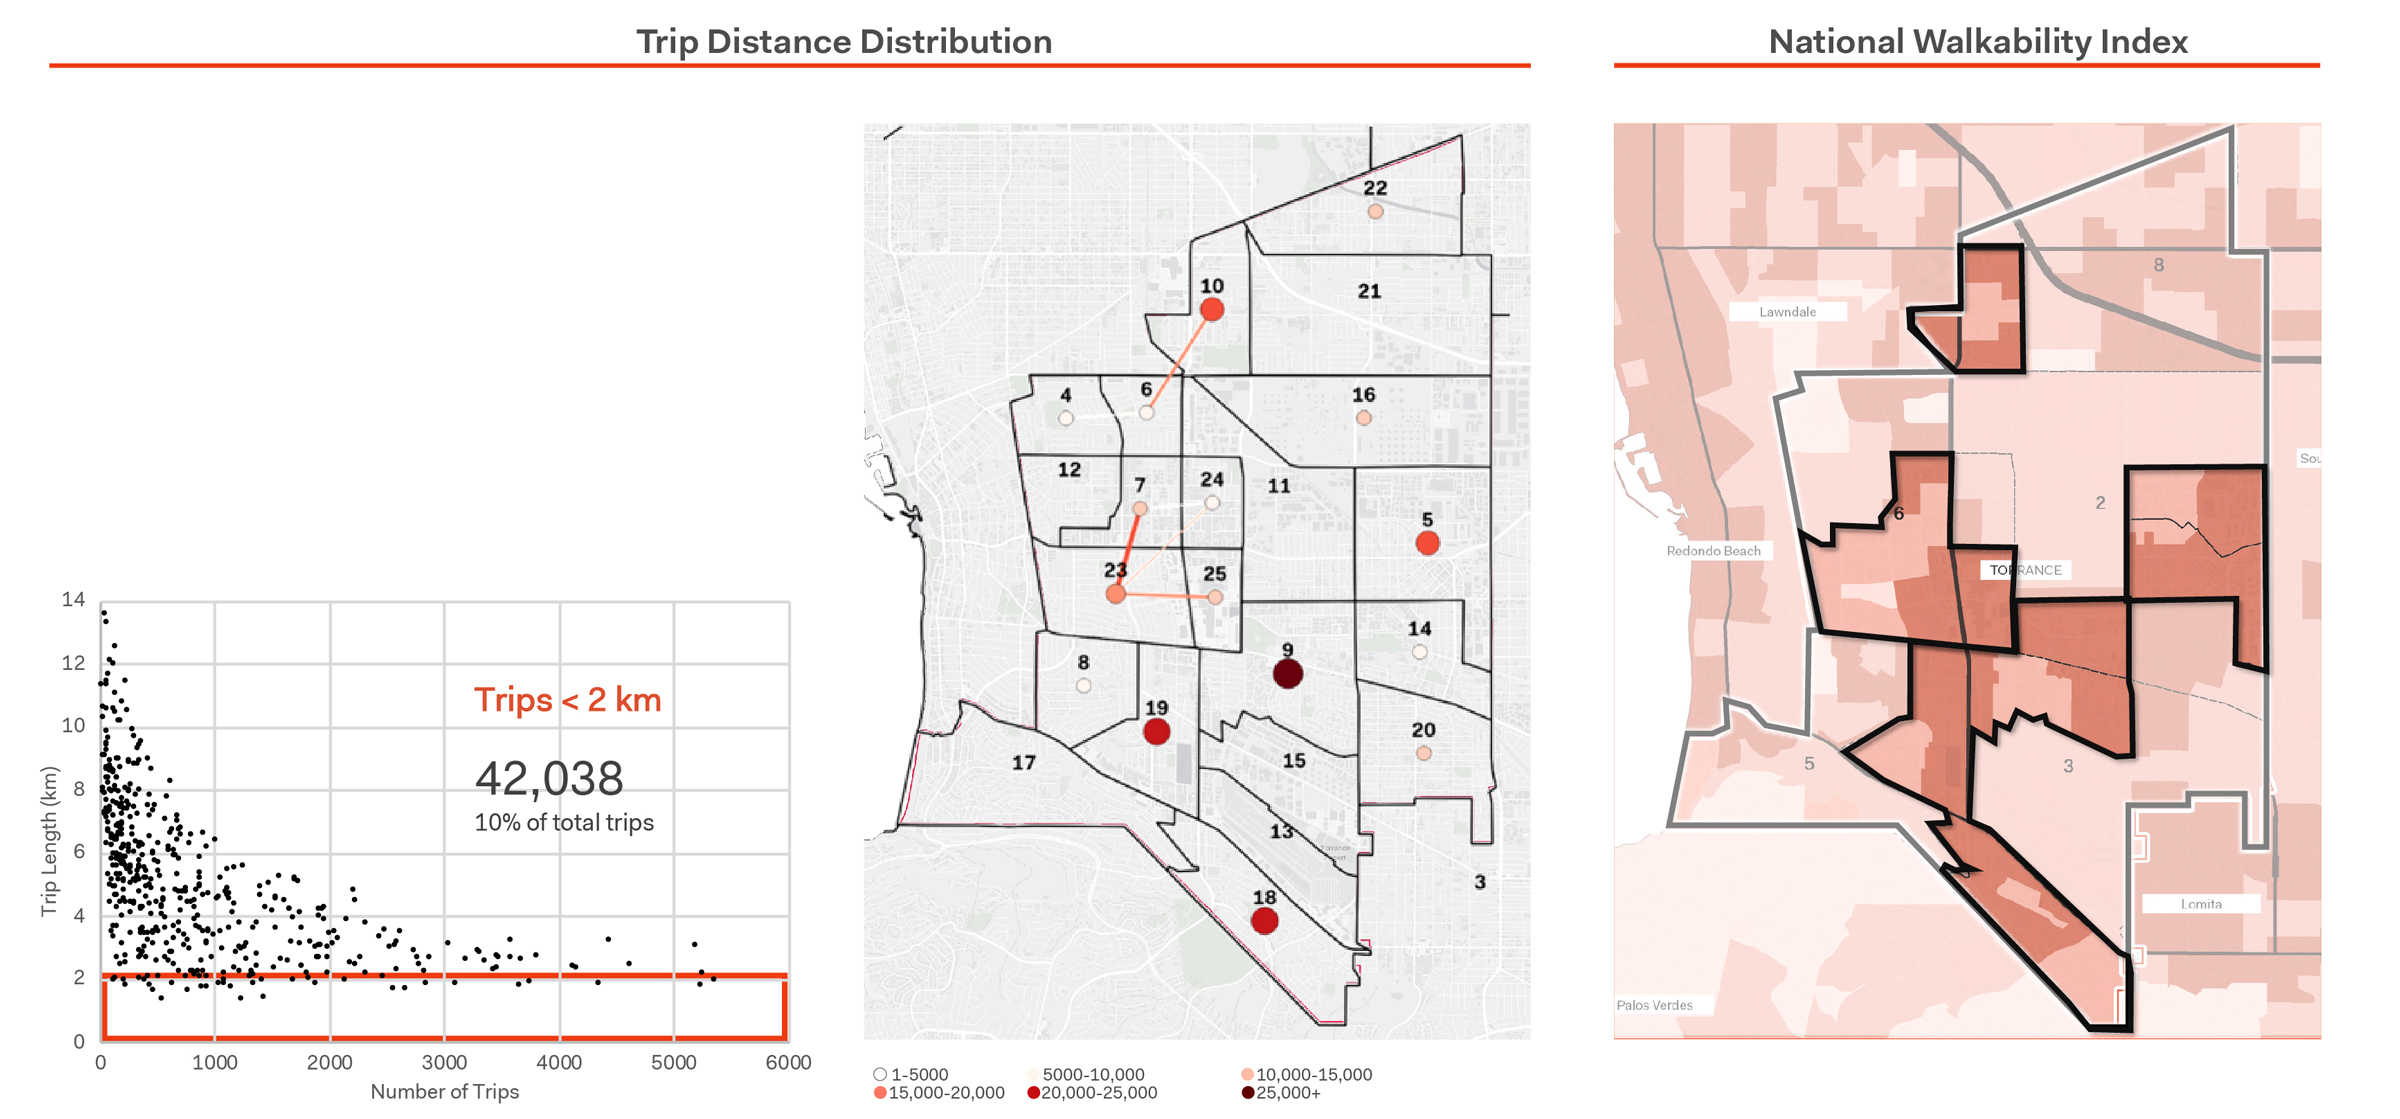
From a geospatial perspective, the distribution of trips within the shortest distance category (those under 2km) shows higher volumes in single TAZs, such as Zone 9 shown in the chart below, and in clusters of different TAZs such as Zones 7, 23 and 25. This data was further validated against zone ranking established by the National Walkability Index and the results were astonishingly positive showing high correlations between short distance trips and areas considered highly walkable. The National Walkability Index is based on the number of points of interest and the complexity of the urban grid in any particular area, making it a measure of potential walkability rather than a reflection of actual movements that take place. The provision of personal mobility vehicles in those areas with a high volume of short trips and high walkability prospects could promote a soft transition from car reliance to active modes, such as walking through a variety of low-impact, yet efficient travel modes.
Towards a demand-driven mobility strategy
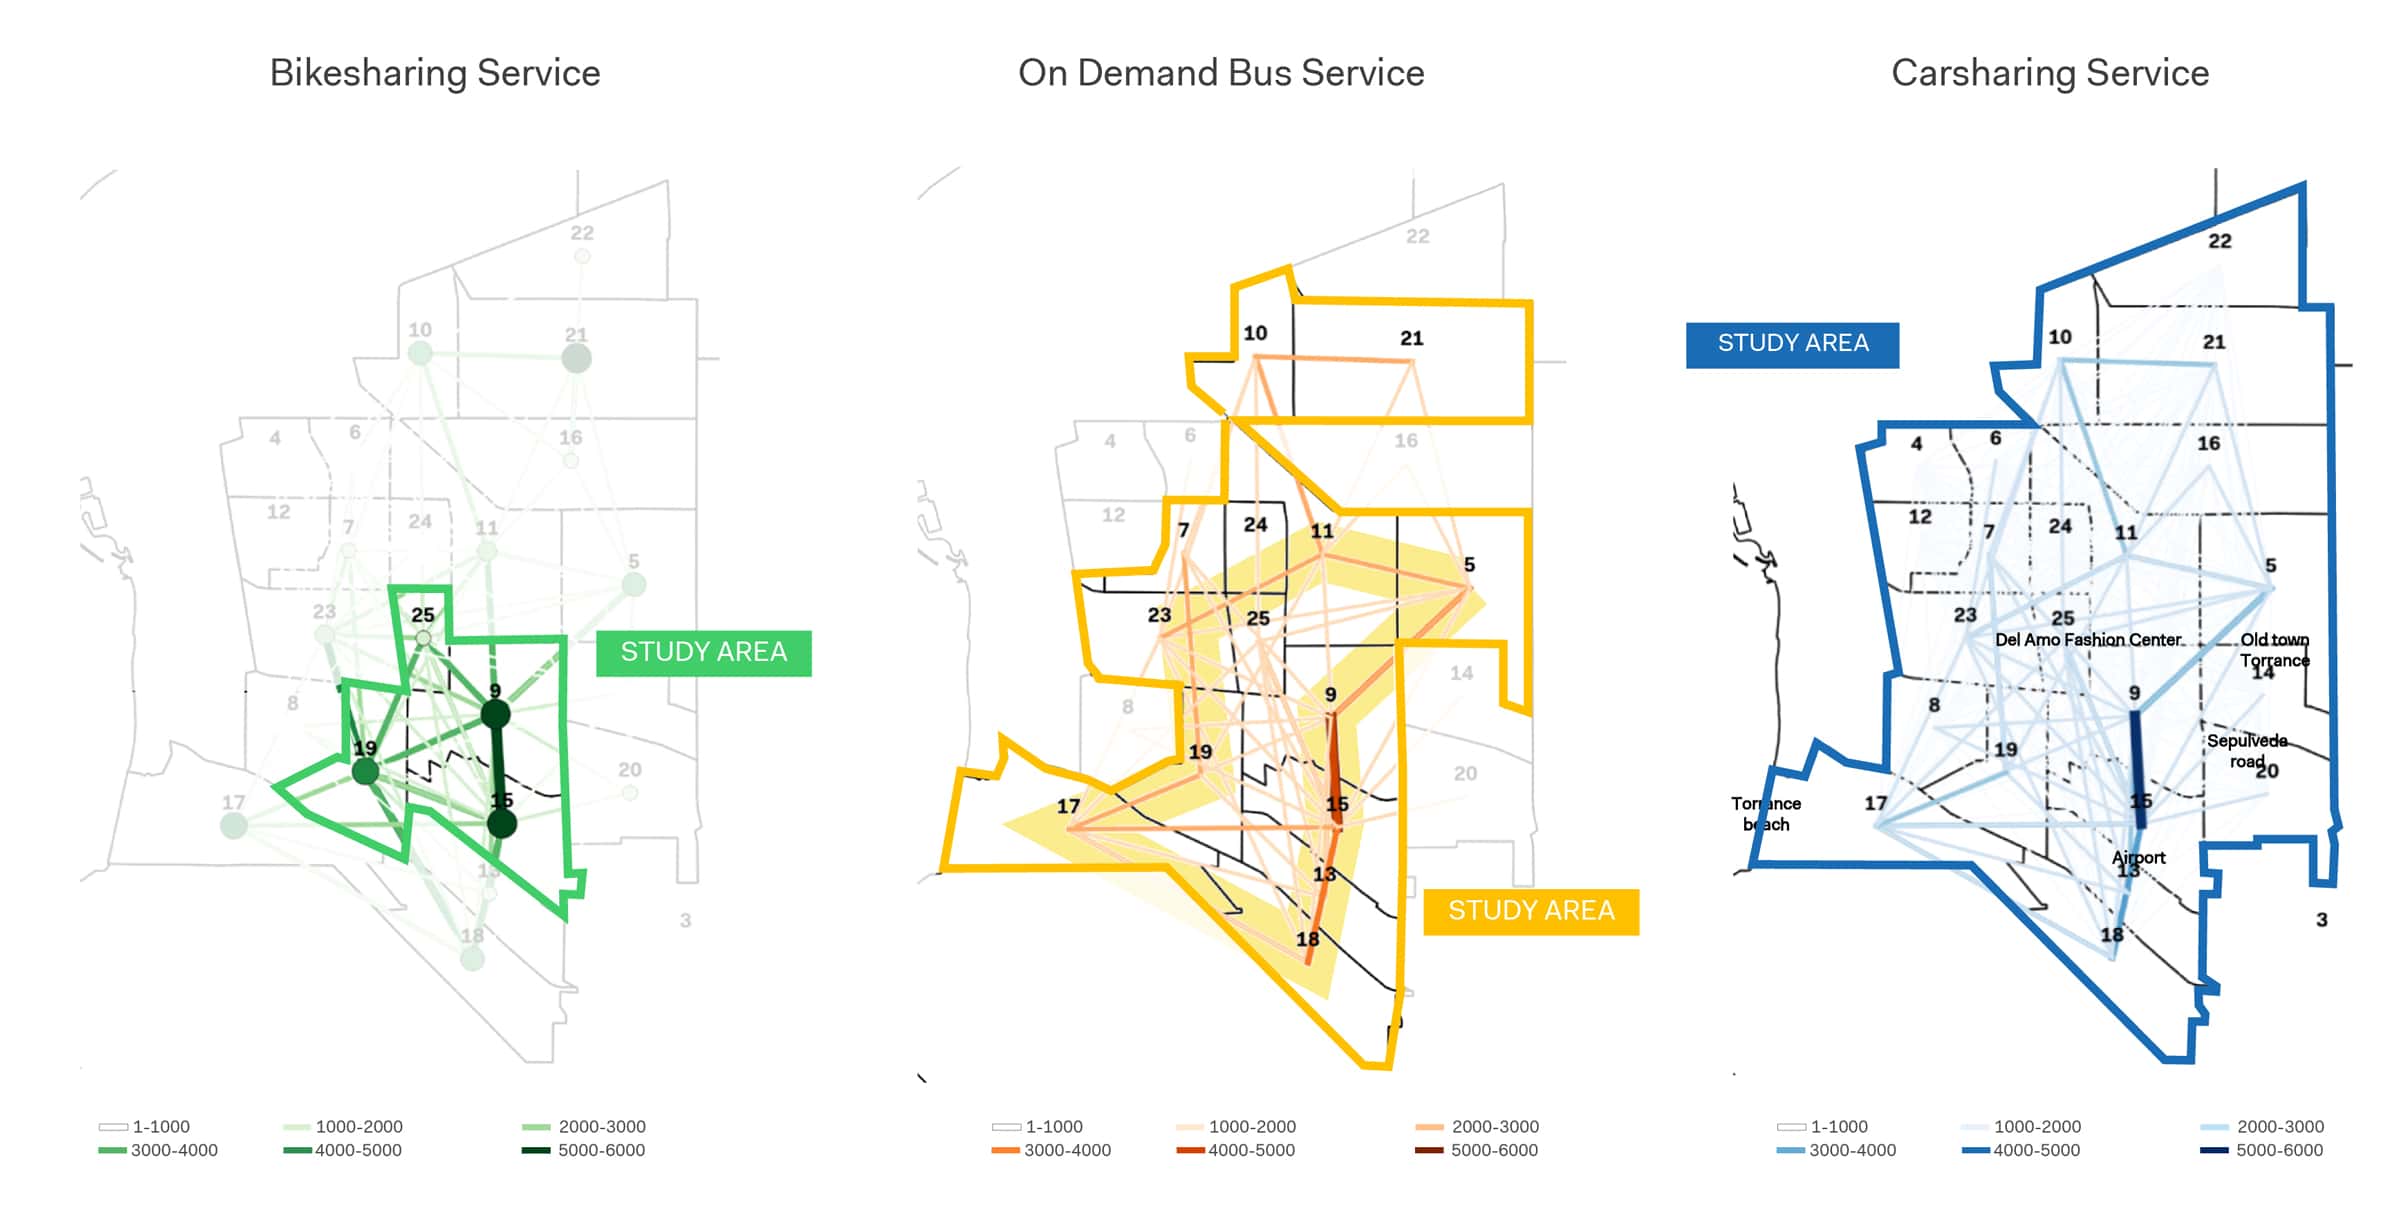
Based on these findings, Systematica defined an intervention strategy for Torrance that seeks to diversify users’ mobility choices and incentivize shared over private vehicles; nudging users away from private cars towards alternative transport modes that promote healthier lifestyles and contribute to a more sustainable city. The strategy is centered around a location-based, demand-driven approach: alternative mobility services are distributed in areas most conducive to it based on trip distance ranges already found to be most prevalent in each zone. Figure 8 highlights the different intervention areas determined for cycling and micro-mobility options (in areas with high volumes of short distance trips) and for car-sharing and on-demand bus services (in areas with high volumes of medium-to-long distance trips).
Further analysis is conducted to look at the target mobility groups for each plan and study their current movement patterns. The analysis revealed that some key target groups are more likely to make shorter-distance trips in comparison to the city average (3.6km), highlighting opportunities for user-targeted alternative mobility options. Seniors (defined here as residents Over 65), families (households with children) and commuters (short range workers) all tend to travel for shorter distances on average. Seniors, who make up about 16% of residents in Torrance, predominantly travel by car (88.8% of trips) for an average distance of 3.2km, showing strong desire lines between the neighboring zones, 9 and 15 (strong market potential). Families tend to make more localized, non-home-based, chained trips that are also characterized as being shorter in distance than the typical average (2.7km). The commuter market is another promising market given that 22% of Torrance residents commute to work internally. Home-based-work trips within Torrance show that commuters predominantly travel between particular zones where HBW trips are predominant (88%, well above the 16% city average). The average trip length in these specific zones tends to be shorter than average (3.10km), and even shorter in the areas with the strongest HBW relations (2.80km).
Based on the above findings, several pilot projects were developed in detail with the goal of promoting active transport modes. The Sepulveda Boulevard pilot was selected for walkability upgrading due to its situation in the area with the highest number of internal short-distance trips. Despite its mixed-use land use structure and the positive interactive opportunities created by active frontages, the organizational structure of the street could benefit from several improvements, including pedestrian crossing design and last-mile connections. Other pilots focused on bikeshare programs and expanded public transit options in the areas that need them.
Conclusions
While we fully believe in the benefits of Big Data and the leap achieved in only a few years since the technology’s outset, we also recognize the current limitations and obstacles that will need to be overcome before Big Data can feed into urban planning processes in an effective and reliable manner. These limitations are mainly due to the levels of accuracy of the collected data, the sample size/capture rate, distinctions of movement data by mode, and several other factors that leave the dataset with a wide margin for further structuring and system enhancement. Albeit Big Data is known to be an excellent source of data for understanding present and past travel patterns, its role in provisioning future trends and tying efficiently to traditional planning and forecast modelling tools is still limited. The study carried out for the city of Torrance was mainly conceived to transform current data into a framework for designing future policies and pilots and to identify priority areas based on movement patterns, avoiding traditional modelling approaches.
The hypothesis is that continuous, ongoing developments at the intersection of transportation planning and data analytics will ultimately optimize results to a degree whereby we could completely disregard standard methods. For the time being, Big Data analytics serve a supporting role in congruence with well-established traditional techniques. The potentials for data-based planning and forecasting tools in the future, however, transcend well beyond those currently offered by traditional methods. The sheer amount of information that can be put to use is at once confounding and exciting; making the task of the coming few years a vast yet highly fruitful challenge for the field at large. Assuming the proper socio-political channels are employed to ensure full compliance with ethical and privacy standards, data in more pockets can lead to major strides in the urban planning profession and the analytical capabilities that support them.
References
Curry, B. (2019, October 07). Which is Better? Systemic (Bottom Up) or Symptomatic (Top Down) Approach to Data Science. Retrieved December 11, 2020, from https://medium.com/@b.jamescurry/which-is-better-systemic-bottom-up-or-symptomatic-top-down-approach-to-data-science-9bae2afca518
Glaeser, E. L. (2012). Chapter 6. What’s So Great About Skyscrapers? In 1121946144 846860663 E. L. Glaeser (Author), Triumph of the City: How Our Greatest Invention Makes Us Richer, Smarter, Greener, Healthier, and Happier (pp. 135-165). New York, New York: Penguin Press.
Grogan, T. (2020, November 04). Changes to Traffic Congestion in Urban Areas. Retrieved December 11, 2020, from https://www.streetlightdata.com/changes-to-traffic-congestion-in-urban-areas/
Guzman, G. G. (2020, September). Household Income: 2019 – American Community Survey Briefs. Retrieved December 11, 2020, from https://www.census.gov/content/dam/Census/library/publications/2020/acs/acsbr20-03.pdf.
Jacobs, J. (1961). The Death and Life of Great American Cities. New York, New York: Random House.
Jones, C. (2004). Paris, the biography of a city. New York, New York: Viking.
Mehaffy, M. (2019, December 10). Cities are like brains-immense networks of connective tissue. Retrieved December 11, 2020, from https://www.cnu.org/publicsquare/2019/12/10/wonders-urban-connectome
Milne, D., & Watling, D. (2019). Big data and understanding change in the context of planning transport systems. Journal of Transport Geography, 76, 235-244.
Pew Research Center (2019). Mobile Fact Sheet. Retrieved December 11, 2020, from https://www.pewresearch.org/internet/fact-sheet/mobile/.
Statista (2019a). Smartphone ownership rate by country 2019. Retrieved 2020, from https://www.statista.com/statistics/539395/smartphone-penetration-worldwide-by-country/.
Statista (2019b). Number of smartphone users worldwide from 2016 to 2021. Retrieved December 11, 2020, from https://www.statista.com/statistics/330695/number-of-smartphone-users-worldwide/.