
Affordable housing is an integral aspect that determines the level of equity, for it to function sustainably, it is important to ensure that these units are placed in high-opportunity neighborhoods, that provide good proximity and accessibility to essential social determinants. Public transport acts as an equalizing factor for connecting people with opportunities. Therefore, easy access to good and affordable public transport is crucial in building thriving communities. In this framework, the research aims to implement an Urban Informatics approach to leverage open data to assess the fairness of accessibility with public transit for the affordable housing stock of New York City. In particular, transit-based accessibility statistics are calculated by developing catchment analyses from each grid cell representing housing and affordable housing. These results are used to devise a set of indicators to measure the potential to reach important social determinants, such as health and education facilities, and the number of available jobs. The resulting accessibility scores are evaluated in comparison with the household income data to assess the fairness of public transport for the city’s affordable housing stock, with the goal to provide a basis to aid the decision-making process for locating future affordable housing units in the city.
Introduction
Affordable housing is known to have a significant influence on the economy, health, and education conditions of a city (Bardales et.al., 2021). However, physical quality, accessibility, and neighborhood conditions are major factors that need to be considered while planning for affordable housing. Mayor’s Housing New York Plan (NYC, 2014) was proposed as an integrated approach to producing more high-quality affordable housing by improving affordable housing opportunities, fostering diverse liveable neighborhoods, and promoting healthy, and sustainable design (NYC, 2022).
Currently, affordable housing is defined as housing where the rent or purchase price is set at a level that is affordable to households earning no more than 80% of the Area Median Income (AMI), but in general demographic characteristics that are often compatible with affordable housing include low-income households, individuals with disabilities, seniors, and families with children. One of the key concerns for affordable housing residents is access to public transport. According to a study conducted by the Regional Plan Association (Calvin, 2022), many low-income neighborhoods in New York City lack adequate public transportation options. The study found that only 14% of affordable housing units in the city are located within a quarter-mile of a subway station, compared to 33% of market-rate housing units. This lack of access to public transport puts affordable housing residents at a disadvantage, making it harder for them to access jobs, healthcare, and other essential services.
In addition to this, transportation is considered the second largest household expenditure, and its related costs are directly linked to key characteristics of housing, such as location which involves proximity to employment, education, and health (Crowley, 2003). Ease of mobility is one of the major parameters that determine the quality of life in any community, as good access to cheap public transport and good last-mile connectivity is very important to build a successful and affordable neighborhood. High opportunity bargain neighborhoods with lower rents than expected tend to be more affordable. Even though they provide access to social determinants such as health and education facilities, they lack amenities such as restaurants and proximity to city centers that are associated with higher rents (Kelly and Ellen, 2022). However, affordable housing is usually located in low opportunity neighborhoods, curbing the economic growth of the residents for as long as they are forced to live there.
On the other hand, improving these low opportunity neighborhoods usually leads to displacement (Ellen and O’Regan, 2010) and solving this conundrum has always been challenging for policy makers. In particular researchers believe that affordable housing and community engagement in transportation planning are critical components in preventing displacement. Additionally, policymakers are urged to collect and monitor data, use policy tools to address this phenomenon, and provide support for those who are displaced (U.S. Department of Housing and Urban Development, 2018).
Given this complex context, the aim of this research is to quantify the fairness of transit accessibility by comparing the accessibility to social determinants of the affordable housing stock to the average situation. The determinants considered in this study are devised with the objective to include bare essential services, namely the job opportunities, the health facilities and the education facilities. This list could be expanded to include additional destinations usually considered as important city features, aimed at supporting all the aspects of daily life, such as local shops, neighborhood services, sport facilities, community services, cultural services, etc. (Allam et.al., 2022).
Related Works
The relation between the urban accessibility and social disparity has been studied with different angles as it is extremely evident how a complex environment such as New York City tends to range widely between central and well-served communities, to segregated and remote places. In particular, El-Geneidy et al. (2016) examined the relationship between transit accessibility and social disparity using transit fares and travel time as indicators. They state that transportation services such as public transit provide access to opportunities like jobs and services, and that not all residents have equal access to them. Specifically, low-income and socially disadvantaged individuals are more likely to be transit-dependent and face greater barriers to access, therefore accessibility measures like cumulative opportunities can help assess the level of opportunities residents in a region can reach. The paper evaluates the level of accessibility to jobs using public transit for people residing in socially disadvantaged neighborhoods in Montreal compared to those living in other neighborhoods, accounting for hourly wages and transit fares as important constraints on accessibility.
In order to quantify the accessibility of public transport, several indexes were considered, as many were developed during the years with the goal to measure and compare the accessibility of different locations. The most widely used are summarized in the list:
- Public Transit Accessibility Level (PTAL), which measures the level of access to public transport services within a specific area by assigning a score from 0 to 6, where 0 indicates very poor access, and 6 indicates excellent access. This index takes into account the frequency, speed, and distance of public transport services in the area (TfL, 2010).
- Access Across America, which was developed by the Accessibility Observatory at the University of Minnesota, USA and it measures the accessibility of a location to jobs and other essential services by different modes of transport, including walking, cycling, and public transport. This index takes into account the travel time, waiting time, and transfer time for each mode of transport (Levinson et al., 2013).
- Accessibility to Opportunities (ATOS), which was developed by the Transport Studies Unit at the University of Oxford (UK) and it measures the accessibility of a location to employment opportunities, shops, and services by different modes of transport, including walking, cycling, and public transport. This index takes into account the travel time, waiting time, and transfer time for each mode of transport (TfL, 2015).
- Comprehensive Public Transport Service Accessibility Index (CPTAI) measures the accessibility of public transport services, based on the two concepts of degree centrality and gravity model. It calculates the degree centrality of each stop and the gravity model of the flow of people between stops, considering the number of routes passing through each stop, the distance to other stops, and the population density around them. This makes it a comprehensive approach to measuring accessibility that takes into account availability, proximity, and demand for public transport services (Yang et al., 2019)
Enabling Data and Methodology
In order to build an accessibility index, here called Access Score (AS), the research aims to measure the cumulative opportunities of access from each point of the urban environment. In particular, cumulative opportunities is defined as the number of social determinants that can be accessed using public transport within a given time threshold. For the scope of this project, the selected threshold is 45 minutes, which was selected after considering site-specific factors such as the extension of the case study and the overall high permeability of service access points.
In particular, several social determinant factors were selected (see Table 1), namely: (i) School facilities (Sch), (ii) Health facilities (Hea); (iii) Hospital beds (Bed); and (iv) Jobs (Job). Specifically, the school dataset (Sch) includes all the pre-university schools and is weighted by the 2021-2022 year enrollment numbers to describe effectively the relative importance of each institute. The health facilities determinant (Hea), on the other hand, is the count of health-related services included in the Article 28, Article 36, Article 40, and Article 7 of the Health Facilities Information System (HFIS), which includes and is not limited to: nursing homes, diagnostic treatment centers, home health care agencies, adult care facilities, etc. The hospital bed dataset (Bed) is describing the hospitals, weighted by the number of beds per each structure. Finally, the Jobs data (Job) is describing the number of jobs present in each Census Block.
In addition to the social determinants, other data sources were used to describe the following city characteristics (see Table 1): (v) regular housing structure (H); (vi) affordable housing structure (AH) structure; (vii) public transport network (GTFS data); and (viii) income level of the analyzed areas (ACS data). All data were then summarized on a regular hexagonal grid using the Uber’s Hexagonal Hierarchical Spatial Index (2018).
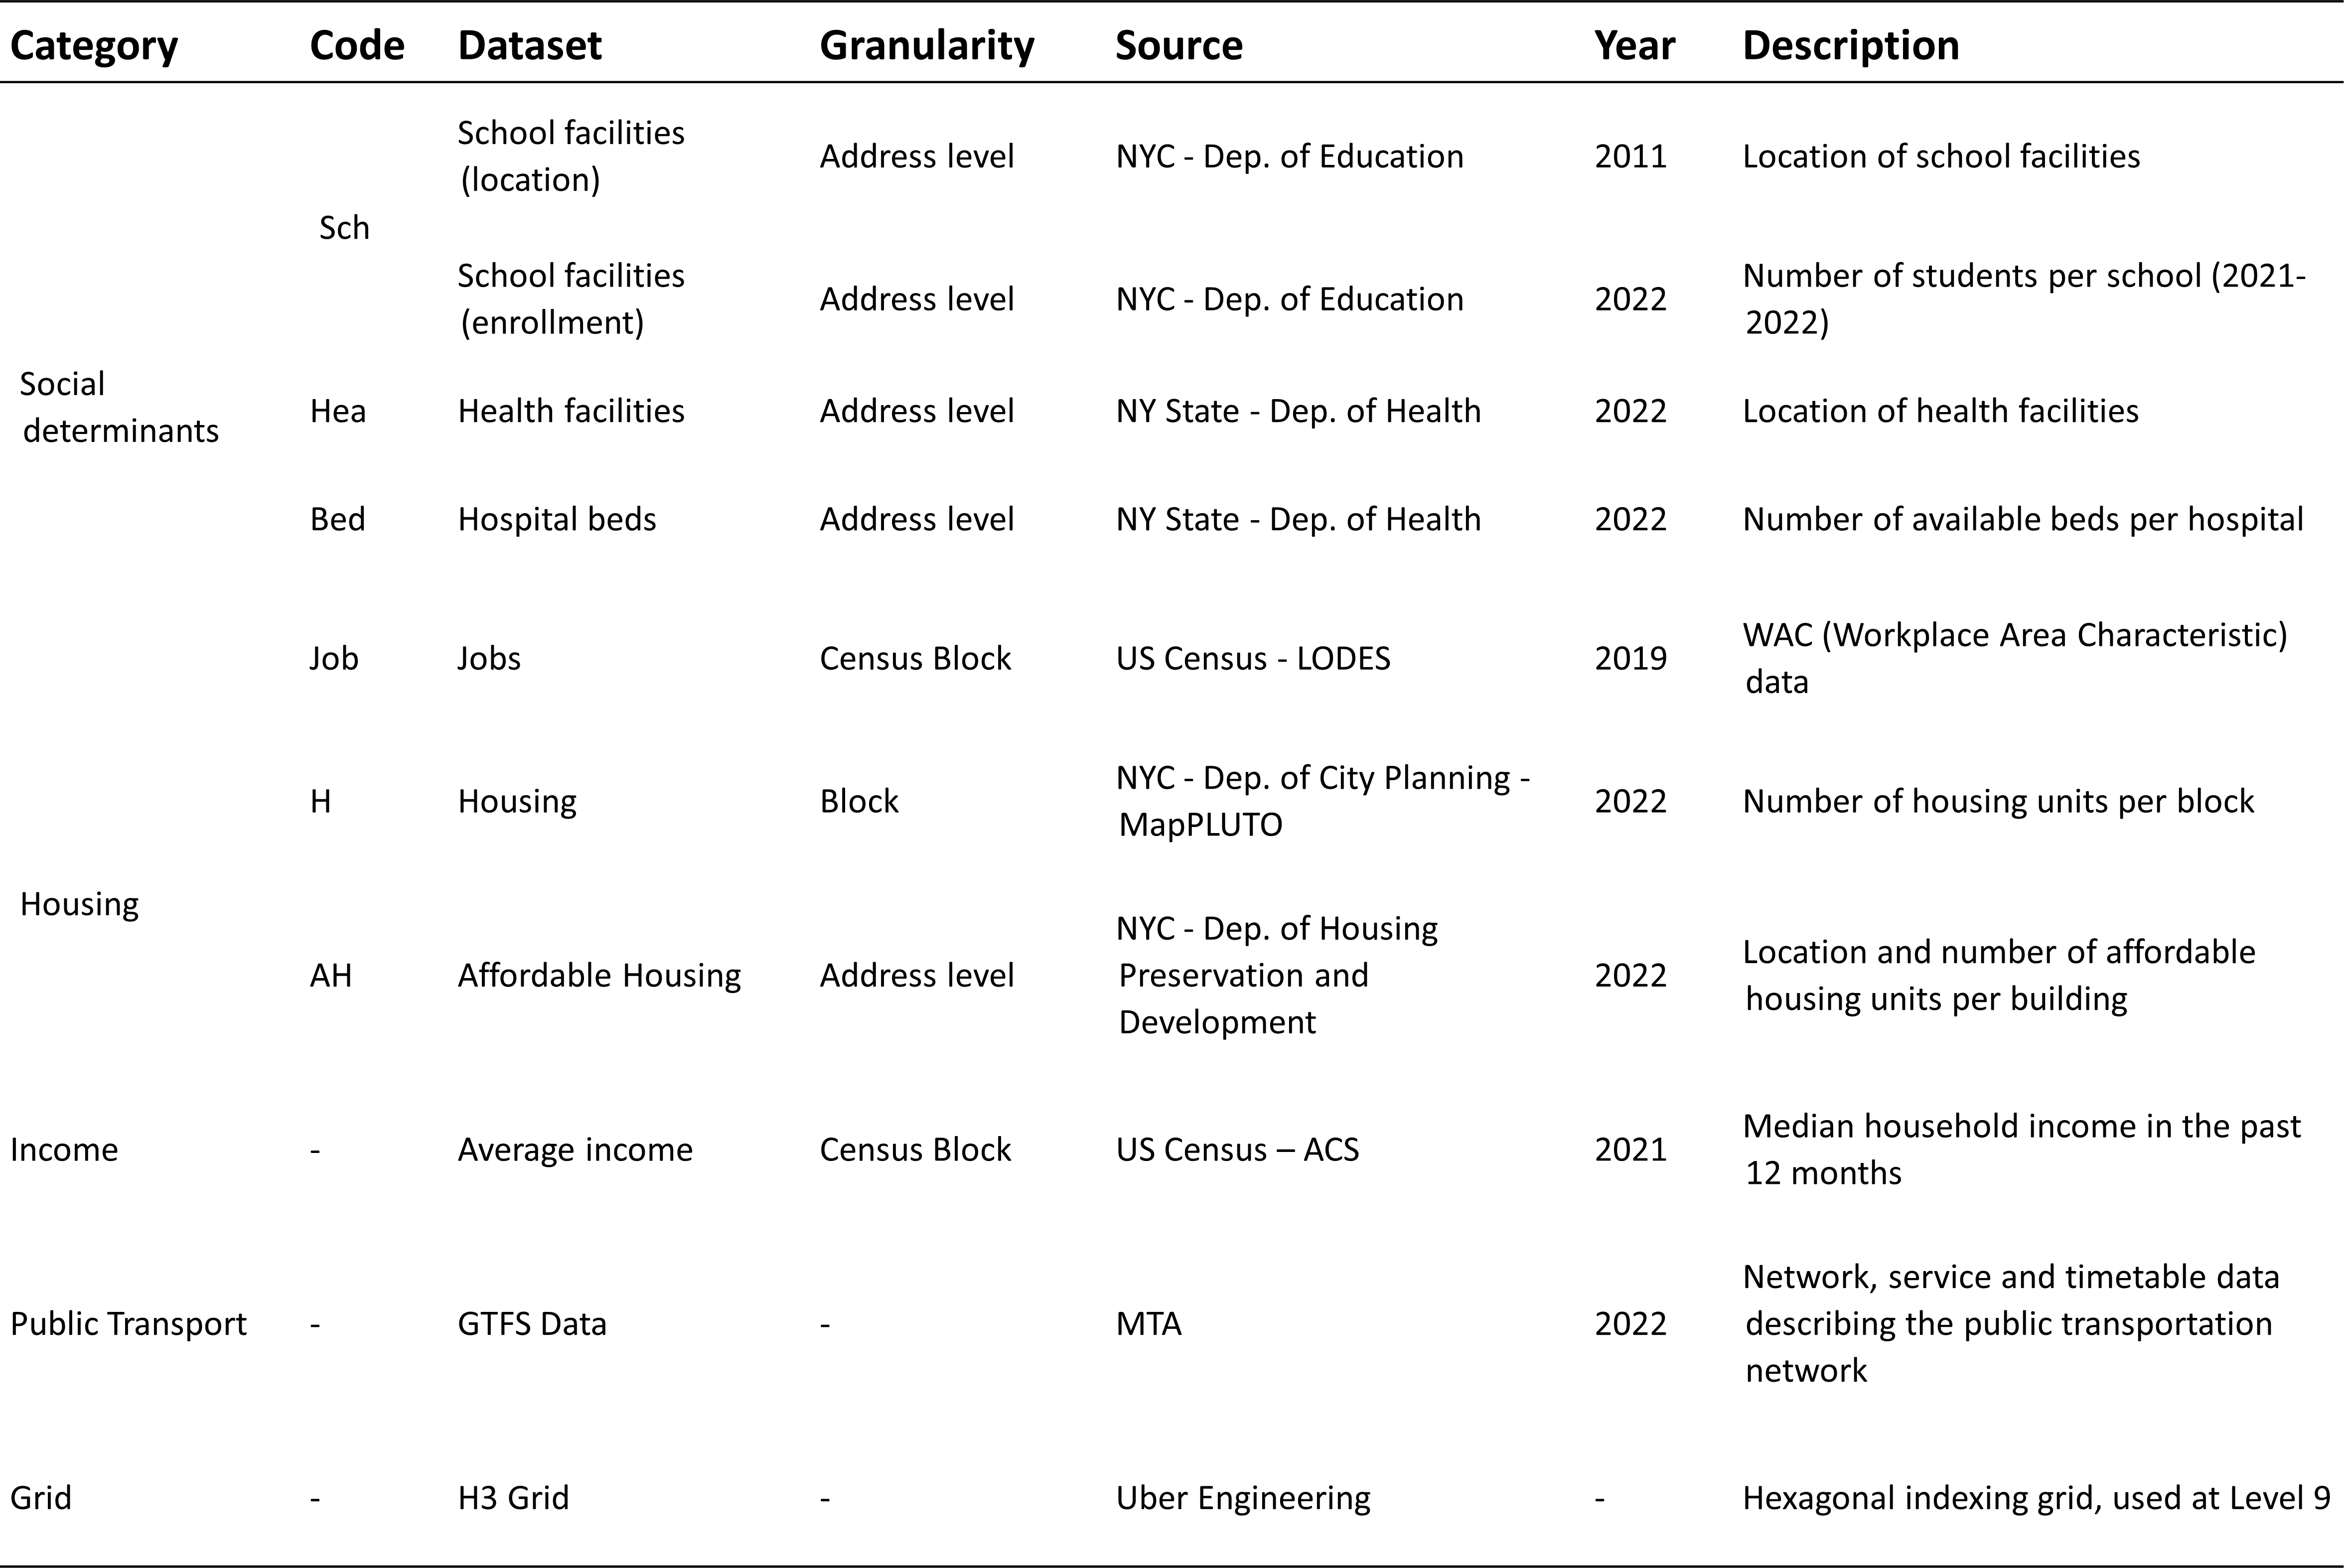
All the datasets listed in Table 1 have been re-calculated on the H3 grid at a level 9 resolution, as the average radius of each cell is about 200 meters and allows for a normalization of the geographical extent of the datasets of various granularity. Figure 1 shows the social determinants mapped on the grid cells, and it’s possible to appreciate how different is the distribution among the considered services. In particular, the dataset related to the hospital beds (Bed) shows a higher density in Manhattan compared to the other boroughs.


Figure 1 Geographical distribution of the Social Determinants datasets
Subsequently, an additional segmentation of the Affordable Housing (AH) dataset was considered, by adopting the same official classification proposed by the Department of Housing Preservation and Development (HPD). This segmentation is based on the affordability of the rent in relation with the Area Median Income (AMI), specifically these classes were considered: (i) Extremely Low Income Units (AH_EL) affordable to household earning from 0 to 30% of the AMI; (ii) Very Low Income Units (AH_VL), affordable to household earning from 31% to 50% of the AMI; (iii) Low Income Units (AH_L), affordable to household earning from 51% to 80% of the AMI; and (iv) Other Income Units (AH_O), including the rest of available units. Table 2 summarizes the descriptive statistics of affordable housing and Figure 2 shows the number of H and AH units per hexagon cell.


Figure 2 Geographical distribution of the Housing (H) and Affordable Housing (AH) datasets
The methodology to build the AccessScore (AS) for each social determinant is based on network analyses performed using the GTFS data available for NYC. In particular, the goal is to quantitatively measure cumulative opportunities of access from each cell containing housing. To do this, a series of catchment analyses were performed, simulating the accessibility from each cell containing housing and affordable housing in 45 minutes of travel. Being built with the GTFS and the underlying pedestrian network, the analysis considered both the walking time to reach a transit access point and the waiting time related to the mode. These catchment areas were then intersected with the number of social determinants and binned to the initial hexagon cell to quantify the number of accessible facilities from a known number of housing units in the defined amount of time.
Results
The results of the cumulative social determinants analysis is shown in Figure 3, and it is possible to see how the distribution varies both in relation to the transportation network and in relation to the spatial location of each social determinant category, resulting in four different outcomes.


Figure 3 Distribution of AccessScore (AS) per each Social Determinant
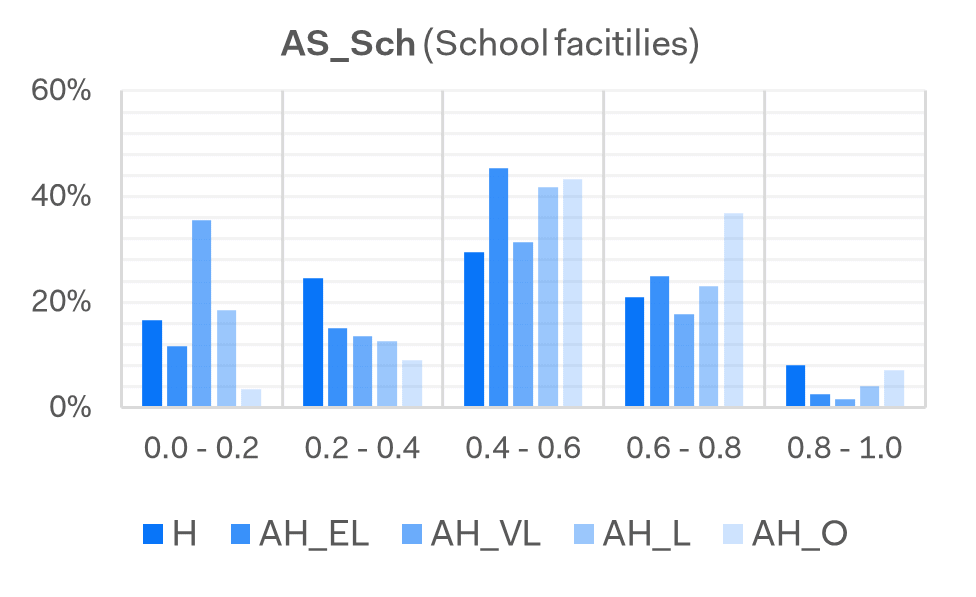
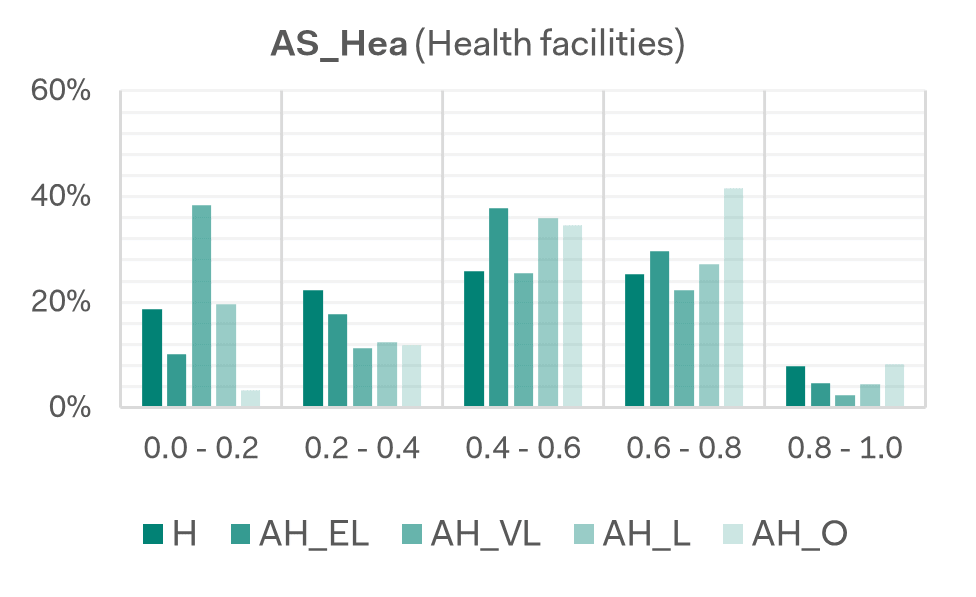
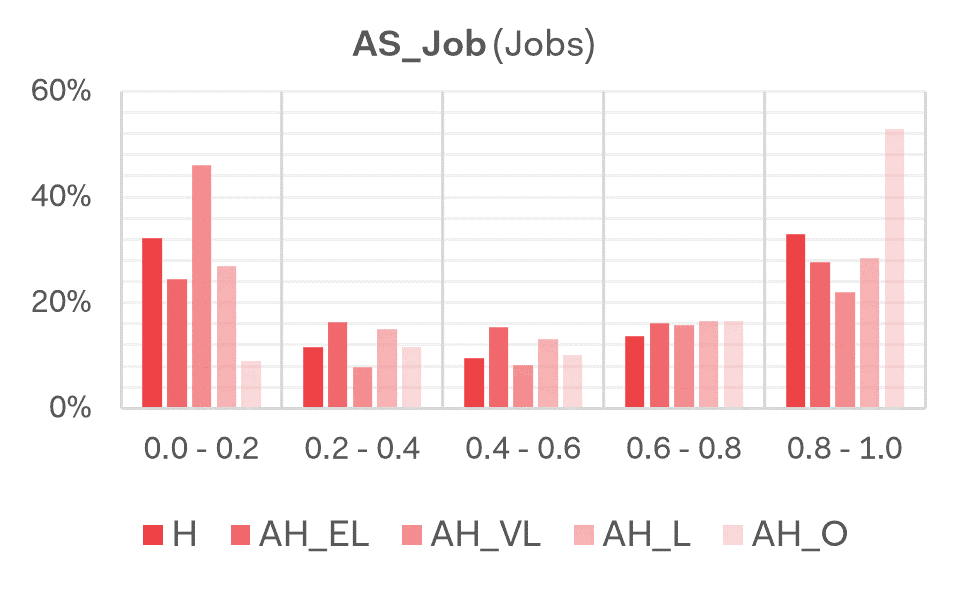
The AccessScore (AS) of each social determinant is segmented into linear interval brackets ranging from the lowest to the highest value, resulting in the 5 intervals shown in Figure 3. This segmentation is used to evaluate how many housing (H) and affordable housing (AH) units are falling into each AS range, enabling the comparison between each typology of housing and each social determinant. The intersection of these outcomes is shown in Figure 4, where the bars show the percentage of the housing stocks that falls into each AS bracket.

As visible in Figure 3 and Figure 4, the AccessScore (AS) has an identifiable spatial pattern, which follows the structure of the public transport system of New York City, that is Manhattan-centric. Making an exception for Staten Island, which acts as a lower outlier in respect to the rest of the city since it is connected only by ferries, all the main transit routes, especially the metro system, connect the city by passing through Manhattan. This is visible in all the AS maps, as it is unrelated to the distribution of the social determinants. In addition to this, it’s possible to appreciate how much the AS follows the metro system structure and the bus system plays a minor role in connecting the communities. This is valid a city-level scale analysis, such as the one presented in this research, while in a neighborhood analysis, the outcome would probably favor the latter.
The peripheral effect described above and shown in the maps is validated partly by the chart visible in Figure 4, as the AS score is intersected with the number of housing units. From the charts, it is evident how the affordable housing dedicated to the Very Low Income is the one with the poorer accessibility, resulting in the higher number of the lower AS bracket in all categories. Another interesting insight from the charts is that the school facilities AS is more balanced around an average distribution, with less units in the low and high brackets. The health facilities results follow a similar pattern, as both social determinants are more evenly distributed among the boroughs. The job determinant, on the other hand, follow the opposite patterns, with most of the units falling into the two extreme brackets, this could be explained by the fact that the job dataset is following the same structure as the transit system, with most of the opportunities being in Manhattan, ensuring a very good accessibility to a large portion of the population and a very bad accessibility to the other large portion.
Discussion
As the charts shown in Figure 4 demonstrate a different distribution patterns among the AS brackets and the housing typologies, it was considered important to add another layer of analysis to this research, comparing these outcomes to another measure that’s extremely relevant in relation to affordable housing, the average household income.
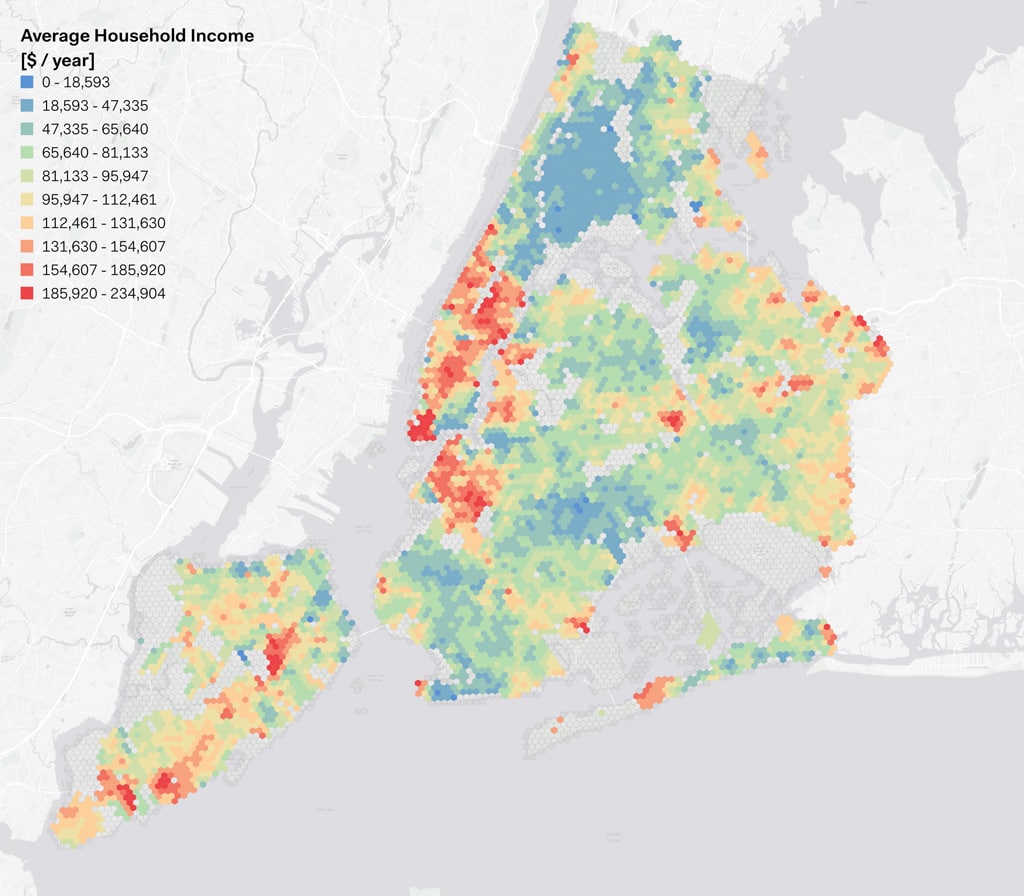
As shown in Figure 5, the income distribution in NYC follows a different pattern from the distribution shown before, while still being Manhattan-centric. From the map it is possible to appreciate how high and low income areas are seldom side by side, or how remote places are characterized by generally higher income. This can be explained by the history of city development and policy changes, where site-specific policies were often implemented in a framework of physical segregation and community discrimination. Therefore, dissecting the charts shown in Figure 5 by adding the income lens, allows the understanding of how these spatial patterns are related to the financial situation of the households.
In particular, in Figure 6 it is shown the deviation from the mean income for each housing typologies and AS bracket. The bars show the deviation from the mean (which for NYC is around 89,000 $ / year) of the average income of each housing typology. Unsurprisingly, the Extremely Low Income affordable housing has the lowest value at -31%, and the other typologies follow closely. Intersecting this with the AS brackets shows how the highest bracket (0.8 – 1.0) of each social determinant has almost always a positive deviation, except that for AH_EL and AH_VL, where the hospital bed and jobs determinants are below the zero. Moreover, in the case of affordable housing, all the other brackets have a negative deviation from the income, in general lower brackets associate with higher negative deviations.
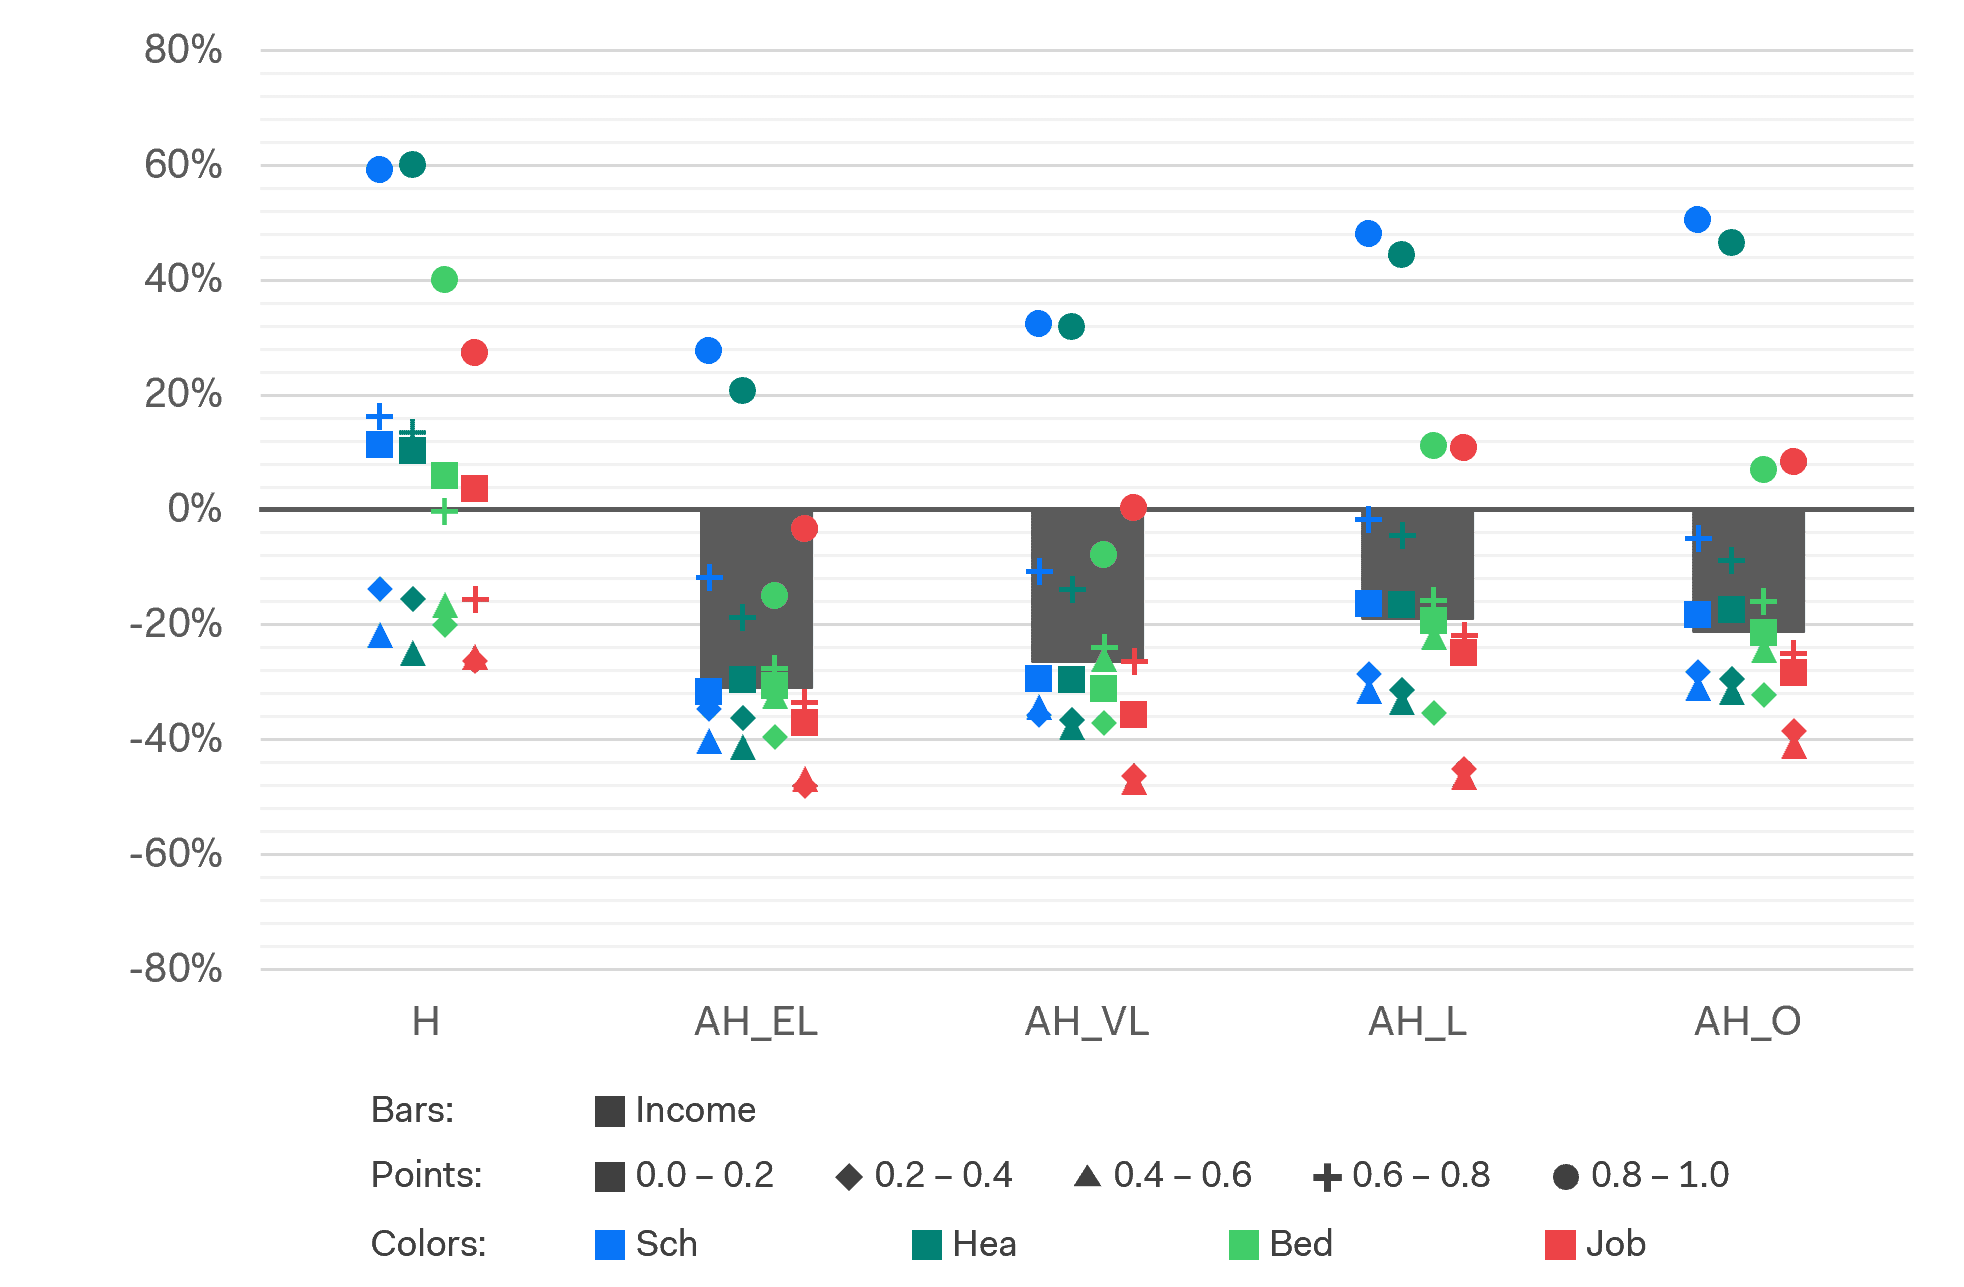
Generally speaking, the chart in Figure 4 shows how the affordable housing location relates to the social determinants location in relation to public transit, and can be used to represent a part of the population that is underserved by the public transportation infrastructure and has a lower access to essential services. The chart in Figure 6, on the other hand, shows the similar outcomes by including the household income, quantifying how on top of the accessibility inequalities, a lower than average financial situation is seldom present, additionally stressing how crucial the presence of a public transportation service is.
Conclusions and Future Work
Affordable housing can be truly successful only when transportation costs are kept in check. Being the second largest household expenditure, it is essential to ensure that transportation accessibility is well planned for affordable housing. This can be assured by planning the location of affordable housing in a way that it is well connected with social determinants such as health, education and employment. The goal of this research was to assess the fairness of mobility for affordable housing stock by conducting an accessibility analysis.
This methodology presented here can prove very useful for conducting the feasibility analysis while planning the location of affordable housing in the city, as choosing a neighborhood with a high Access Score for social determinants will ensure that the affordable housing units are located in high opportunity neighborhoods.
In conclusion, ensuring fairness for affordable housing residents in New York City’s public transport system is a complex issue, with many factors contributing to the challenges faced by low-income communities. Access to public transport, fare pricing, and infrastructure and maintenance are all important areas that need to be addressed to ensure that affordable housing residents can access the city’s public transport system fairly. While progress has been made in some areas, there is still much work to be done to ensure that all New Yorkers have equal access to public transport.
The main limitation of this research can be read as future works, as the Access Score presented here was based on an arbitrary selection of social determinants without the goal to build a comprehensive index able to describe the fairness of accessibility. The list of essential services included can be expanded, by looking at additional social determinants that contribute to the livability of neighborhoods, such as public utilities and services like grocery stores, supermarkets or cultural amenities. This endeavor, along with more detailed time-based analyses will be the basis for additional development of this topic. In addition to this, exploring the accessibility through the lens of specific typologies of users (such as women with children, wheelchair users or elderly persons) can lead to an additional level of intersectionality that could contribute to the development of a more inclusive fairness index, more useful to describe the less-represented groups that often are related to the affordable housing.
The results of this research have been presented at the 2023 AAG Annual Meeting: Raipat, V. and Messa, F. (2023). Measuring the Fairness of Transit Accessibility: The Case of Affordable Housing in New York City. In: 2023 Annual Meeting of the American Association of Geographers, 23-27 March, Denver, CO (US).
Acknowledgments
The research work has been carried out in collaboration with Vaidehi Raipat – alumna of 2022 Class the of Masters of Science in Applied Urban Science and Informatics degree at the New York University, as part of her internship period at Systematica US, Inc. (NY, U.S.). We thank the NYC open data portal and the Department of Housing Preservation and Development (HPD) for enabling this research by sharing data. The analyzed data were treated according to the GDPR-General Data Protection Regulation (EU, 2016/679). This research received no specific grant from any funding agency in the public, commercial, or not-for-profit sectors.
Data Sources
This research wouldn’t have been possible without the availability of open and updated datasets. The leveraging of open data to assess social phenomena is a crucial opportunity to contribute to the comprehension, and potentially, the flattening of social divides.
Below the complete list of the sources used for this article:
- School facilities (location) – NYC – Dep. of Education
- School facilities (enrollment) – NYC – Dep. of Education
- Health facilities – NY State – Dep. of Health
- Hospital beds – NY State – Dep. of Health
- Jobs – US Census – LODES
- Housing – NYC – Dep. of City Planning – MapPLUTO
- Affordable Housing – NYC – Dep. of Housing Preservation and Development
- Average income – US Census – ACS
- GTFS Data –MTA
- H3 Grid – Uber Engineering
References
Allam, Z., Moreno, C., Chabaud, D., Pratlong, F. (2022). Proximity-Based Planning and the “15-Minute City”: A Sustainable Model for the City of the Future. In: The Palgrave Handbook of Global Sustainability. Palgrave Macmillan, Cham. https://doi.org/10.1007/978-3-030-38948-2_178-1
Bardales, A., Yoshiyama, A., Chung, J., Basha, M., Pan, S., Shah, D., Tan, N., Bhogale, T., Mohanty, P., Stafford, G. (2021). New York City Affordable Housing, Across the Spectrum of Socio Economics, 1(4). https://doi.org/10.5281/zenodo.4740633
Calvin, E. (2022). Assessing Broadband Equity in the New York Region. Regional Plan Association. Available at: https://rpa.org/work/reports/broadband-equity-ny-tri-state
Crowley, S. (2003). The affordable housing crisis: Residential mobility of poor families and school mobility of poor children. Journal of Negro Education, 22-38. https://doi.org/10.2307/3211288
El-Geneidy, A., Levinson, D., Diab, E., Boisjoly, G., Verbich, D., & Loong, C. (2016). The cost of equity: Assessing transit accessibility and social disparity using total travel cost. Transportation Research Part A: Policy and Practice, 91, 302-316. https://doi.org/10.1016/j.tra.2016.07.003
Ellen, I.G. and O’Regan, K.M. (2010). How Low Income Neighborhoods Change: Entry, Exit and Enhancement. US Census Bureau Center for Economic Studies, Paper No. CES-WP- 10-19. http://dx.doi.org/10.2139/ssrn.1687759
Levinson, D.M. (2013). Access Across America. Center for Transportation Studies, University of Minnesota.Available at: https://hdl.handle.net/11299/199892
Kelly, N., & Ellen, I.G. (2022). Planning for Opportunity: How Planners Can Expand Access to Affordable Opportunity Bargain Areas. Journal of the American Planning Association, 1-15. https://doi.org/10.1080/01944363.2022.2073904
NYC (2014). Housing New York: A Five-Borough, Ten-Year Plan. NYC – Department of Housing Preservation and Development. Available at: https://www.nyc.gov/assets/hpd/downloads/pdfs/about/housing-new-york.pdf
NYC (2022). Housing New York: Final Report. NYC – Department of Housing Preservation and Development. Available at: https://www.nyc.gov/assets/hpd/downloads/pdfs/about/hny-final-report.pdf
TfL – Transport for London (2010). Measuring Public Transport Accessibility Levels PTALs. Transport for London. Accessible at: https://s3-eu-west-1.amazonaws.com/londondatastore-upload/PTAL-methodology.pdf
TfL – Transport for London. (2015). Assessing transport connectivity in London. Transport for London. Accessible at: https://content.tfl.gov.uk/connectivity-assessment-guide.pdf
U.S. Department of Housing and Urban Development (2018). Addressing displacement from public transportation improvements. U.S. Department of Housing and Urban Development, Office of Policy Development and Research. Available at: https://www.huduser.gov/portal/sites/default/files/pdf/displacementreport.pdf
Yang, R., Liu, Y., Liu, Y., Liu, H., & Gan, W. (2019). Comprehensive public transport service accessibility index—A new approach based on degree centrality and gravity model. Sustainability, 11(20), 5634. https://doi.org/10.3390/su11205634