The research investigated citizens’ travel data in Bologna using the GPS data collected through the Pollicino project. The proposed analysis uncovered soft modes as predominant and concentrated in central zones. Temporal assessments unveil peak travel times, while clustering reveals unique mobility patterns. Leisure emerges as the leading trip purpose. Notably, results highlighted that pedestrian-friendly areas and public transport infrastructures as significant factors influencing travel choices. These findings emphasize the importance of urban infrastructure in shaping mobility behavior, shedding light on key insights for city planning and sustainable transportation.
Introduction
With the growth of sensor data provided by multiple devices, including smartphones, and due to the rapid development of analysis tools and platforms, the necessity of using the data provided by sensors is increasing and becoming crucial to understanding the surrounding environment. In a similar manner, the GPS trajectories data recorded through smartphones generated by moving objects provides the research community with a valuable resource for revealing patterns of human activities, transportation science, and urban studies (Yang et al., 2018).
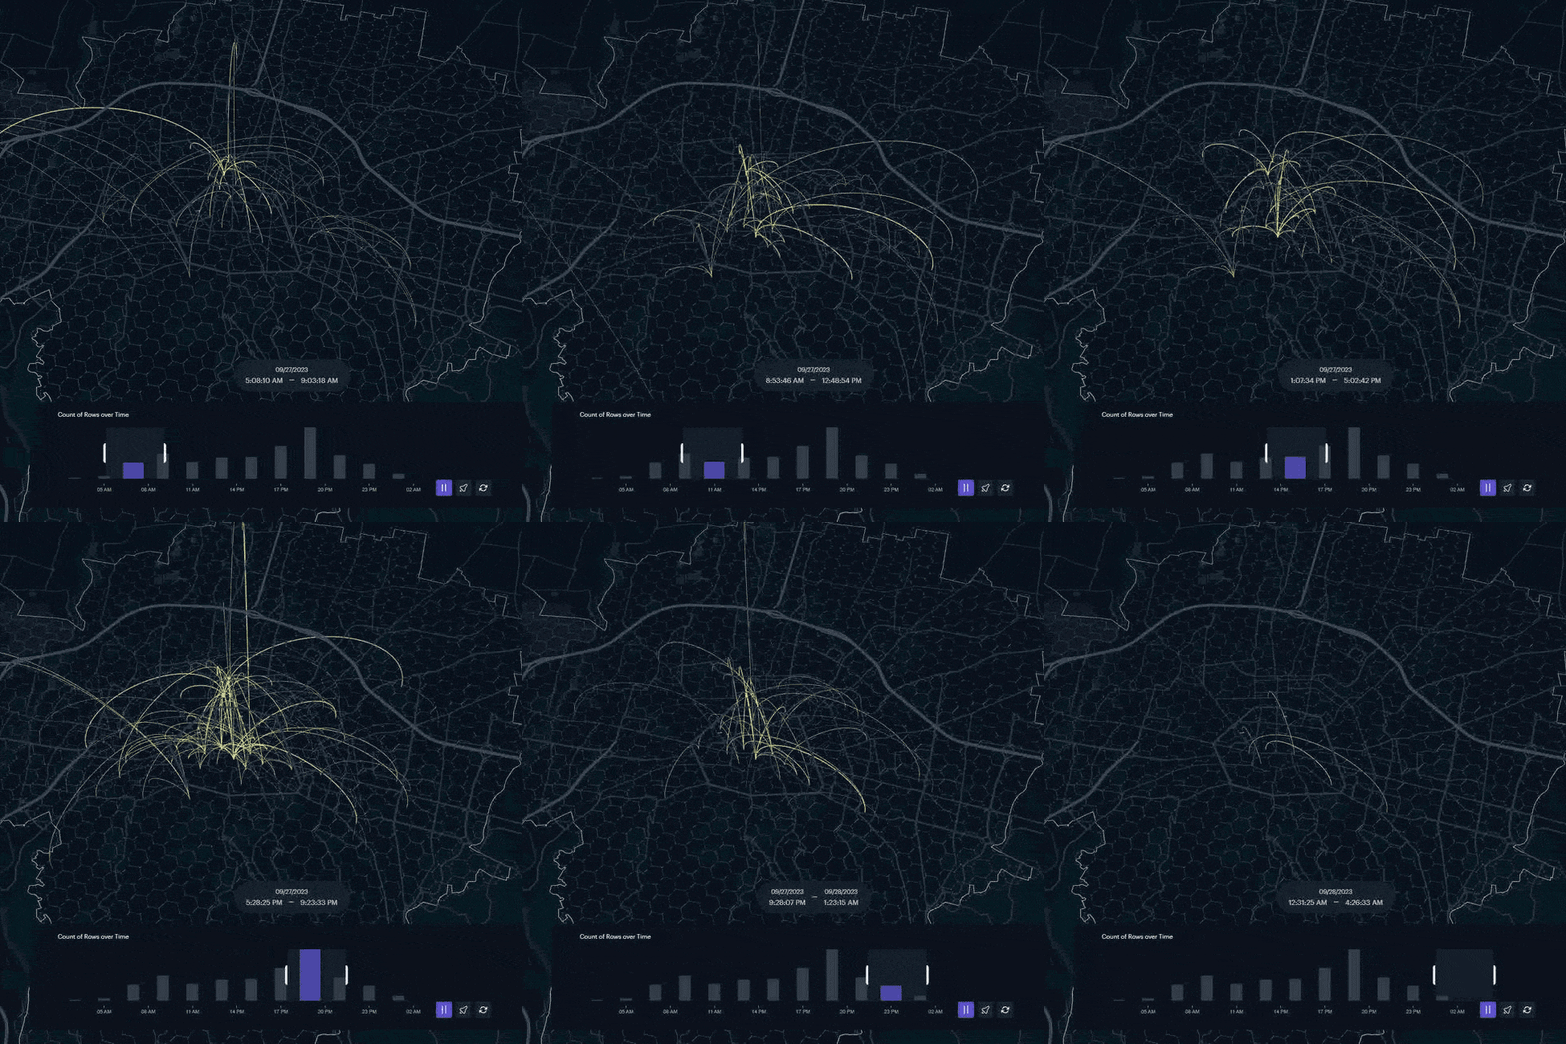
In this context, this research focused on better understand the spatial mobility patterns of the GPS data collected through the project Pollicino carried out by Osservatorio Nazionale Sharing Mobility e Fondazione per lo Sviluppo Sostenibile in the city of Bologna (Italy) between May and June 2022 (see Figure 1). Within the scope of the project, a smartphone app-based mobility survey was developed and used to collected citizens’ travel data through their voluntary participation in compliance with the GDPR policy (namely, participants agreed and used of the mobile app to keep tracking of their daily movements). This interactive collaboration of the participants in the data collection improves the awareness about the mobility and in addition, represent a tool of involving the public in the framework of political choices to improve the cities (Ciuffini et al., 2023).

The main objective of this research was to unlock the potential of the Big Data collected by the mobile sensors by analyzing its spatial components in order to extract the mobility patterns, citizens’ behaviors related to modal choice, and to understand its relation with both the urban characteristics and city infrastructure, as follows:
- Produce thematic maps (e.g., multimodal, socio-demographic, etc.) to describe the spatial distribution of trips;
- Develop spatial clustering analyses, with the aim of identifying similarities in modal choice of participants, in relation to the origin and destination of each trip;
- Analyze the intermediate points of trajectories to deeply identify the differences between the shortest path and the route used by participants, in relation to the existing transport infrastructures and services;
- Analyze the annotated trajectories to feed a modal classification about trip’s parameters (e.g., speed, the distances between the GPS points, etc.).
Enabling Data and Methodology
A sample of 600 participants completed at least 7 days of recording their daily movements through the tracking app IoPollicino. The first set of data is the anonymous profile of each participant (random ID), in addition to demographics (i.e., age, gender). Moreover, this dataset includes also the mobility profiles of participants, which were clustered according to their mobility behaviors:
- Metabolici; namely participants using mainly soft mobility modes;
- Sostenibili: participants mainly using soft and shared mobility modes;
- Megamixer: participants using all transport modes;
- Autonomi: participants mainly using private vehicles and soft mobility modes;
- Auto/ moto Dipendenti: participants using private motorized transport modes only.
The second dataset includes a series of descriptive information about the trip. The third dataset consists of the GPS point records between the origin and the destination of each trip to describe the full trajectory of the trip, the time of the acquisition, the GPS point accuracy, the mode of transportation, and the ID of the trip that the point belongs to.
The GPS data, as well as many of the sensor’s observations, are susceptible to errors due to many factors, including the ionospheric delay of the satellite signal, multipath effects in urban areas, and signal blockage (Adhinugraha et al., 2020). Hence, the 95th percentile of the GPS data accuracy was used as a threshold to filter out the outliers from the data (Kubo et al., 2020). A final data validation step was performed to remove the trips that had lost most of their in-between points while performing the previous filtering steps. Subsequently, the remaining trips after the data cleaning phase were 10819.
Once the GPS data is integrated with the trip information and cleaned, the timing points of the same trip were grouped, where the consecutive points of the same trip are connected by a line (Wang et al., 2020). This step allows us to determine and classify trajectories, showing the distribution of the different transport modes and all relevant trip information.
The analysis about transportation modes relied on the information about speed and points distribution (Yang et al., 2018), as follows: i) motorized modes, including the private car and motorcycle; ii) soft modes, including walking, cycling and scooters; and iii) public transportation, including bus and train.
The influential factors that described the city’s urban morphology and its existing transport infrastructure were collected through open data from local authorities (i.e., Bologna Open Data, Emilia-Romagna geoportal, Emilia-Romagna passenger transportation, BBBike, and OpenStreetMap.
To unify the database of the study and to analyze the relation between the spatial distribution and the transportation modal choices provided at the Pollicino, both datasets were aggregated into the same aggregation zone (McCarty et al., 2023). Hence, the two datasets were aggregated into the hexagonal H3 grid, a hierarchical geospatial index based on hexagons developed by Uber.
Results
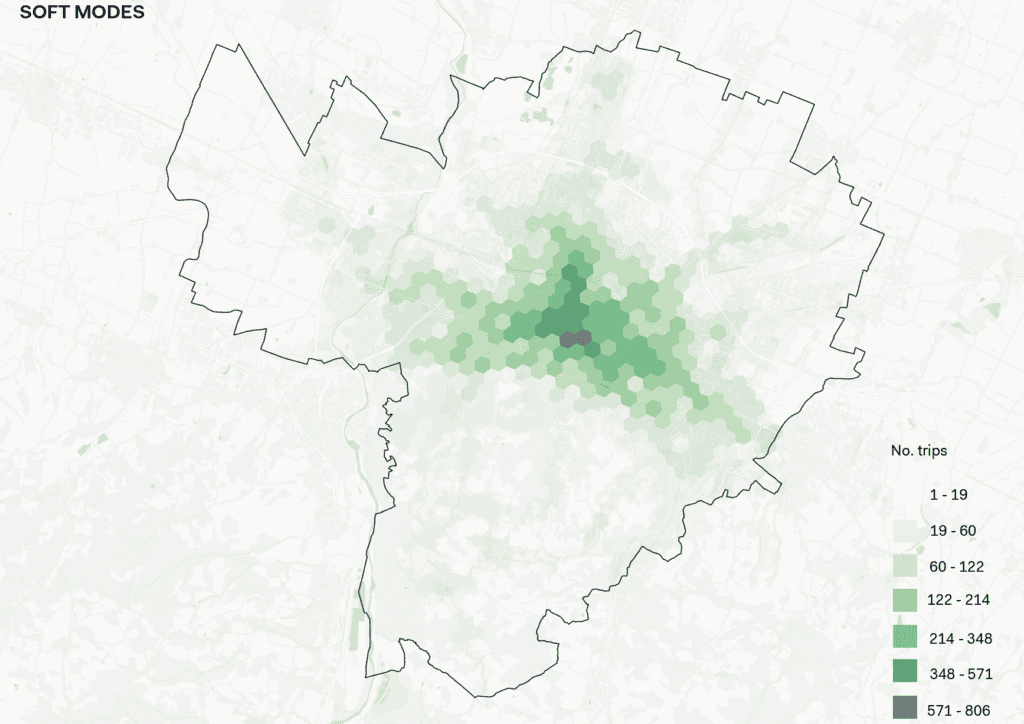
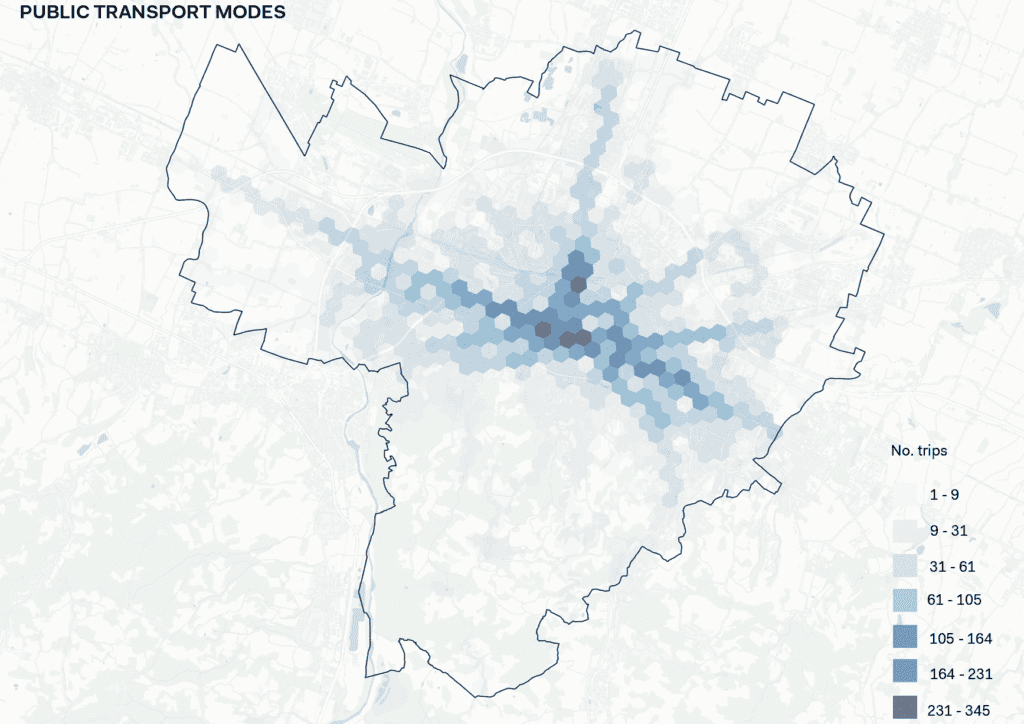
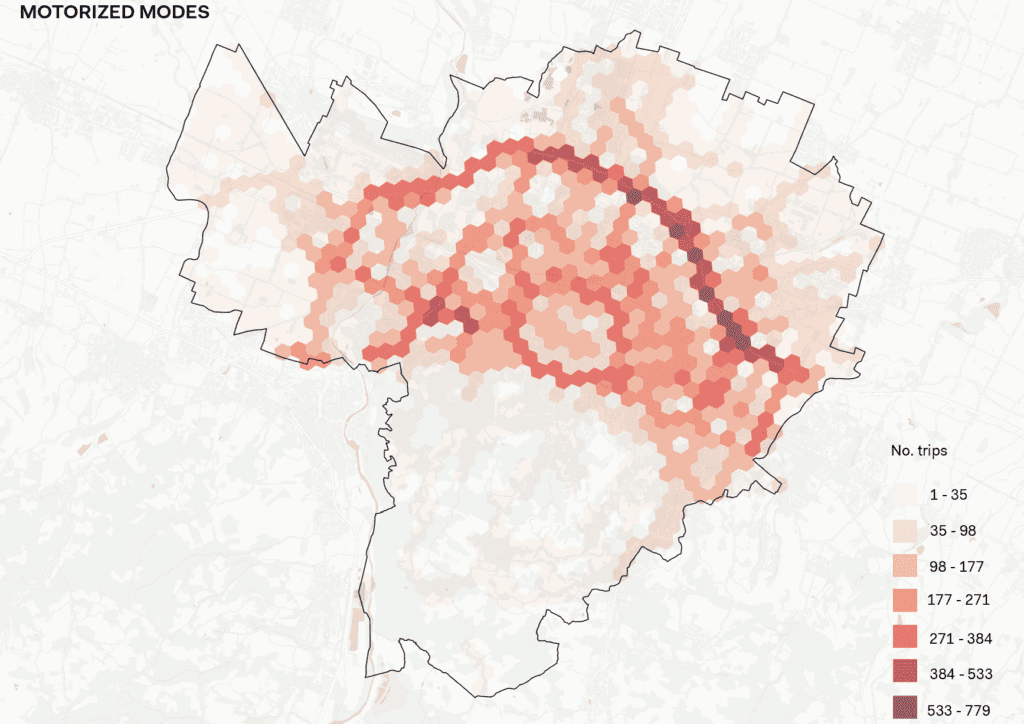
Results showed that the soft mode trips had the highest number of trips during the study period (48% of the total number of trips), followed by the motorized modes (40%). The less used transport modes were public transport (12%).
The analysis showed that most of the trips were traveled far from the southern part of the city (hills zones) to the city center. However, motorized trips were the most widely distributed, covering around 81% of the study area, and were mainly concentrated on the highway and the inner circular road. The public transportation modes served about 60% of the study area and were distributed along the eastern-western axis of the city, following the spatial distribution of public transport infrastructures, with a higher concentration in the city center. The soft mode trips, on the other hand, were concentrated in the central areas of the city characterized by pedestrian zones. For an overview of results see Figure 2 below.
Figure 2 The maps show the spatial distribution of the trips by transport modes
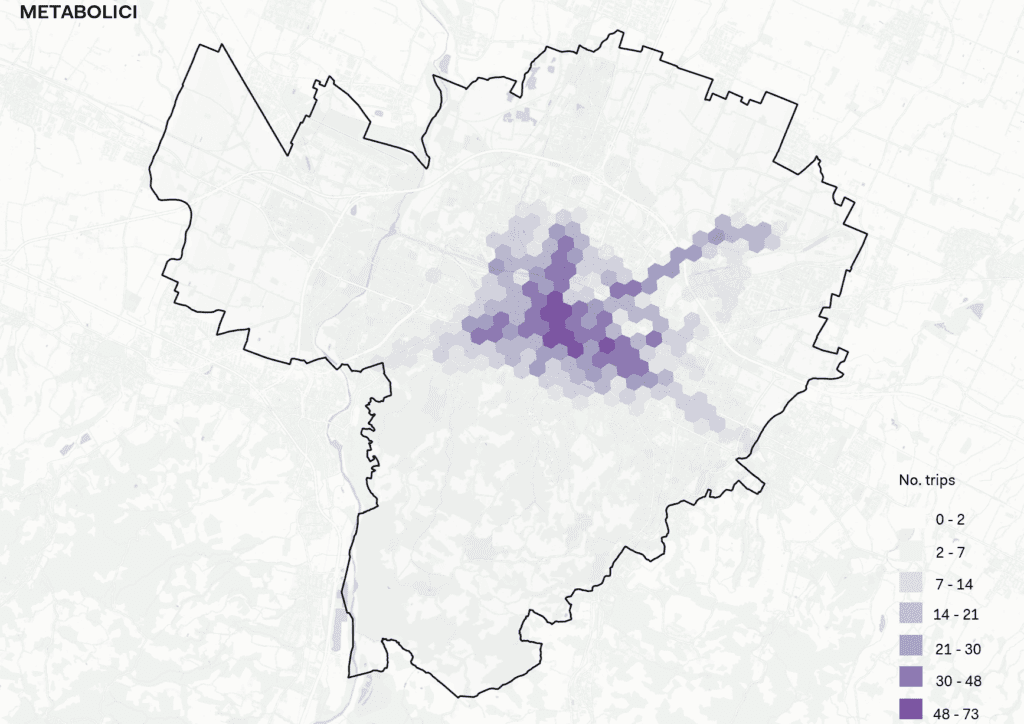
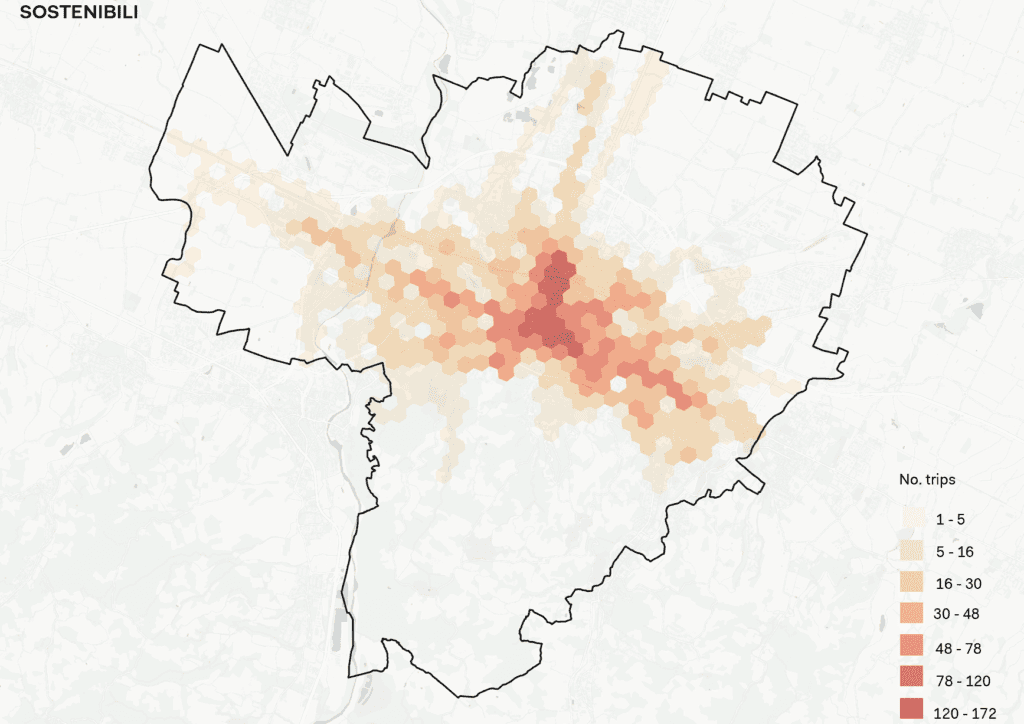
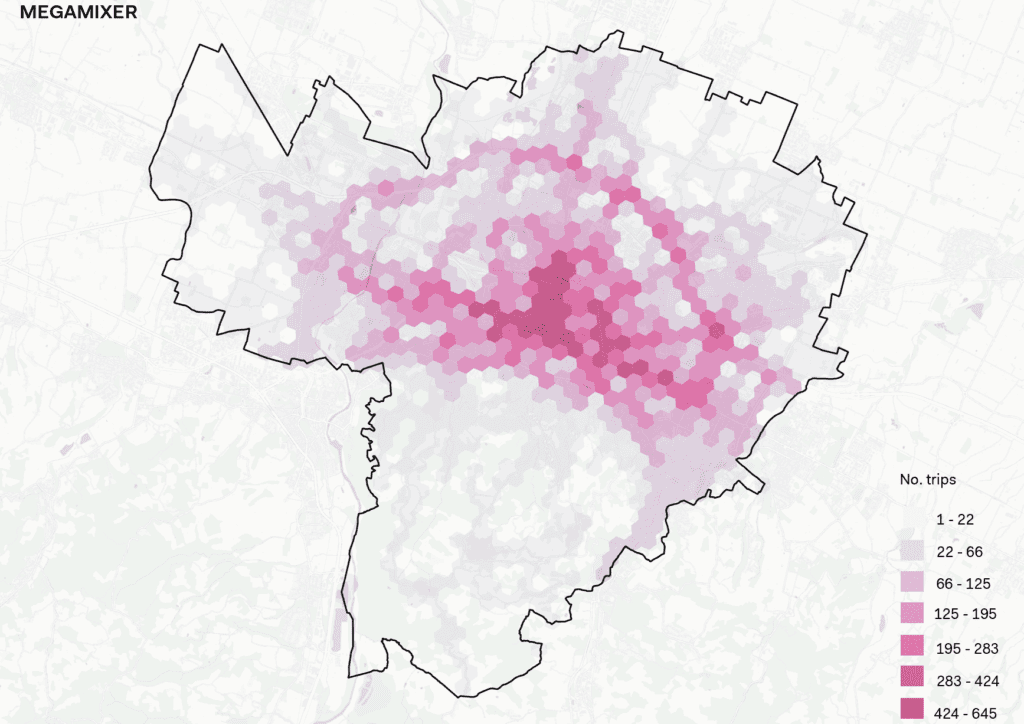
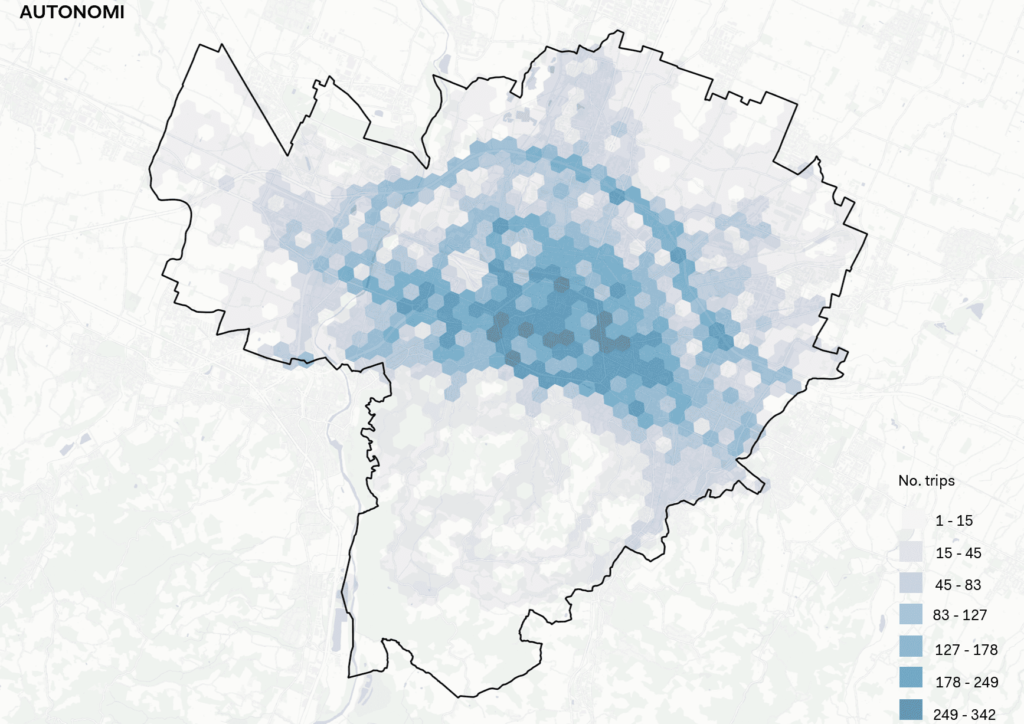
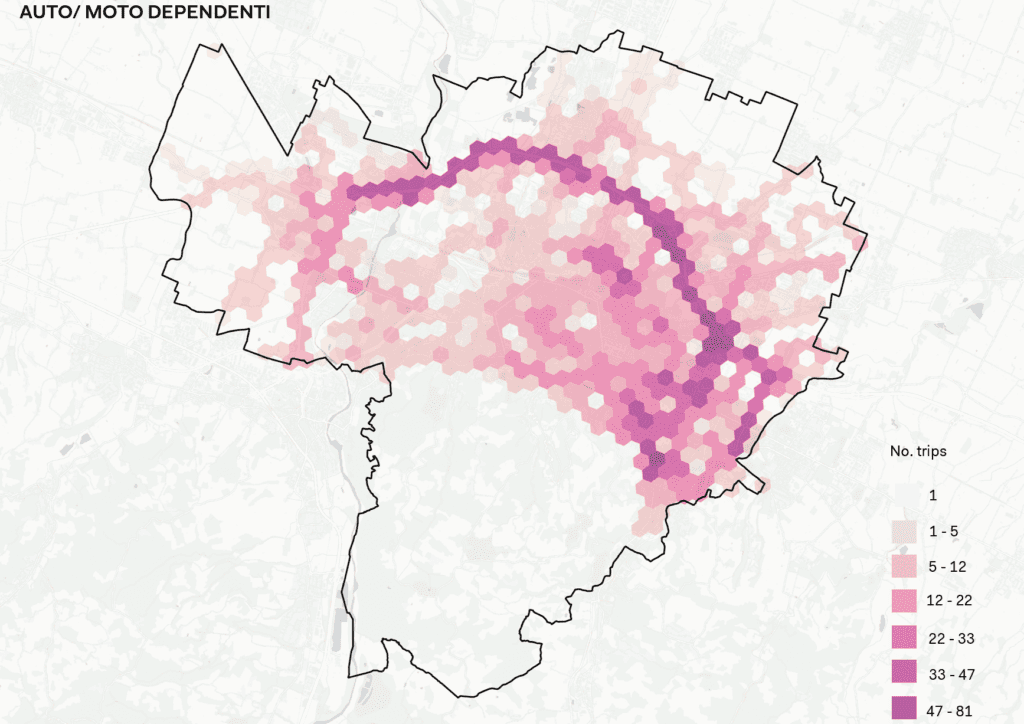
Furthermore, the movements were analyzed based on the mobility profiles of participants to highlight their mobility patterns (see Figure 3). Results showed that the Metabolici cluster trips were characterized by noticeably short journeys within the center of the city. The Sostenibili trips mainly occurred nearby public transportation infrastructures. The Megamixer and Autonomi trips were highly concentrated on the highways and characterized by longer distances traveled, while the Auto/moto Dipendenti trips presented a similar characteristic of the one of the Megamixer and Automobili, but less concentrated in the central areas.
Figure 3 The maps show the spatial distribution of the trips by mobility profiles
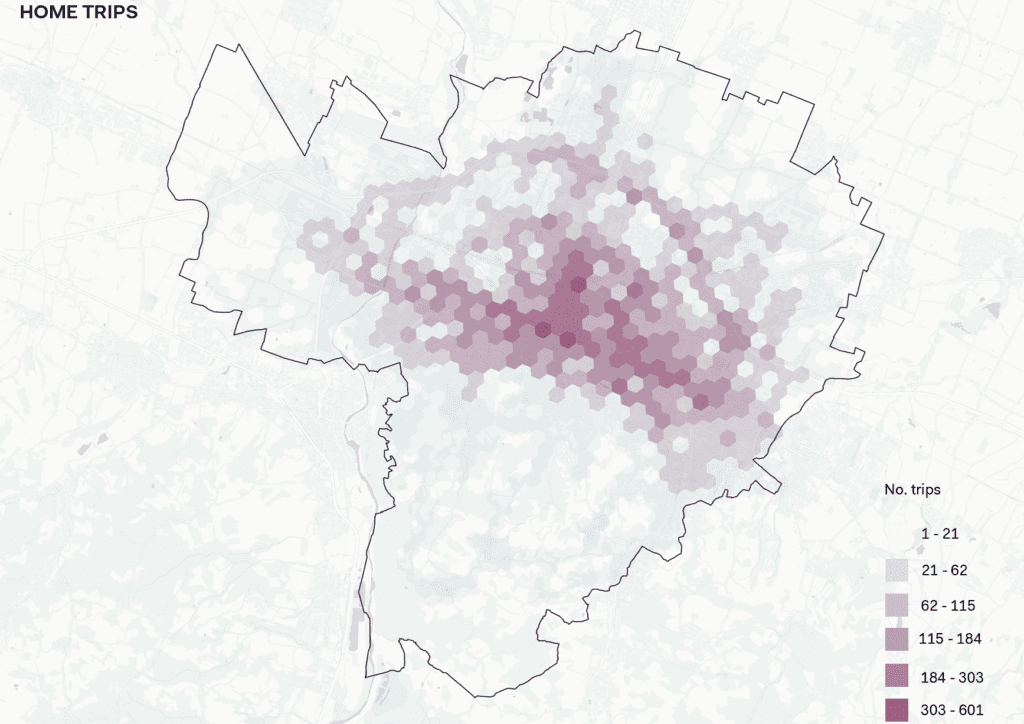
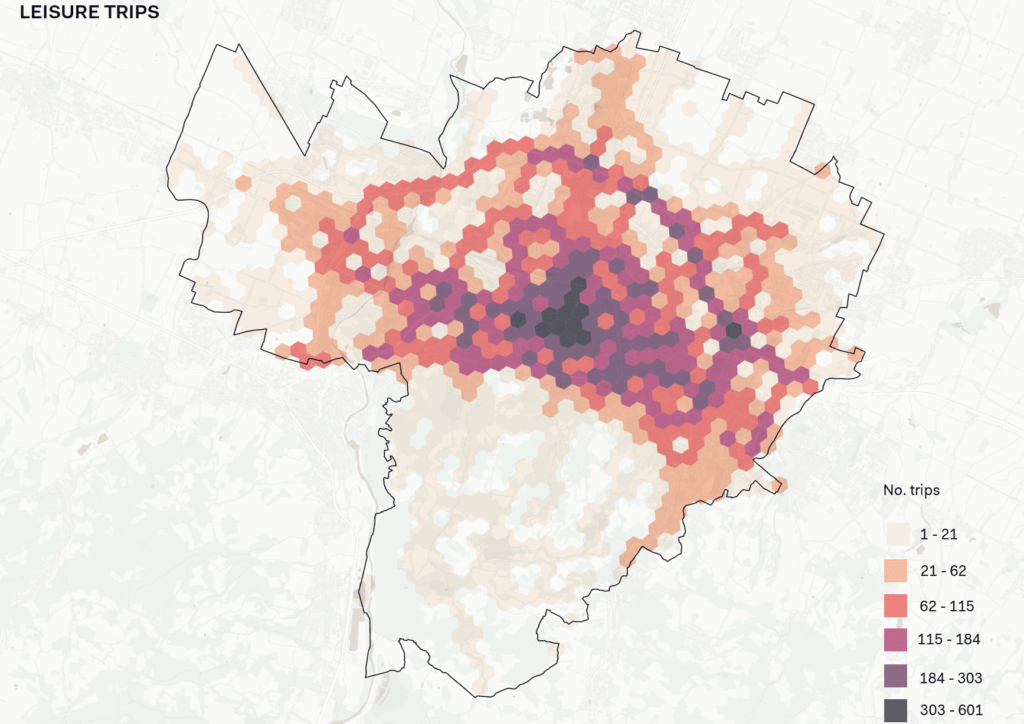
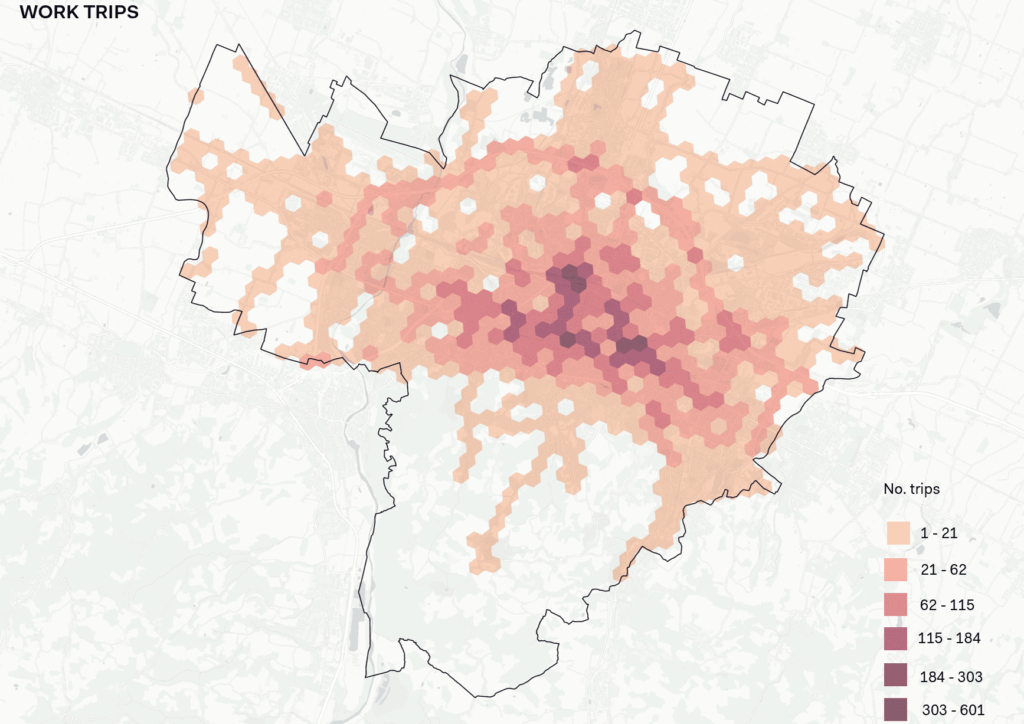
Trip purposes were grouped based on their similarity to the following groups: i) Home trips; ii) Work trips, and iii) Leisure trips (see Figure 4). Results showed that leisure was the most common purpose for the considered trips, followed by home-based trips; work trips, instead, represented the least portion of the total trips. The leisure and work trips presented an overall similar spatial distribution, not depicting any mobility profile, while the home trips revealed a low density around the highways.
Figure 4 The maps show the spatial distribution of the trips by purpose
Conclusions
The main goal of this study was to extract the main spatial mobility patterns in the city of Bologna relying on the GPS data collected from May to July 2022 through the app IoPollicino, a mobile-based survey developed by Osservatorio Nazionale Sharing Mobility and Fondazione per lo Sviluppo Sostenibile.
Results showed that:
- Walking was the most frequently used transport mode over the soft mobility means; the majority of the public transport trips were made by bus, while the majority of the motorized trips were made by cars;
- The central areas of the city were characterized by the highest density of overall trips, where the majority of the soft trips were concentrated. Motorized trips, instead, were often spread out on the highway and the inner circular road;
- The dominant trip purpose was leisure, followed by home trips, while work trips represent the least portion of the total trips.
The ultimate goal of the project was to support the decision-making process of local administrations in the field of sustainable mobility. For this purpose, the research ended providing an interactive data visualization tool providing an overview of Sostenibili cluster mobility patterns (e.g., OD matrix, transport modes, trip purpose, gender, etc.) (see Figure 5).
Acknowledgments
We thank Osservatorio Nazionale Sharing Mobility and Fondazione per lo Sviluppo Sostenibile for their fruitful collaboration. The analyzed data were treated according to the GDPR-General Data Protection Regulation (EU, 2016/679). This research received no specific grant from any funding agency in the public, commercial, or not-for-profit sectors.
The results of this research were presented at the 7th edition of the Conferenza Nazionale della Sharing Mobility, 5 October 2023, Rome (Italy) and published on Zenodo: Ceccarelli, G., Albashir, A., Gorrini, A., Ciuffini, M., Refrigeri, L., & Asperti, G. (2023). Spatial Analysis of Citizens’ Travel Data: The Pollicino Project. Zenodo. https://doi.org/10.5281/zenodo.10361489
Reference
Adhinugraha, K., Rahayu, W., Hara, T., & Taniar, D. (2021). Dealing with noise in crowdsourced GPS human trajectory logging data. Concurrency and Computation: Practice and Experience, 33(19), e6139. https://onlinelibrary.wiley.com/doi/10.1002/cpe.6139
Ciuffini, M., Asperti, S., Ciuffini, F., Gentili, V., Orsini, R. and Refrigeri, L. (2023). Rapporto di ricerca: Pollicino: i cittadini raccontano come si muove la città. Fondazione per lo sviluppo sostenibile, Rome, Italy. Available at: https://osservatoriosharingmobility.it/wp-content/uploads/2023/03/Refrigeri-e-Asperti_OSM.pdf
McCarty, D. A., & Kim, H. W. (2023). A Standardized European Hexagon Gridded Dataset Based on OpenStreetMap POIs. Data in Brief, 109315. https://doi.org/10.1016/j.dib.2023.109315
Kubo, N., Kobayashi, K. and Furukawa, R. (2020). GNSS Multipath Detection Using Continuous Time-Series C/N0. Sensors. 20(14), 4059. https://doi.org/10.3390/s20144059
Saki, S., & Hagen, T. (2022). A practical guide to an open-source map-matching approach for big GPS data. SN Computer Science, 3(5), 415. https://doi.org/10.1007/s42979-022-01340-5
Wang, D., Miwa, T., & Morikawa, T. (2020). Big trajectory data mining: a survey of methods, applications, and services. Sensors, 20(16), 4571. https://doi.org/10.3390/s20164571
Yang, X., Stewart, K., Tang, L., Xie, Z., & Li, Q. (2018). A review of GPS trajectories classification based on transportation mode. Sensors, 18(11), 3741. https://www.mdpi.com/1424-8220/18/11/3741
