
Thanks to the recent developments in ICT tools for collecting traffic data in the urban environment, there is an ever-growing availability of videos capturing the nerve centers of cities (e.g., live streaming webcams, CCTV systems, etc.). This enables detailed analyses of public spaces and their users, leading to a deeper understanding of mobility patterns. Gaining a comprehensive perspective on pedestrian dynamics can be very helpful for various applications, particularly in urban planning. The primary goal of this research is to characterize public spaces through a mobility study on pedestrian patterns analyzed by means of video analytics (i.e., object detection, object tracking). The specific case study revolves around Piazza Duomo in Milan, Italy. It is acknowledged that analyzing crowded scenes, whether through direct human observation or video analytics, presents inherent challenges. Nonetheless, the outcomes have the potential to contribute to the development of evidence-based or parametric approaches for regeneration projects of urban public spaces.
Introduction
The increasing availability of data and expanding computational capacity are facilitating substantial growth in various fields, including Urban Informatics. This emerging discipline combines computer science and data science techniques with urban planning concepts, fostering innovation. Urban planners now utilize novel technologies and methods to address traditional urban planning challenges, capitalizing on the newfound potential of computation.
Big Data is indeed changing the way we collect, analyze, and interpret mobility patterns providing new approaches to quantifying public spaces and related human dynamics. Unprecedented data volumes therefore require the use of new techniques and a better exploitation of computational power.
Urban Informatics captures the intricate nature of urban space and its dynamics via an evidence-based approach that leads to innovative assessment tools and metrics useful for investigating mobility patterns in urban spaces. The success of deep learning and computer vision has created opportunities and established a foundation for gaining a better understanding of cities through visual data. Specifically, video analytics techniques, driven by the advancements in machine learning and deep learning, have introduced automation to tasks that were previously exclusively performed by humans. These tasks involved the manual identification and study of various relevant behaviors within scenes.
Understanding the dynamics of human behavior and more particularly human mobility has been one of the emerging interests among researchers, considering also changes in government policy more concerned about the impact of growing car fleets in urban areas and the environment and sustainability as mentioned in (Derrick, 1999). People have different lifestyles and cities are getting more complex and bigger every day: these two aspects make the analysis of human mobility challenging. Walking, among the various modes of transport, can be considered as one of the most natural modes, however, from the analyst’s point of view, it is actually characterized by complex aspects. For example, there is no vehicle associated with walking and the context in which this mode takes place is heterogeneous and consists of different elements such as sidewalks, crossings, etc. as described in (Bierlaire and Robin, 2009).
The primary aim of the study is to transform raw observation data into meaningful information, relevant to urban planning considerations. The dataset that will be used is a collection of footage captured by a webcam installed in Piazza Duomo, Milan (Italy). Object detection and object tracking models were employed to identify pedestrians and track their movements within the square. This research aims to investigate the potential advantages of these innovative techniques in the field of urban planning and mobility. Specifically, it explores whether computer vision and deep learning techniques can effectively facilitate a mobility study of a public space by analyzing the distribution of identified individuals and their trajectories using specific urban planning metrics. Additionally, the study will attempt to identify different categories of pedestrians (e.g., commuters, tourists) and investigate the presence or absence of groups of people.
Related Works
Related works to this research include approaches to urban mobility and public spaces studies, and the major contributions concerning the use of innovative techniques in these fields.
Data represents a key starting point to support the study of pedestrian behavior in urban settings, and there are different data collection methods that are frequently used for this purpose (Feng et al., 2021), such as: (i) unobtrusive observation of pedestrian behavior in natural environments; (ii) experimental investigation of pedestrian movements in a controlled scenario; (iii) data collection about pedestrian dynamics by using a survey including a list of predetermined questions. As mentioned in (Hou et al., 2020), the systematic observation of pedestrian dynamics is a very informative method to record what people do and how they behave in a particular space. In order to get such kind of records researchers can utilize manual or automated techniques for people counting and tracking (Messa et al., 2022), or exploit sensor records such as GPS (Lin and Hsu, 2014) and Wi-Fi (Gorrini et al., 2021; Farrokhtala et al., 2018). Traditional data collection methods provide rich insights but require significant resources in terms of time and labor, as mentioned in (Zhang et al., 2023).
Computer vision techniques can also be used to observe pedestrian dynamics. These methods receive images or videos as input and attempt to analyze them in order to extract useful information, such as point and trajectory data. The underlying idea that combines the computer vision field with urban planning analysis is based on the attempt to exploit technology in combination with the availability of open data as mentioned in (Ceccarelli et al., 2023b). Many analyses that can be carried out using computer vision, such as crowd counting and density estimation, crowd motion detection, crowd tracking, and crowd behavior understanding. A description of these is given in (Tripathi et al., 2019). An example of computer vision techniques being used to study urban mobility is given by (Ceccarelli et al., 2023a). In this work, pedestrian and vehicular flows were analyzed during the pre- and post-intervention phases of an urban regeneration project, by applying computer vision techniques to videos obtained by a camera. The results obtained demonstrated that through the use of these techniques, it was possible to identify the successful and critical elements of intervention and to use these observations in the subsequent stages of urban space design. Another interesting contribution that deals with pedestrian trajectory analysis obtained from videos using computer vision techniques (Niu et al., 2022), in which the public space vitality is analyzed and quantified by means of the observation of five quantitative indicators: (i) the number of people; (ii) the duration of staying; (iii) motion speed; (iv) trajectory diversity; and (v) trajectory complexity. Ibrahim et al. (2020) presented, instead, an attempt to list different computer vision algorithms related to tasks in urban planning.
Among computer vision techniques, object detection and object tracking approaches were analyzed in this research. Object detection consists in detecting instances of objects of a certain class within an image, like pedestrians, cars, buses, faces, etc, and drawing a tight bounding box around them. Object detection is a two-step process, involving both localization and classification tasks. The localization task aims to identify where the potential location of each target object is while the classification task allows to determine which predefined class each object belongs to. The object detection models need to be trained with a huge amount of annotated visual data which in turn helps to process the information in the new data. A comprehensive review of the various methods of object detection is presented by Zou et al. (2023), Aziz et al. (2020), Liu et al. (2020), Zhao et al. (2019), Jiao et al. (2019), and Tomè et al., (2016).
Object tracking consists of generating trajectories for objects that are in motion in the available frames that constitute the video and assigning unique labels to them. Object tracking in this work is used to locate and track pedestrians in the several frames of the available videos with the purpose of extrapolating potential interesting patterns of space use. There are different types of object trackers. Depending on the number of objects that have to be tracked, single or multiple-object tracking (MOT) can be considered. MOT algorithms are used in this research and presented in the comprehensive survey (Ciaparrone et al., 2020).
Enabling Data and Methodology
This research utilized a tracking-by-detection algorithm fine-tuned on pedestrian subjects, aiming to uncover patterns in urban mobility and characterize pedestrians. The approach employed is data-driven and unsupervised, as the goal is to identify significant mobility patterns through the provided data without any form of annotation. The methodological approach was structured into five phases, as depicted in Figure 2. Below, snippets of the overall methodology are presented.
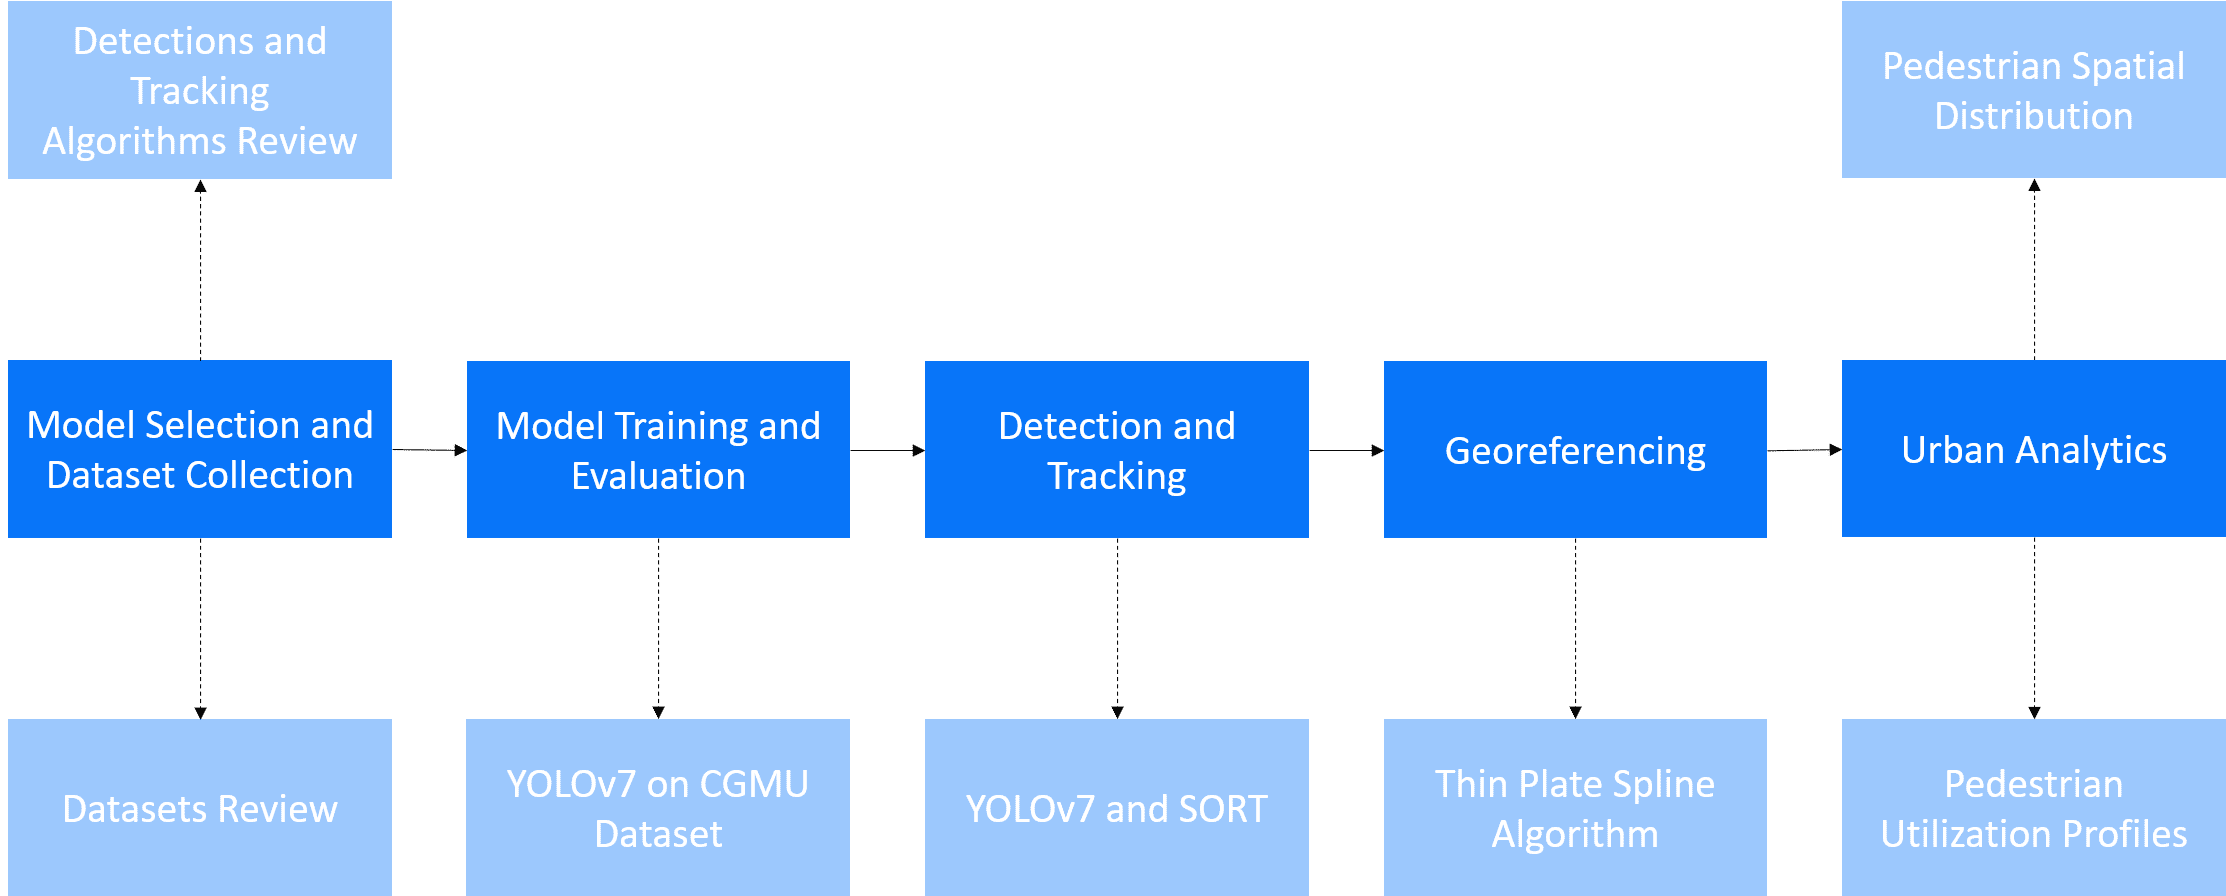
Model Selection and Dataset Collection
The initial phase of the project involved conducting a literature review of previous research on pedestrian detection and tracking methods, emphasizing their primary limitations. For the object detection and object tracking steps, YOLOv7 and SORT algorithms were selected, respectively. The choice of these algorithms considered factors such as their ease of use, open-source accessibility, and speed.
YOLOv7 is the latest official version of the YOLO series (released in July 2022), developed by YOLO architecture’s original authors. This network improves the detection speed and accuracy on the basis of the previous work. The architecture is FCNN (Fully Connected Neural Network) based and it has three main components: backbone, head, and neck. The backbone of a model is the element dedicated to taking the input image and extracting relevant features from it. The backbone feeds these features to the head through the neck. The head is the part of the network that predicts the bounding box’s locations, the classes of the bounding boxes, and the reliability of the bounding boxes (Jiang et al., 2022).
SORT is a MOT (multiple-object-tracking) algorithm structured in three main steps: detection, estimation model, and object association, which involves the creation and deletion of track identities. Considering each new frame, SORT uses the Kalman filter as a motion model to propagate the tracked objects. The Kalman filter performs this operation by extrapolating the motion of these objects and once performed updates its status. Next, a two-stage or one-stage object detector detects all objects in the current frame. SORT has emerged as a baseline method renowned for its real-time speed and accuracy, achieving good performance at a high frame rate as mentioned in Bewley et al. (2016).
Next, research was conducted to obtain a dataset for the fine-tuning phase of the object detection models. The dataset used was the Centre de Gestion de la Mobilité Urbaine (CGMU) dataset, which consists of videos captured by 500 Pan-Tilt-Zoom (PTZ) traffic cameras installed in the city of Montreal. At the same time, an assessment of existing datasets for training object trackers was carried out, highlighting the scarcity of available datasets that meet specific requirements such as large-scale public spaces, small pedestrians, and fixed webcam videos.
Fine-tuning and Evaluation
Fine-tuning with the CGMU dataset was conducted for both object detection models, YOLOv5 and YOLOv7. The weights of a model pre-trained on the Microsoft Common Objects in Context (MS-COCO) dataset were utilized as the initial starting point. For both models, a transfer-learning approach was employed to fine-tune only the output layers. A performance evaluation for both models was carried out on a test set. This evaluation involved the use of metrics such as Precision, Recall, Intersection over Union (IoU), and mean Average Precision (mAP).
Detection and Tracking
Once the training step of the object detection models was completed, in combination with the best selected object detector, two different tracking algorithms, SORT and StrongSORT, were tested. The choice of the best model was based on speed performance. After selecting the best model for tracking, detection and tracking processes were carried out on the Piazza Duomo dataset, using the trained weights from the object detection algorithm. The result of the object recognition and tracking process is the creation of a text file with the following information: video frame, object ID, object class (i.e., pedestrian), pixel X, and pixel Y.
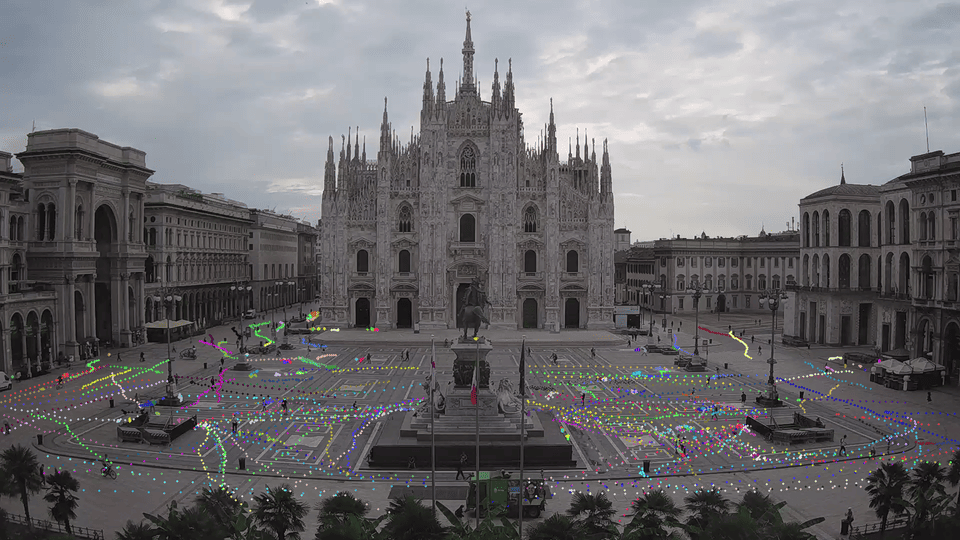
The Piazza Duomo dataset concerns one of the most important squares in Italy, characterized by an important flow of people due to its historical importance and strategic position. It consists of videos recorded by stationary cameras installed in the respective squares. Videos are captured on Thursday, July 15, 2021, in different 30-minute time slots, five different moments of the day: 8:00 – 8:30, 11:00 – 11:30, 12:45 – 13:15, 15:00 – 15:30, and 18:00 – 18:30. The total duration of the videos available is therefore 5 hours. Videos have 1920×1080 pixels resolution and a frame rate equal to 15.01 FPS (i.e., Frames Per Second).
Georeferencing
Before conducting urban analysis and exploring spatial utilization it was necessary to reproject on the plane the detections obtained through a georeferencing process. This step estimates the geographical position of pedestrians in the square starting from the previously identified coordinates (i.e., pixel X, pixel Y) and translating them into geographic coordinates (i.e., latitude, longitude). The objective of this phase is to eliminate perspective distortion of the images by locating pedestrians in the target area. The methodology uses the QGIS implementation of the Thin Plate Spline algorithm as a transformation technique, with Ground Control Points selected to anchor points in the perspective image. The procedure is repeated through an automatic matching algorithm in each frame of the video.
Urban Analytics
To conduct urban analysis, we utilized QGIS software and Python scripts. The georeferenced data was analyzed in two distinct ways. Firstly, point pattern analysis was employed to characterize public spaces, while trajectory data mining was utilized to uncover various pedestrian utilization profiles. In particular:
• Point Pattern Analysis. Point pattern analysis is performed on a collection of points that have geographical attributes and show a particular distribution. Points represent the place where a particular event occurred and, in this research, they indicate the location of identified pedestrians. This technique was used to study the distribution of the detections using heatmaps.
• Trajectory Data Mining. Trajectories represent the paths of pedestrians in a given geographical area and they are therefore characterized by spatial and temporal information. A trajectory can be seen as a sequence of chronologically ordered spatio-temporal points: p1 → p2 → · · · pn where each point p consists of a geo-spatial coordinate set and a timestamp (x, y, t). This technique was used to cluster potential users’ profiles, commuters and tourists or the presence of groups, taking into consideration some main characteristics such as speed, duration, distance traveled and direction. Results of this analysis were supported by t-tests.
Both analytical procedures are further detailed in the following section, where experimental results are also outlined.
Results
The results presented and discussed in this section outline how georeferenced detections and trajectories were used to analyze pedestrian profiles in Piazza Duomo. In particular, the timeslot 18:00-18:30 is chosen as a benchmark period to uncover the main patterns in the use of the square.
Point Pattern Analysis
In order to understand and analyze the distribution of georeferenced pedestrian detections, graphs were generated for each time slot. Considering the 18:00-18:30 time slot in Figure 3, it can be seen that there is a higher concentration of detections in the area of the square close to the CCTV camera due to the fact that pedestrians are more visible and of a larger size. This trend is also noticeable in the other time slots considered (i.e., 08:00-08:30, 11:00-11:30. 12:45-13:15, 15:00-15:30).
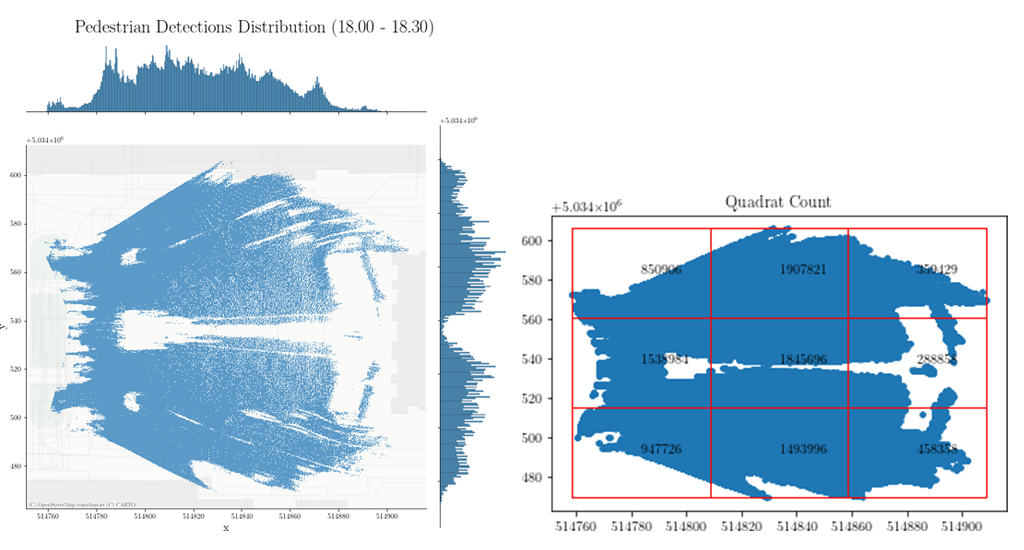
For a more in-depth analysis, the following metrics were calculated for each of the time slots: Occupancy (pedestrian/cell), Density (pedestrian/squared meter), and Flow Rate (pedestrian/minute/meter). The results are presented in Table 1.
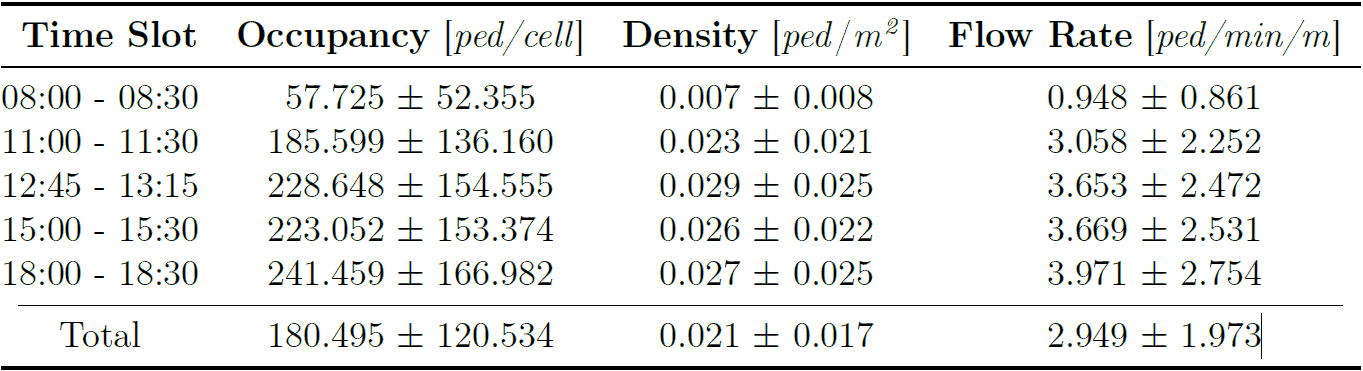
Analyzing the results, it can be seen that the Occupancy value increases during the day, with the highest value (241.459 pedestrian/cell) at the time slot 18:00-18:30. A similar trend is observed for the other two metrics, Density and Flow Rate, with lower values in the early hours of the day. These results indicate that the use of the square increases over the hours, with the highest values in the afternoon.
Figure 4 outlines the average patterns for Occupancy, Density and Flow Rate for the five time slots (i.e., 08:00-08:30, 11:00-11:30. 12:45-13:15, 15:00-15:30, 18:00-18:30). It can be observed that the highest values considering Occupancy occur close to the subway accesses in the square. In particular, in these latter areas of the square, Occupancy values are higher than 600 pedestrian/cell. Regarding Density and Flow Rate most of the square is characterized by a LOS level A indicating “free flow”, considered the average scenario of the five time slots. Some areas of the square are nevertheless characterized by LOS level B representing the presence of “minor conflicts”. The LOS level B denotes irregular flow under low- to medium density conditions.
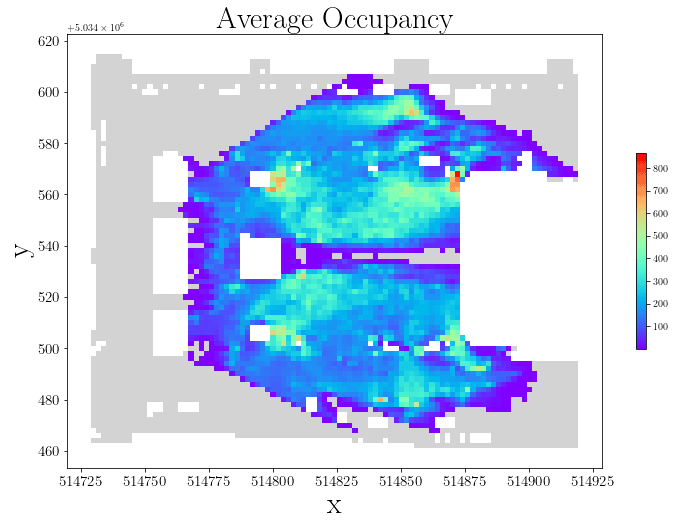
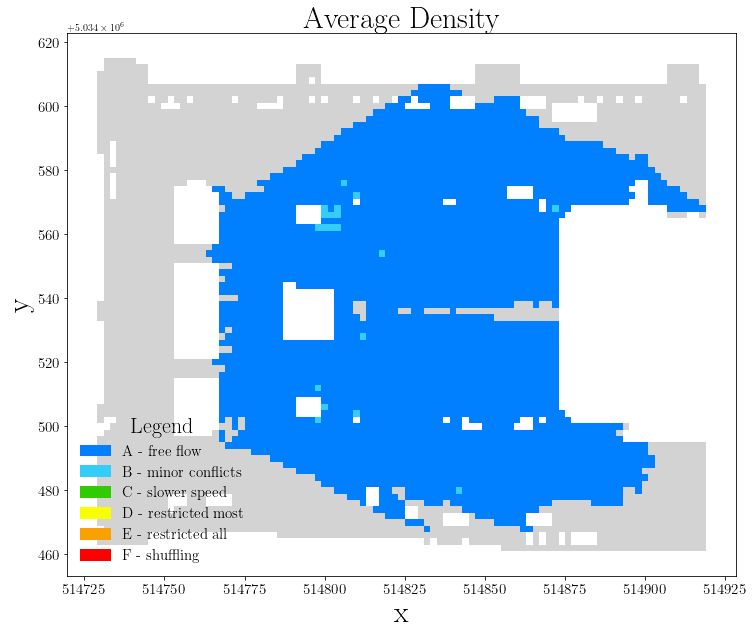

Figure 4 (a) Average Occupancy (pedestrian/cell), (b) Average Density (pedestrian/squared meter), (c) Average Flow Rate (pedestrian/minute/meter)
The highest values that characterize the time slot 18:00-18:30 (as seen in Table 1), can be visualized in Figure 5. There is a greater area of the square characterized by LOS level B compared to the average scenario. In this case, there are also values of LOS up to C level, representing areas where pedestrian mobility is rather congested and as a result there is a “slower speed”.
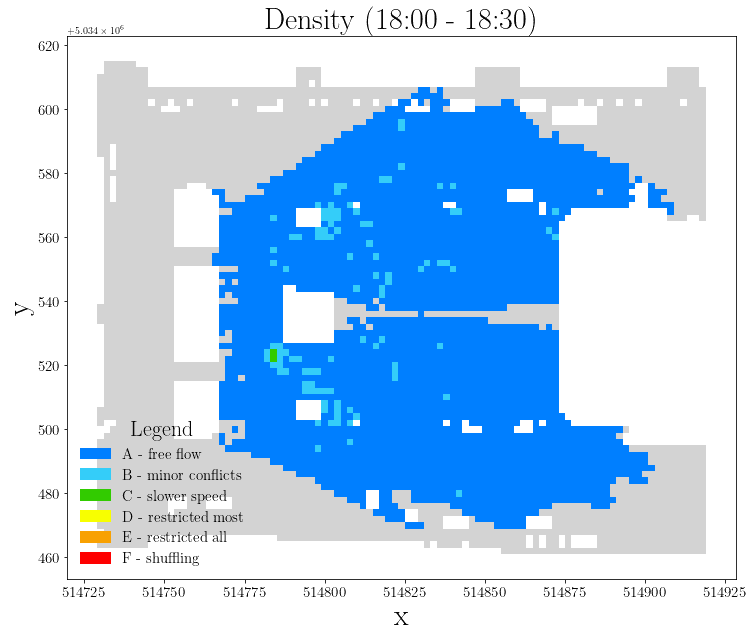
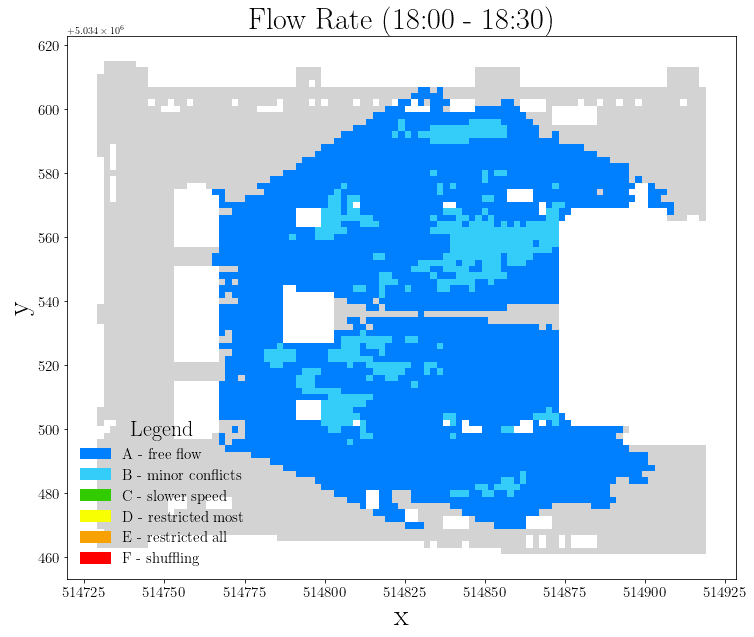
Figure 5 (a) Density and (b) Flow Rate for 18:00 – 18:30 time slot
Trajectory Data Mining
Once the analysis of the distribution of individual detections in the square was completed, pedestrian trajectories were analyzed. First, two filtering steps were performed. The first trajectory filtering operation consisted of considering only trajectories whose duration was higher than 20 seconds. Considering the five time slots, the average number of detections and trajectories eliminated were 78% and 98% of the total respectively. These percentages are high due to noise in the observations due to occlusion issues.
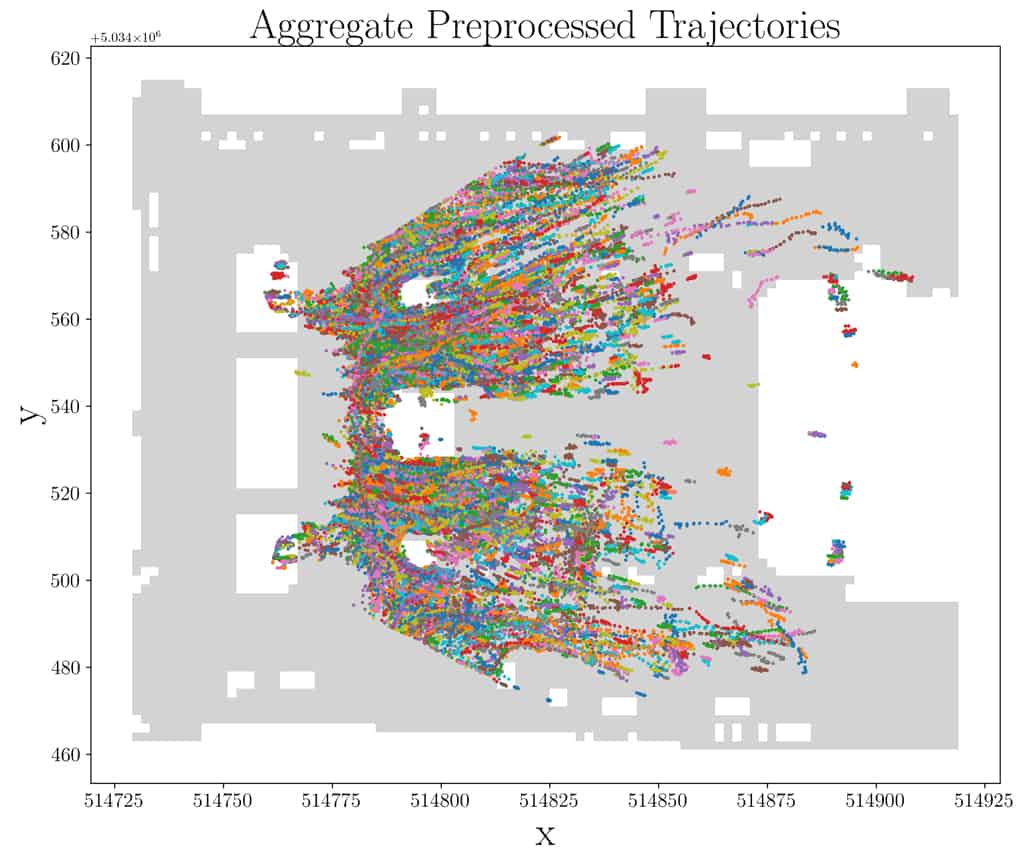
The second filtering step consisted of discarding trajectories containing points with speeds above 2 m/s, which were considered outliers. From the previously processed trajectories, a substantial deletion was again carried out in order to have clean and meaningful data. In particular, in this step an average of 77% of the detections and 76% of the trajectories were eliminated, considering the five time slots. Figure 6 shows the resulting trajectories and their respective points, for all time slots.
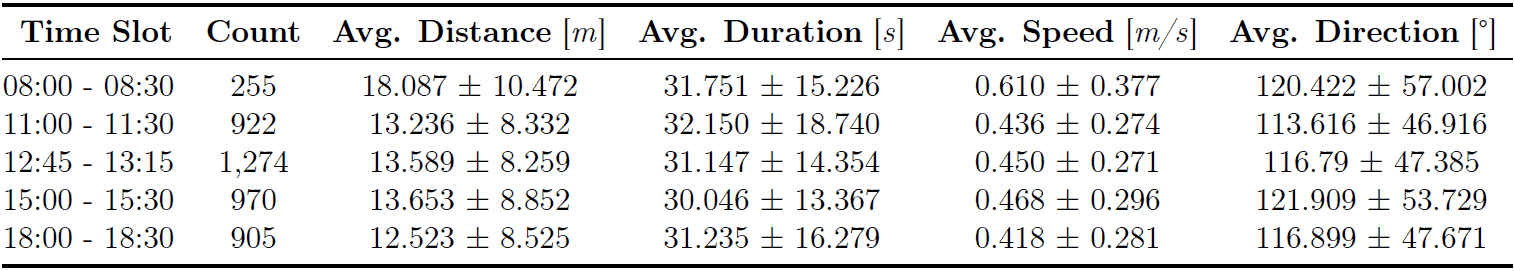
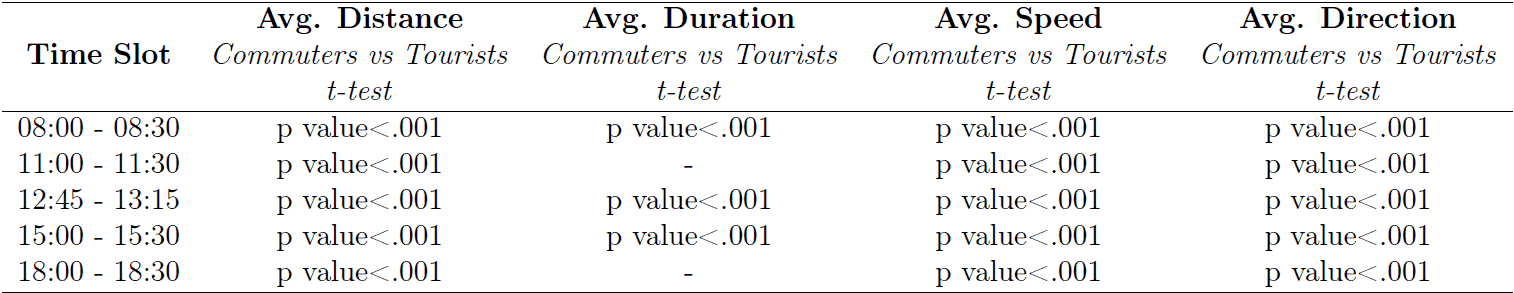
For each time slot, average values of time distance, duration, speed, and direction, are presented in Table 2. At the end of the data cleaning operations for the five time slots, 4,326 trajectories were obtained: 255 for the first time slot, 922 for the second, 1,274 for the third, 970 for the fourth, and 905 for the last time slot. The first time slot, 08:00-08:30, is characterized by the lowest number of trajectories but at the same time by the highest speed value. It can be assumed that there are mostly commuters at this time of day (i.e., people on their way to work). Over the hours, the number of identified trajectories increases and the average speed decreases. This indicates greater pedestrian congestion in the square. In the last time slot, 18:00-18:30, the lowest values for speed and distance traveled are reported.
Commuters vs Tourists
Considering the preprocessed trajectories, clustering was performed to identify the trajectories of commuters and tourists. Once the two clusters were obtained, labels were assigned based on the characteristics of the two clusters, by analyzing the average values of distance, duration, speed, and direction, and by considering the spatial component of trajectories. In particular, it was assumed that the trajectories of commuters are characterized by higher linearity and higher speed, unlike those of tourists which are characterized by greater uncertainty and lower speed (Gorrini et al., 2016). Clustering results are presented in Table 3.
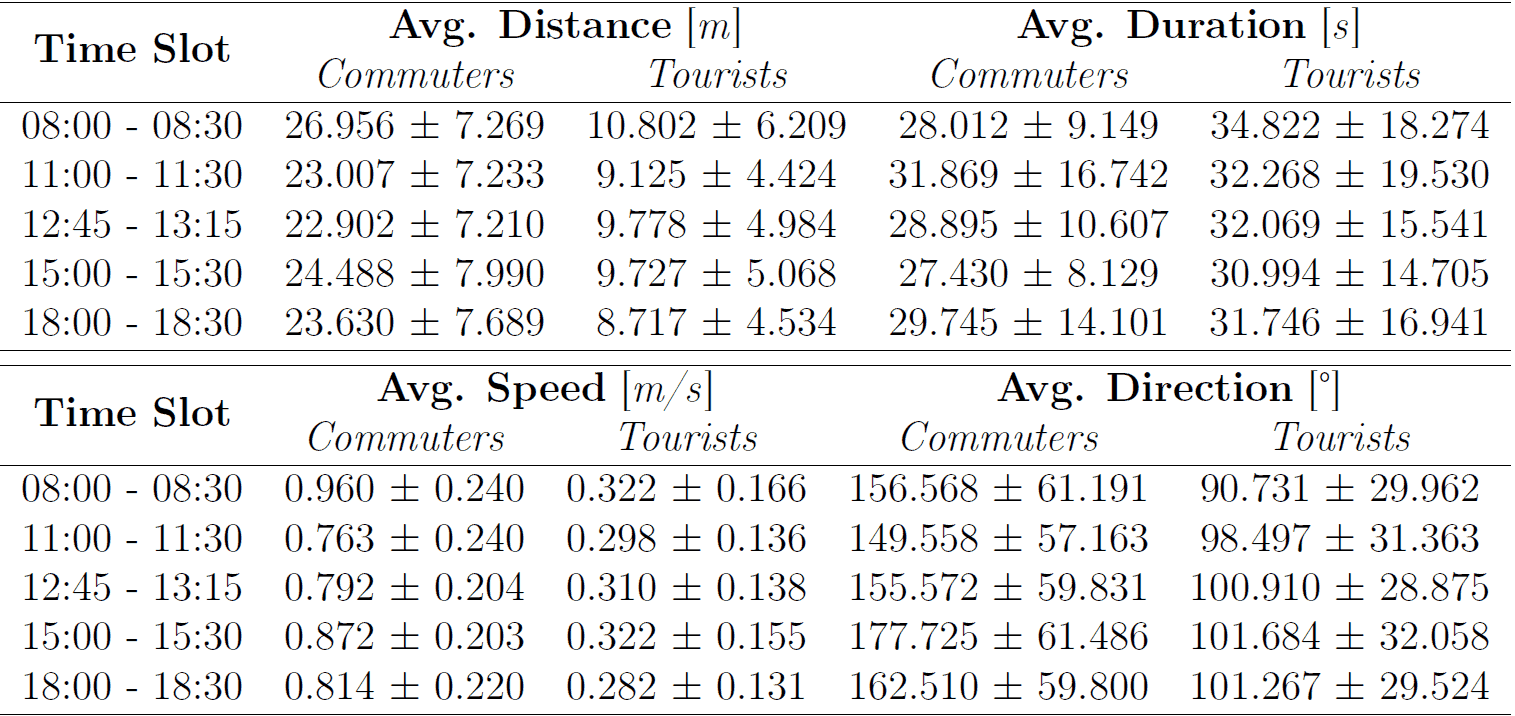
The average percentage of tourists walking the square (68.825% ± 50.744) is higher than the average percentage of commuters (31.175% ± 50.744) considering the five-time intervals. The variance values are very high due to the first time slot which has a significantly lower number of pedestrians in the square. Focusing on this first interval, 08:00-08:30, the number of pedestrians identified as commuters is 115 while the number of pedestrians identified as tourists is 140. In comparison with the other time slots, in which the percentage of tourists is always higher than 70%, the difference between the two categories of pedestrians is minimal. This can be explained by the fact that being early in the morning, the number of tourists in the square is low and will increase over the day.
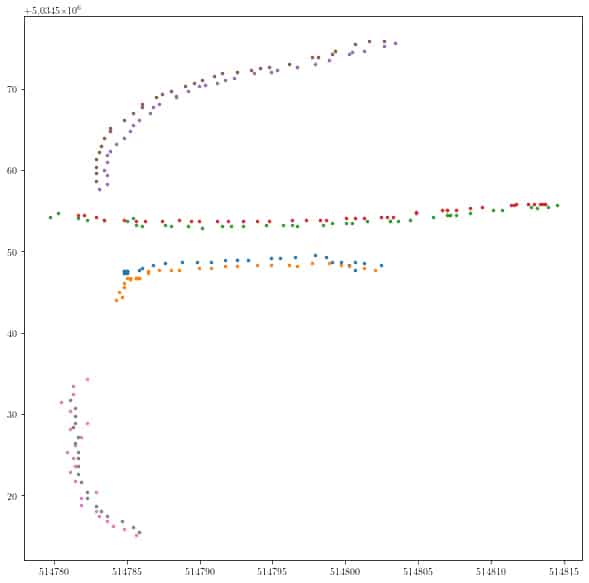
Examining the results in Table 3, it can be seen that the distance, speed, and direction values are higher for commuters than for the trajectories associated with the tourists’ cluster. The latter is in fact characterized by more irregular trajectories and a lower speed, which leads to covering shorter distances in more time. An example of the two clusters on trajectories of commuter and tourist trajectories related to the 18:00 time slot is shown in Figure 7. As can be seen from the image, trajectories identified as belonging to the commuters cluster appear to be longer and more linear. Trajectories associated with tourists, on the other hand, appear shorter and more randomly distributed. In order to better understand and validate the differences between the pedestrians identified as commuters and those identified as tourists, two-tailed t-tests with independent samples were performed.
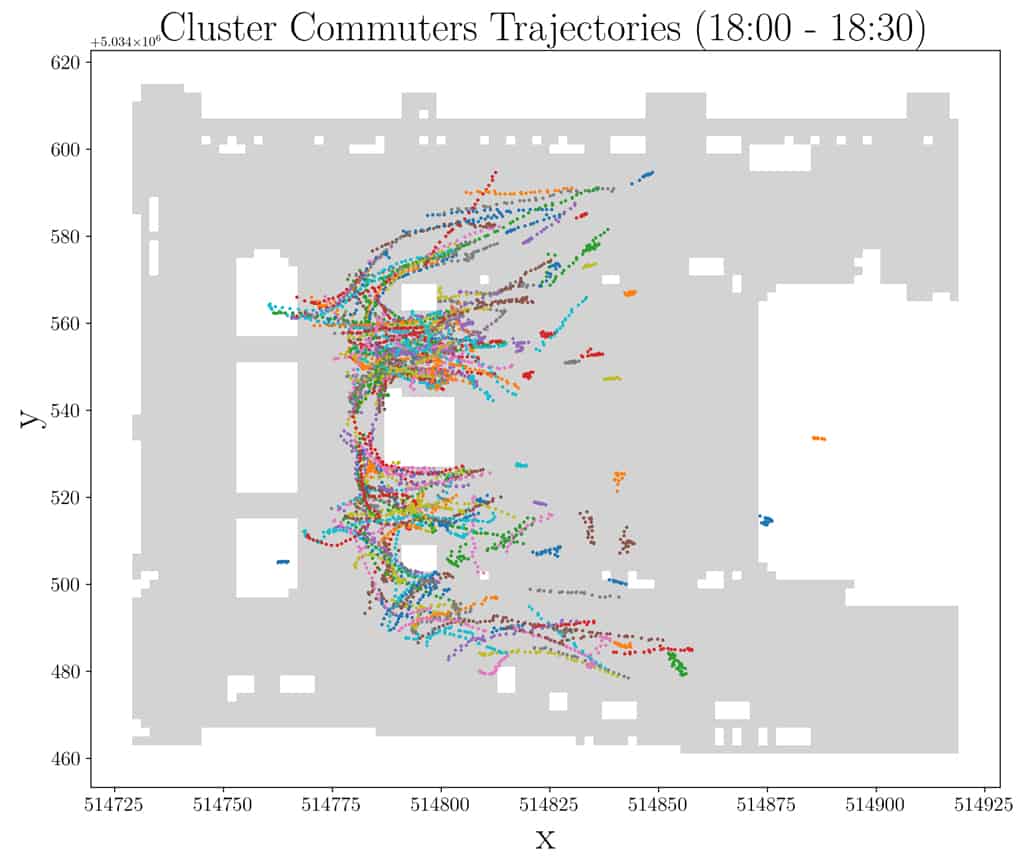
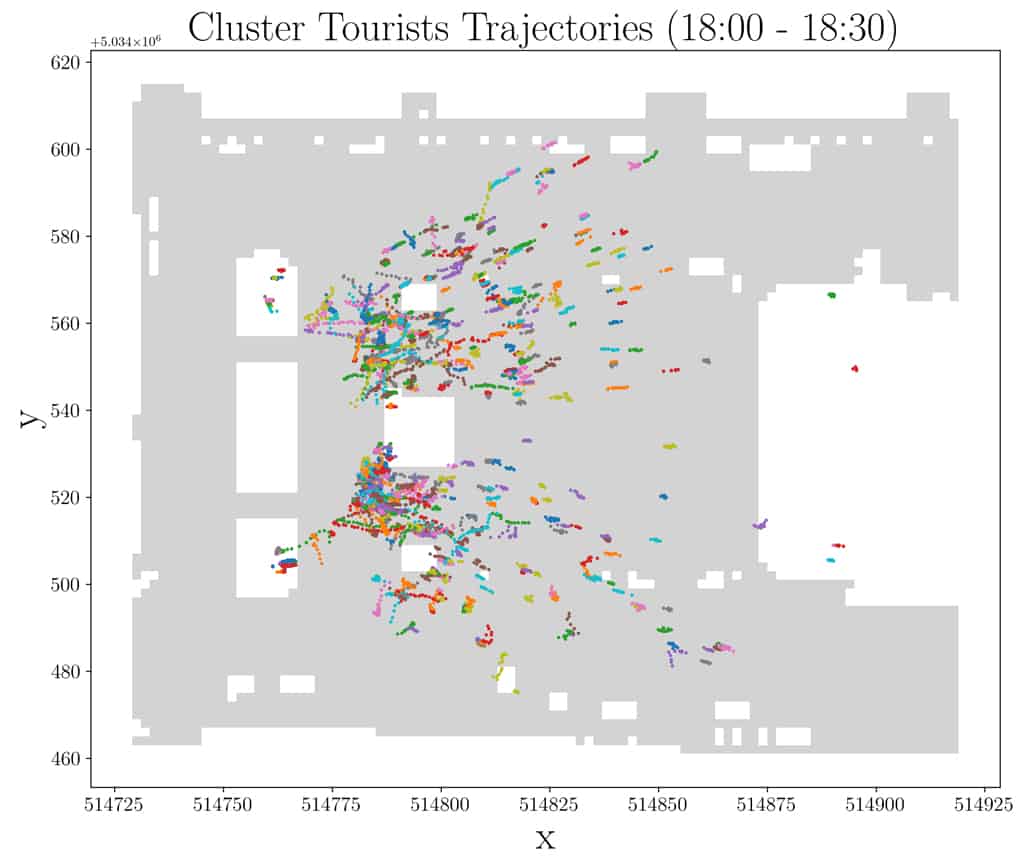
Figure 7 (a) Commuters and (b) Tourists clusters for 18:00 – 18:30 time slot
The t-tests confirmed, as can be seen in Table 4, that the average values of distance, duration, speed, and direction are significantly different for the two types of pedestrians except for duration values in the 11:00 and 18:00 time slots. Considering 11:00-11:30 time slot, 273 commuters (M = 31.869, SD = 16.742) compared to 649 tourists (M = 32.268, SD = 19.53) demonstrated a non-significant difference considering duration, t(920) = −0.295, p = .768. Similarly, considering the duration as well, in this case for the time slot 18:00-18:30, 231 commuters (M = 29.745, SD = 14.101) compared to 674 tourists (M = 31.746, SD = 16.941) do not indicate a significant difference, t(903) = −1.613, p = .107.
Single vs Groups
Further analysis allowed us to investigate the presence or absence of groups, namely pedestrians whose trajectories have close (no more than 4 m) start and end points and the remaining points close (no more than 1.5 m) for the duration of their existence at the same time. In Figure 8, for the interval 18:00-18:30, a subset of pedestrian trajectories identified as being part of groups is presented.
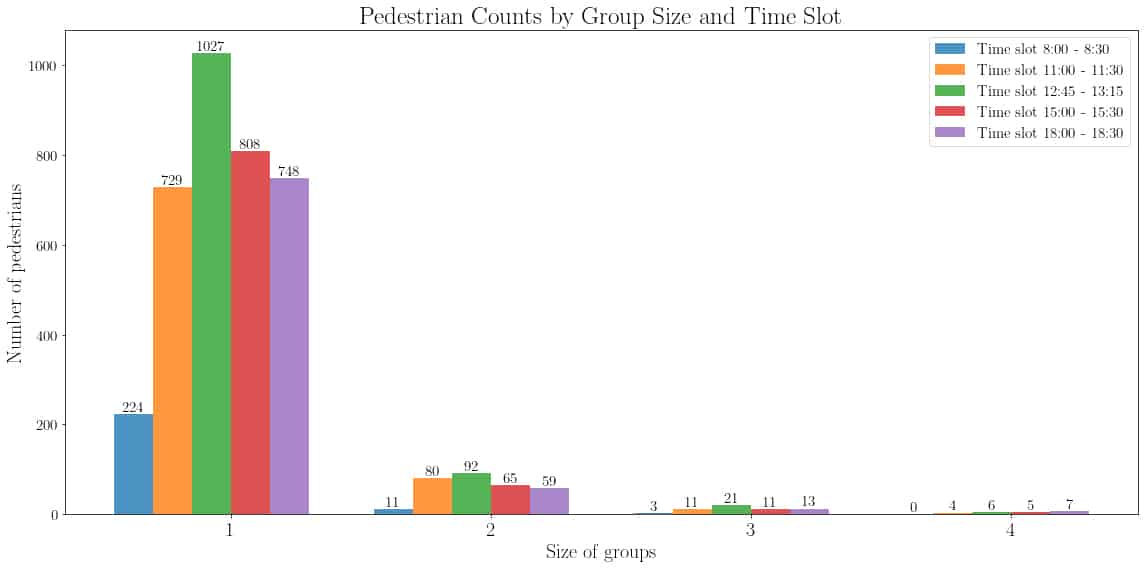
Groups of different sizes were obtained but in order to conduct analyses with higher accuracy it was decided to consider only two- and three-members groups. Analyzing the results (see Figure 9) considering all time slots, two-members groups represent the majority. The fact that the number of groups of more than two people is significantly lower is likely caused by the switch ID issue which makes it more difficult to find groups characterized by a higher number of people. Focusing on the single time slot, the 15:00-15:30 interval is the one with the highest number of identified groups. The same time slot has the highest number of identified single pedestrians.
The results related to distance, duration, speed and direction features considering single pedestrians and groups of two or three people are shown in Table 5.
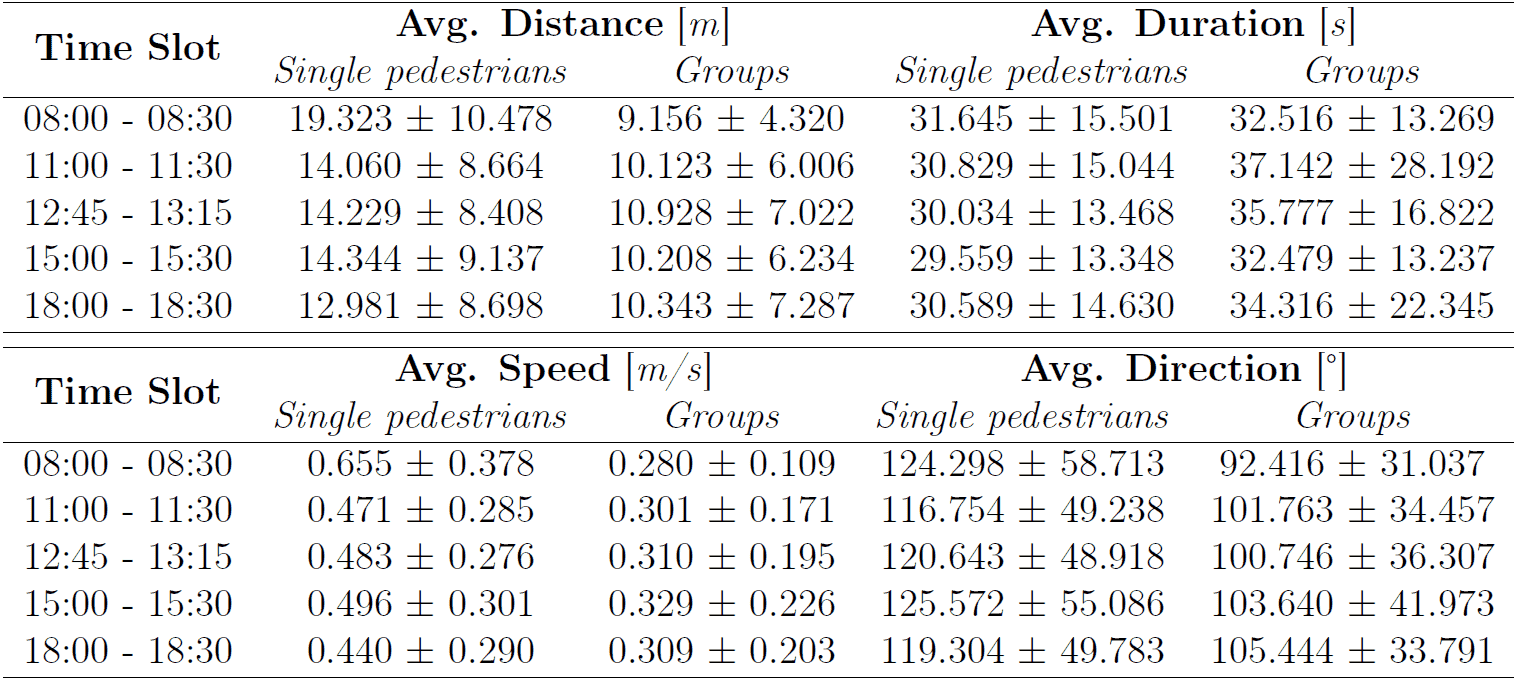
The number of pedestrians identified as being part of a group are fewer than the number of individual trajectories for all the five time slots considered. The average percentage of pedestrians belonging to groups (consisting of two or three people) is 17.305% ± 2.979 of all pedestrians in the square while the value for single pedestrians is 82.695% ± 2.979 considering the five-time intervals. The average distance traveled by both single pedestrians and groups is relatively consistent across all time slots. Considering the average duration of trajectories, it can be seen that groups tend to spend slightly more time traveling than single pedestrians. Regarding speed, the data indicates that single pedestrians cross the square at a higher speed than pedestrians identified as part of groups, with the highest value of 0.655 m/s in the 08:00 time slot.
An example of trajectories categorized into single pedestrians and groups for the 18:00-18:30 time slot is shown in Figure 10. As can be seen, the identified groups tend to be located in the first section of the square, near the statue and the subway accesses. It can also be seen in Figure 10 that there are fewer groups than single pedestrians.
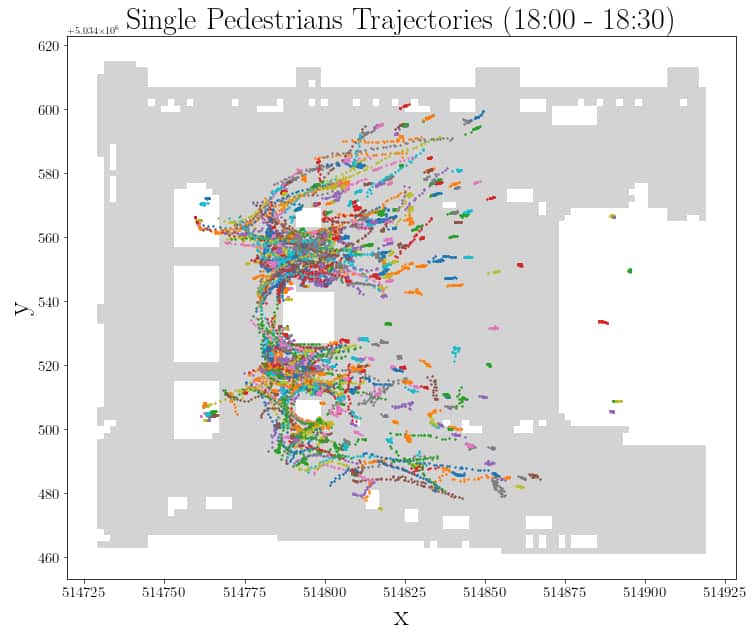
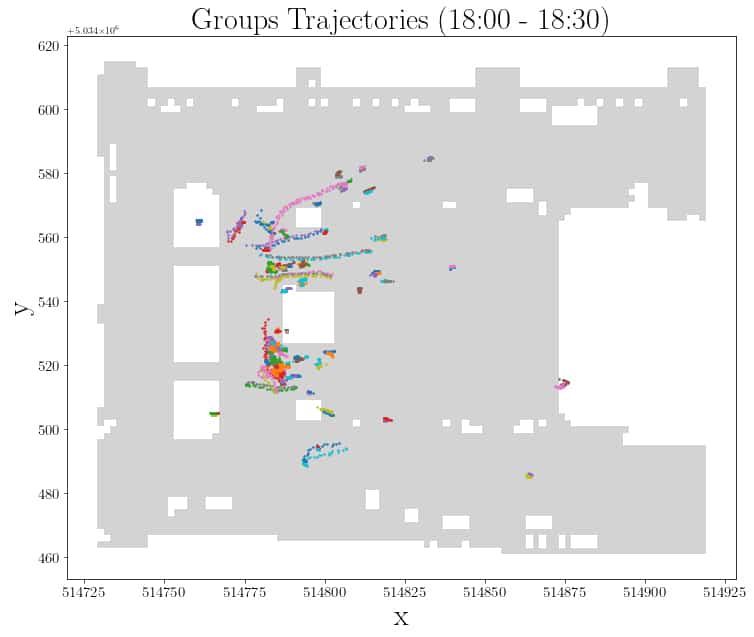
Figure 10 (a) Single pedestrians and (b) Groups for 18:00 – 18:30 time slot
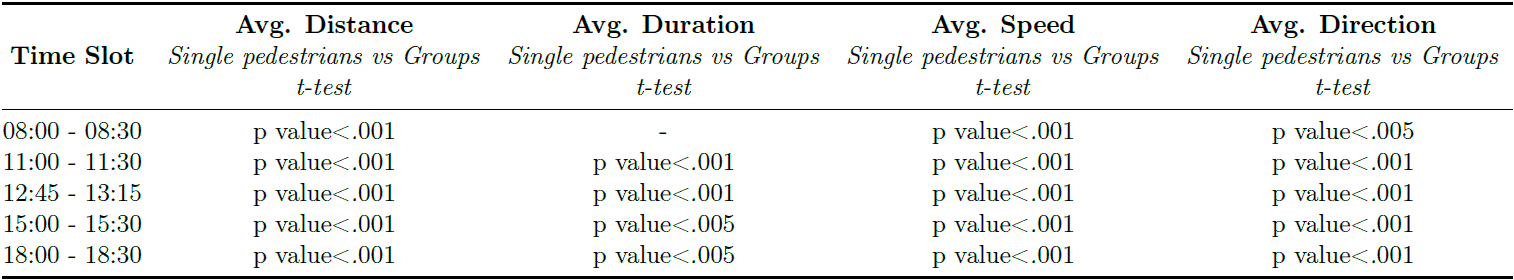
A similar procedure was then followed as previously by generating t-tests to confirm with more confidence the differences identified between single pedestrians and groups. Examining Table 6, it can be seen that the average values of the considered metrics (distance, duration, speed, direction) are significantly different for single pedestrians and groups considering the five time intervals except for the duration value in the first time slot. In the interval 08:00-08:30, considering duration, 224 single pedestrians (M = 31.645, SD = 15.501) compared to 31 pedestrians belonging to groups (M = 32.516, SD = 13.269) demonstrated a non-significant difference, t(255) = −0.298, p = .766.
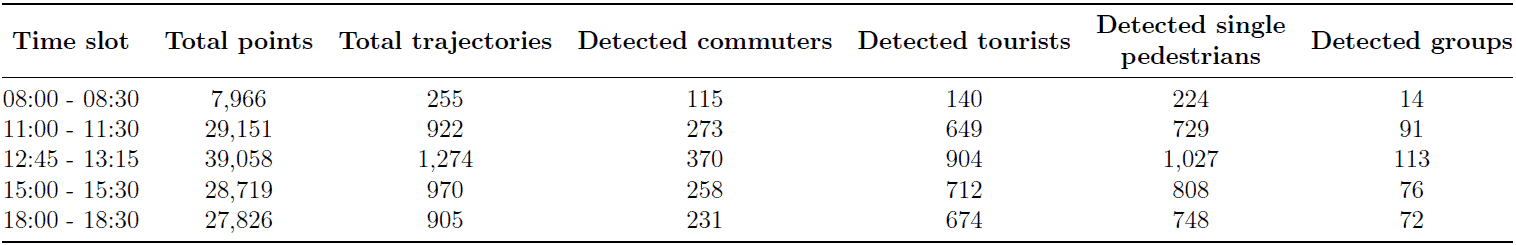
The results obtained for the clustering and group detection process are summarized in Table 7. The “Detected groups” value refers to the number of groups consisting of two or three people. As can be seen, the highest number of detections and trajectories identified is in the 15:00-15:30 time slot. This time slot also has the highest number of commuters and tourists. The same occurs also for single pedestrians and groups. On the other hand, the time slot that has the lowest values in terms of points and trajectories is the first time slot in the morning, 08:00-08:30.
Conclusions and Future Work
The aim of the research was to prove the potential of Urban Informatics in a concrete scenario. It involved the application of innovative computer vision techniques based on the concept of deep learning in the context of urban planning. The objective was to use CCTV camera videos of Piazza Duomo, one of Italy’s most important squares to detect and track pedestrians in order to extrapolate meaningful mobility patterns. The intent was to use urban planning metrics to characterize the urban space examined and identify different categories of pedestrians, including the presence or absence of groups, by using trajectories data collected through tracking video analytics techniques.
The results obtained clearly revealed the high potential of computer vision in conducting urban mobility analysis. However, if on one hand these innovative techniques can guarantee more accuracy and robustness in the urban planning analysis, on the other hand, relying on artificial intelligence techniques always requires careful and critical supervision by urban planners. Indeed, the algorithms used for the detection and tracking phases perform very well in non-dense crowd situations and with large pedestrians. Yet, in the examined scenario, the pedestrians to be identified and tracked are very small and there are crowded situations, thus the performance of these algorithms is not optimal. Furthermore, it emerged that there is a need for a larger number of annotated datasets reflecting also complex scenarios. The results obtained are relatively good considering the complexity of the dataset that was used, namely a dataset without annotations and characterized by very small and low-resolution pedestrians.
The urban planning metrics used have enabled a good characterization of urban space, nevertheless evidencing some limitations. The trajectory analysis allowed a reasonably accurate categorization of pedestrians. Based on the overall features of the trajectories, it was indeed possible to identify potential commuters and potential tourists through the use of clustering algorithms. The results obtained were also validated by means of statistical techniques such as t-tests. Similarly, the identification of groups of people was carried out with meaningful results. Overall, the obtained results allowed from raw trajectory data collected by detection and tracking algorithms to characterize pedestrian profiles and identify the presence of groups of pedestrians within the square.
Lastly, the results of this research could be relevant for the purposes of evidence based/ parametric approach for regeneration projects of urban public spaces. Furthermore, in the calibration/ validation process of computer-based pedestrian modeling and simulation systems, the proposed methodology could be useful.
Future developments could focus on the training phase of the detection and tracking algorithms in order to obtain more accurate results. Regarding the lack of annotated datasets for tracking small pedestrians in crowded scenes, it could be considered to manually annotate one of the available datasets and see if this can provide improvements. Alternatively, pedestrian micro-simulations that recreate complex and realistic scenarios could be used. Future work will be focused also on a deeper research and development of new metrics appropriate for such scenarios. To validate the results obtained in a more robust way, it might be useful to carry out inferences on datasets representing different scenarios.
The results of this research have been presented at the 11th edition of the Pedestrian Dynamics Conference (PED 2023) and will be presented at the European Transport Conference (ETC 2023).
Lorgna, L., Ceccarelli, G., Gorrini, A., Ciavotta, M. (2023, accepted). Video Analytics for Understanding Pedestrian Mobility Patterns in Public Spaces: The Case of Milan. In: 11th International Conference on Pedestrian and Evacuation Dynamics (PED2023), June 28-30, 2023, Eindhoven, The Netherlands.
Lorgna, L., Ceccarelli, G., Gorrini, Ciavotta, M. (2023). Video Analytics for Understanding Pedestrian Mobility Patterns in Public Spaces: The Case of Milan. In: 51th European Transport Conference 2023 (ETC 2023), 6-8 September 2023, Milan (Italy).
Acknowledgments
The research work has been carried out in collaboration with Lorenzo Lorgna, as part of his M.Sc. in Data Science at the Università degli Studi di Milano-Bicocca (Milan, Italy). We thank Prof. Michele Ciavotta (Department of Computer Science, University of Milan-Bicocca) for his contribution to this research. The analyzed data were treated according to the GDPR-General Data Protection Regulation (EU, 2016/679). This research received no specific grant from any funding agency in the public, commercial, or not-for-profit sectors.
References
Aziz, L., Haji Salam, Md. S. B., Sheikh, U. U., & Ayub, S. (2020). Exploring Deep Learning-Based Architecture, Strategies, Applications and Current Trends in Generic Object Detection: A Comprehensive Review. IEEE Access, 8, 170461–170495. https://doi.org/10.1109/ACCESS.2020.3021508
Bewley, A., Ge, Z., Ott, L., Ramos, F., & Upcroft, B. (2016). Simple online and realtime tracking. 2016 IEEE International Conference on Image Processing (ICIP), 3464–3468. https://doi.org/10.1109/ICIP.2016.7533003
Bierlaire, M., & Robin, T. (2009). Pedestrians Choices. In H. Timmermans (Ed.), Pedestrian Behavior (pp. 1–26). Emerald Group Publishing Limited. https://doi.org/10.1108/9781848557512-001
Ceccarelli, G., Messa, F., Gorrini, A., Presicce, D., and Choubassi, R. (2023a, submitted). Deep learning video analytics for the assessment of street experiments: The case of Bologna. Journal of Urban Mobility.
Ceccarelli, G., Presicce, D., Deponte, D. (2023b, in press). Looking with Machine Eyes: City Monitoring for Urban Resilience. In: Zhao, H. & Li, T. (eds). Resilience vs. Pandemics: Innovations in the Built Environment, Springer.
Ciaparrone, G., Sánchez, F. L., Tabik, S., Troiano, L., Tagliaferri, R., & Herrera, F. (2020). Deep Learning in Video Multi-Object Tracking: A Survey. Neurocomputing, 381, 61–88. https://doi.org/10.1016/j.neucom.2019.11.023
City of Montreal (2020). Images annotées – caméras de circulation. Available at: https://donnees.montreal.ca/ville-de-montreal/images-annotees-cameras-circulation
Derrick, I. A. (1999). Pedestrian detection by computer vision. Doctoral Dissertation, Edinburgh Napier University.
Farrokhtala, A., Chen, Y., Hu, T., & Ye, S. (2018). Toward Understanding Hidden Patterns in Human Mobility Using Wi-Fi. 2018 IEEE Canadian Conference on Electrical & Computer Engineering (CCECE), 1–4. https://doi.org/10.1109/CCECE.2018.8447727
Feng, Y., Duives, D., Daamen, W., & Hoogendoorn, S. (2021). Data collection methods for studying pedestrian behaviour: A systematic review. Building and Environment, 187, 107329. https://doi.org/10.1016/j.buildenv.2020.107329
Gorrini, A., Messa, F., Ceccarelli, G., & Choubassi, R. (2121). Covid-19 pandemic and activity patterns in Milan. Wi-Fi sensors and location-based data. TeMA – Journal of Land Use, Mobility and Environment, 14(2), 211–226. https://doi.org/10.6093/1970-9870/7886
Gorrini, A., Vizzari, G., & Bandini, S. (2016). Age and Group-driven Pedestrian Behaviour: From Observations to Simulations. Collective Dynamics, 1, 1–16. https://doi.org/10.17815/CD.2016.3
Hou, J., Chen, L., Zhang, E., Jia, H., & Long, Y. (2020). Quantifying the usage of small public spaces using deep convolutional neural network. PLOS ONE, 15(10), e0239390. https://doi.org/10.1371/journal.pone.0239390
Ibrahim, M. R., Haworth, J., & Cheng, T. (2020). Understanding cities with machine eyes: A review of deep computer vision in urban analytics. Cities, 96, 102481. https://doi.org/10.1016/j.cities.2019.102481
Jiang, K., Xie, T., Yan, R., Wen, X., Li, D., Jiang, H., Jiang, N., Feng, L., Duan, X., & Wang, J. (2022). An Attention Mechanism-Improved YOLOv7 Object Detection Algorithm for Hemp Duck Count Estimation. Agriculture, 12(10), Article 10. https://doi.org/10.3390/agriculture12101659
Jiao, L., Zhang, F., Liu, F., Yang, S., Li, L., Feng, Z., & Qu, R. (2019). A Survey of Deep Learning-based Object Detection. IEEE Access, 7, 128837–128868. https://doi.org/10.1109/ACCESS.2019.2939201
Lin, M., & Hsu, W.-J. (2014). Mining GPS data for mobility patterns: A survey. Pervasive and Mobile Computing, 12, 1–16. https://doi.org/10.1016/j.pmcj.2013.06.005
Liu, L., Ouyang, W., Wang, X., Fieguth, P., Chen, J., Liu, X., & Pietikäinen, M. (2019). Deep Learning for Generic Object Detection: A Survey (arXiv:1809.02165). arXiv. https://doi.org/10.48550/arXiv.1809.02165
Messa, F., Ceccarelli, G., Gorrini, A., Presicce, D., Choubassi, and Choubassi (2022). Deep learning video analytics to assess vga measures and proxemic behaviour in public spaces. In 13th International Space Syntax Symposium (13SSS), 22-24 June 2022, Bergen (Norway), pages 1–22. Available at: https://www.hvl.no/globalassets/hvl-internett/arrangement/2022/13sss/479messa.pdf
Niu, T., Qing, L., Han, L., Long, Y., Hou, J., Li, L., Tang, W., & Teng, Q. (2022). Small public space vitality analysis and evaluation based on human trajectory modeling using video data. Building and Environment, 225, 109563. https://doi.org/10.1016/j.buildenv.2022.109563
Tomè, D., Monti, F., Baroffio, L., Bondi, L., Tagliasacchi, M., & Tubaro, S. (2016). Deep convolutional neural networks for pedestrian detection. Signal Processing: Image Communication, 47, 482–489. https://doi.org/10.1016/j.image.2016.05.007
Tripathi, G., Singh, K., & Vishwakarma, D. K. (2019). Convolutional neural networks for crowd behaviour analysis: A survey. The Visual Computer, 35(5), 753–776. https://doi.org/10.1007/s00371-018-1499-5
Zhang, F., Miranda, A. S., Duarte, F., Vale, L., Hack, G., Chen, M., Liu, Y., Batty, M., & Ratti, C. (2023). Urban Visual Intelligence: Studying Cities with AI and Street-level Imagery (arXiv:2301.00580). arXiv. https://doi.org/10.48550/arXiv.2301.00580
Zhao, Z.-Q., Zheng, P., Xu, S., & Wu, X. (2019). Object Detection with Deep Learning: A Review (arXiv:1807.05511). arXiv. https://doi.org/10.48550/arXiv.1807.05511
Zou, Z., Chen, K., Shi, Z., Guo, Y., & Ye, J. (2023). Object Detection in 20 Years: A Survey (arXiv:1905.05055). arXiv. https://doi.org/10.48550/arXiv.1905.05055