
This study, carried out by Transform Transport in collaboration with the European Commission – Joint Research Centre (JRC) and IT:U Interdisciplinary Transformation University, investigates whether geo-social media can capture perceptions of urban security as a component of transport poverty. Using over one million geo-referenced X posts from Milan and twelve million from New York City, an NLP pipeline identified expressions of fear and insecurity with a focus on women’s mobility. Although spatial patterns were evident, with centralised activity in Milan and more dispersed clusters in New York, correlations between patterns in X posts with previous studies and official security and crime data were weak. Alternatively, Google Maps reviews were also analyzed in Milan showing similar limitations. These results indicate that geo-social media (X posts and Google Maps reviews) provide scalable but low-reliability insights, reinforcing the need for more robust and multimodal approaches to understanding urban security perceptions.
Introduction
Perceived security is a key factor shaping how people move through cities and access transport services, influencing route choices, modal preferences and overall mobility experiences. These effects are especially pronounced for women, gender minorities, children and socio-economically vulnerable groups, who often face heightened concerns related to safety (Farina et al., 2022; European Investment Bank, 2024; Levy, 2013; Pain, 2001). Within the broader discourse on transport poverty, insecurity emerges as a barrier to equitable access, reinforcing inequalities that the European Union seeks to address through its goals on social inclusion and climate neutrality.
Traditionally, information on how safe people feel in specific places has been gathered through surveys or specialised mobile applications (Dubey et al., 2025). While these methods offer high-quality local insights, they are resource-intensive and difficult to scale across regions. The increasing availability of geo-referenced user-generated content on platforms such as X and Google Maps presents an alternative source for capturing real-time perceptions and emotional responses with fine spatial detail (Crooks et al., 2015). This study investigates whether such data can serve as a reliable proxy for perceived transport security by applying natural language processing and spatial analysis to large datasets from Milan and New York City.
Crowdsourced geo-social media has become an established tool in urban research, supporting analysis of behavioural patterns, mobility dynamics and public sentiment (Crooks et al., 2015; Lin & Geertman, 2019). Applications range from sentiment and emotion extraction to multimodal integration with traffic flows, socio-demographic profiles and mobile phone data to enrich contextual understanding (Bao et al., 2017; Honzák et al., 2024). These developments highlight the growing potential of digital traces to complement traditional data sources and offer new perspectives on how people perceive safety and risk in urban environments.
At the policy level, the European Union is strengthening efforts to measure transport equity and address transport poverty as a multidimensional issue that includes adequacy factors such as perceived security (European Commission, 2024). The European Commission’s Recommendation on transport poverty (European Commission, 2025a) and related initiatives, including the EU Anti-Poverty Strategy and the Social Climate Fund (European Commission, 2025b), underscore the need for robust indicators that identify where vulnerabilities occur. Against this backdrop, the present study evaluates the capacity of geo-social media to support such indicators by comparing model outputs with ground-truth data (i.e. self-reported security perceptions in Milan and recorded crime incidents in New York City) thus providing an empirical basis for assessing the strengths and limitations of these emerging methods.
Enabling Data
The data collection process included the acquisition and preparation of datasets from three sources: (i) geo-social media data, (ii) security perception data and (iii) geo-referenced user review data.
Geo-social Media Data
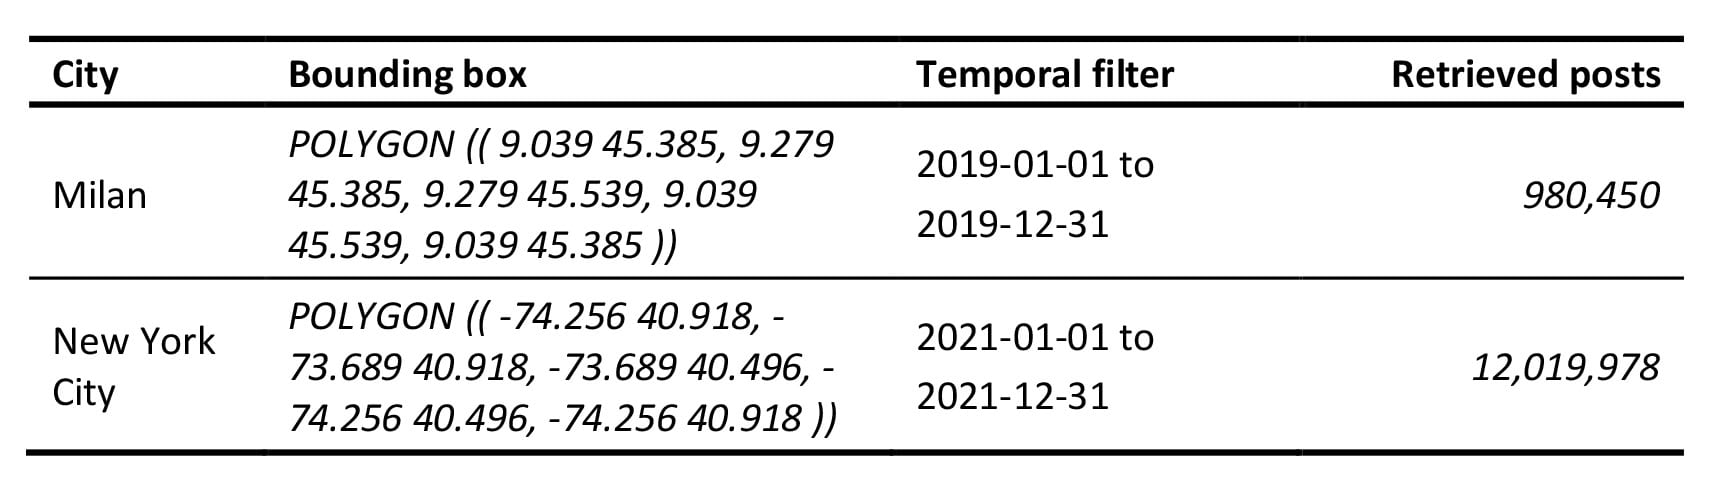
The geo-social media inputs consist of two datasets of posts retrieved from X (formerly Twitter), selected to match available baseline data on women’s security perception for Milan in 2019 (Messa et al., 2025)) and New York City in 2021 (Gorrini et al., 2021). Posts were collected through the former Twitter v1.1 search and filtered streaming API endpoints, restricted to geo-located content within the two cities and to the corresponding years. Each post includes a timestamp, geo-location in the form of point coordinates or bounding boxes, text content and metadata. To ensure spatial accuracy, only bounding boxes with zero area were retained and all others were simplified to centroids, after which duplicates, empty strings and posts outside city boundaries were removed. Texts were pre-processed by normalising usernames and links before applying sentiment and emotion detection and semantic classification.
Security Perception Data
The security perception datasets for Milan and New York City stem from previous research conducted by Transform Transport. The Milan dataset derives from the STEP UP – Walkability for Women in Milan project, where a synthetic “Safety Score” was estimated using a Geographically Weighted Regression model calibrated with crowdsourced street-level perceived security ratings (Abdelfattah et al., 2024; Messa et al., 2025). The New York City dataset, developed for the Walkability for Women Index (Gorrini et al., 2021), represents security conditions through sexual crimes reported to the New York City Police Department, as analyzed through the New York study. Both datasets carry inherent limitations: Milan’s crowdsourced scores reflect a narrow contributor demographic, while NYC’s crime data is influenced by uneven reporting behaviours and well-documented shortcomings of crime statistics as proxies for perceived security.
Geo-referenced User Review Data
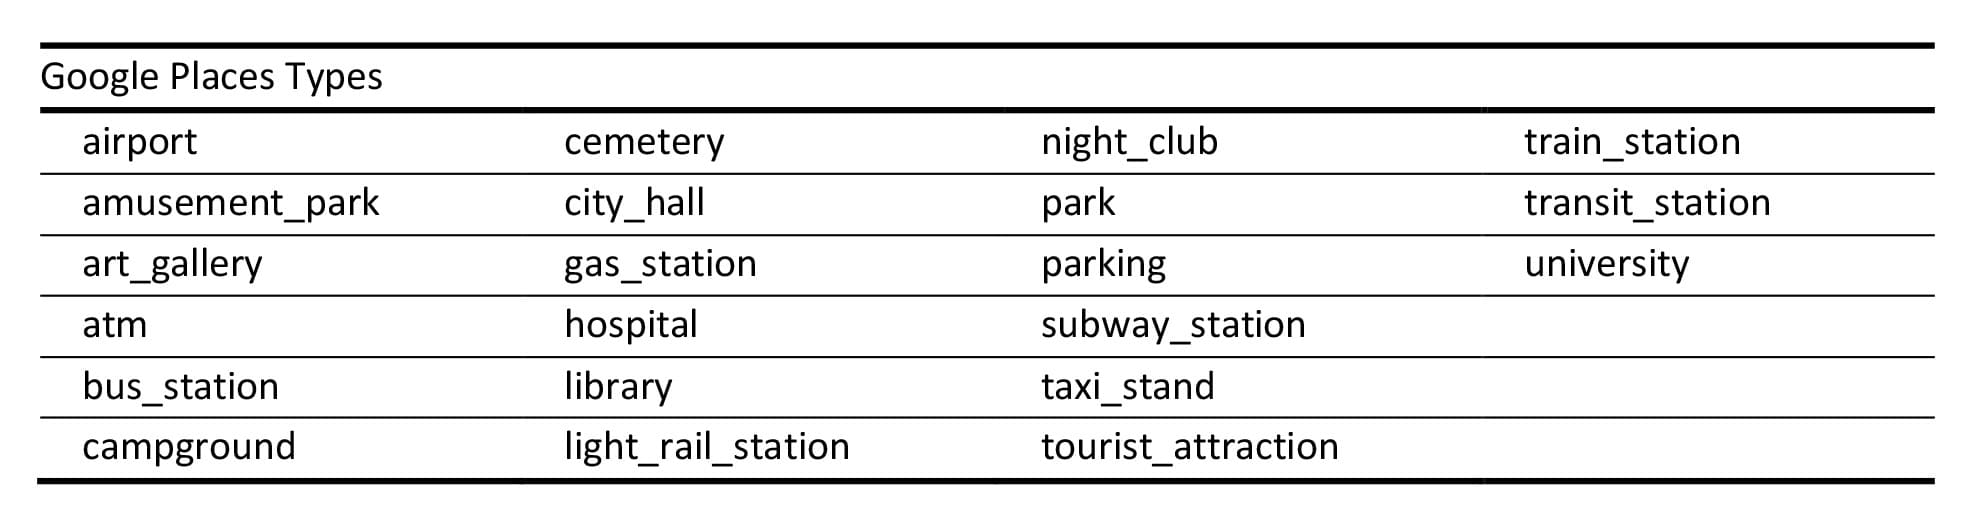
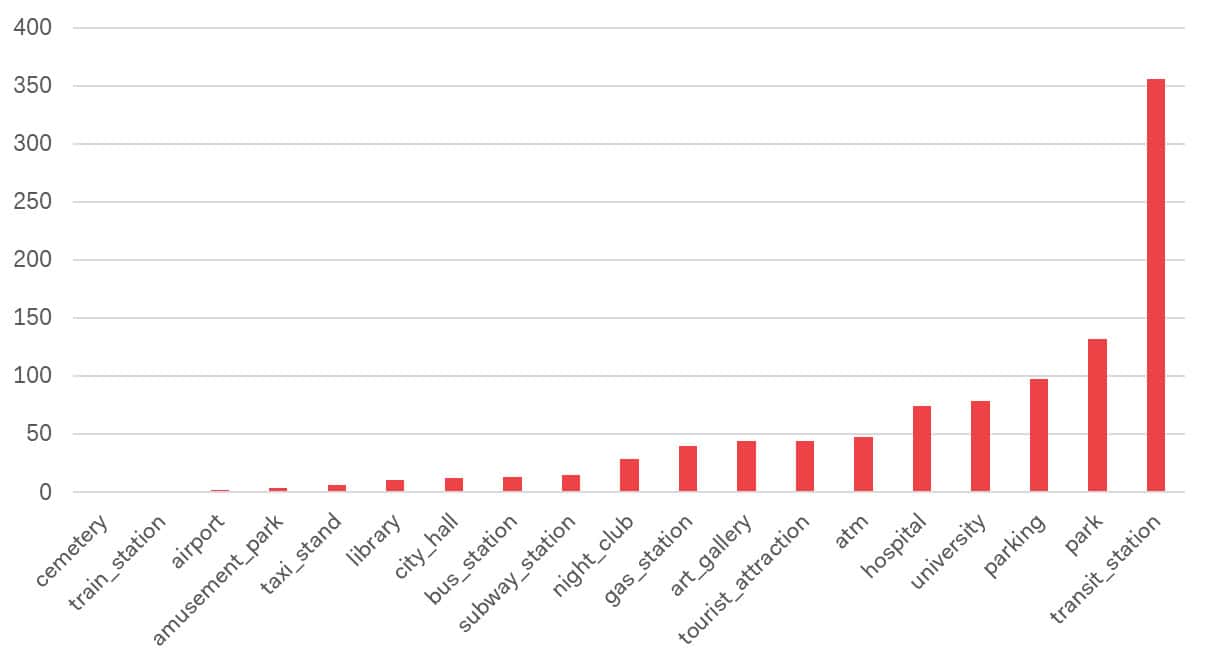
Google Places data was examined as an alternative source to compare with X microblogging posts in terms of content relevance and suitability for deriving structured security-related insights. Place reviews were obtained from Google Places data initially collected in July 2024 for the Night City accessibility study (Abdelfattah et al., 2025). Using the Nearby Search API, 135,405 unique places within Milan were retrieved, each described by basic metadata such as place_id, name, coordinates and type. To focus on settings relevant to public activity and transport-related environments, the dataset was filtered based on Google Place Types, resulting in 10,296 places (see fig.1). Due to the 1,000-request limit of the Places Details API, a stratified random sample of roughly 10 percent (1,009 places) was selected. Up to five reviews per place were collected in July 2025, yielding 2,037 valid, pre-processed reviews in Italian or English, which formed the dataset for further analysis.
Methodology
The methodological approach combines text-based machine learning, semantic classification and spatial analysis to assess whether geo-social media can reflect perceived security in Milan and New York City. The workflow integrates sentiment and emotion detection, few-shot semantic modelling, spatial aggregation, validation against reference datasets and supplementary analysis of Google Place reviews.
Sentiment and Emotion Analysis
To extract affective signals from X posts, the study applied a dual approach combining emotion and sentiment analysis based on multilingual transformer models. Emotion detection used the XLM-EMO-T model (Bianchi et al., 2022), which identifies four emotion classes (joy, anger, fear and sadness) based on a probability threshold of 0.5. Although the model reports a macro F1-score of 0.85, manual inspection revealed frequent misclassifications, prompting the use of a complementary polarity classifier. For sentiment polarity, Twitter-RoBERTa-base-sentiment (Loureiro et al., 2022) was applied to the primarily English NYC dataset, while the multilingual Twitter-XLM-RoBERTa-base-sentiment (Barbieri et al., 2022) was used for the more linguistically diverse Milan dataset, classifying posts as positive, neutral or negative. Indicators of insecurity were derived from the combined presence of fear and negative polarity to identify posts expressing insecurity, discomfort, or perceived danger.
Few-shot Semantic Analysis
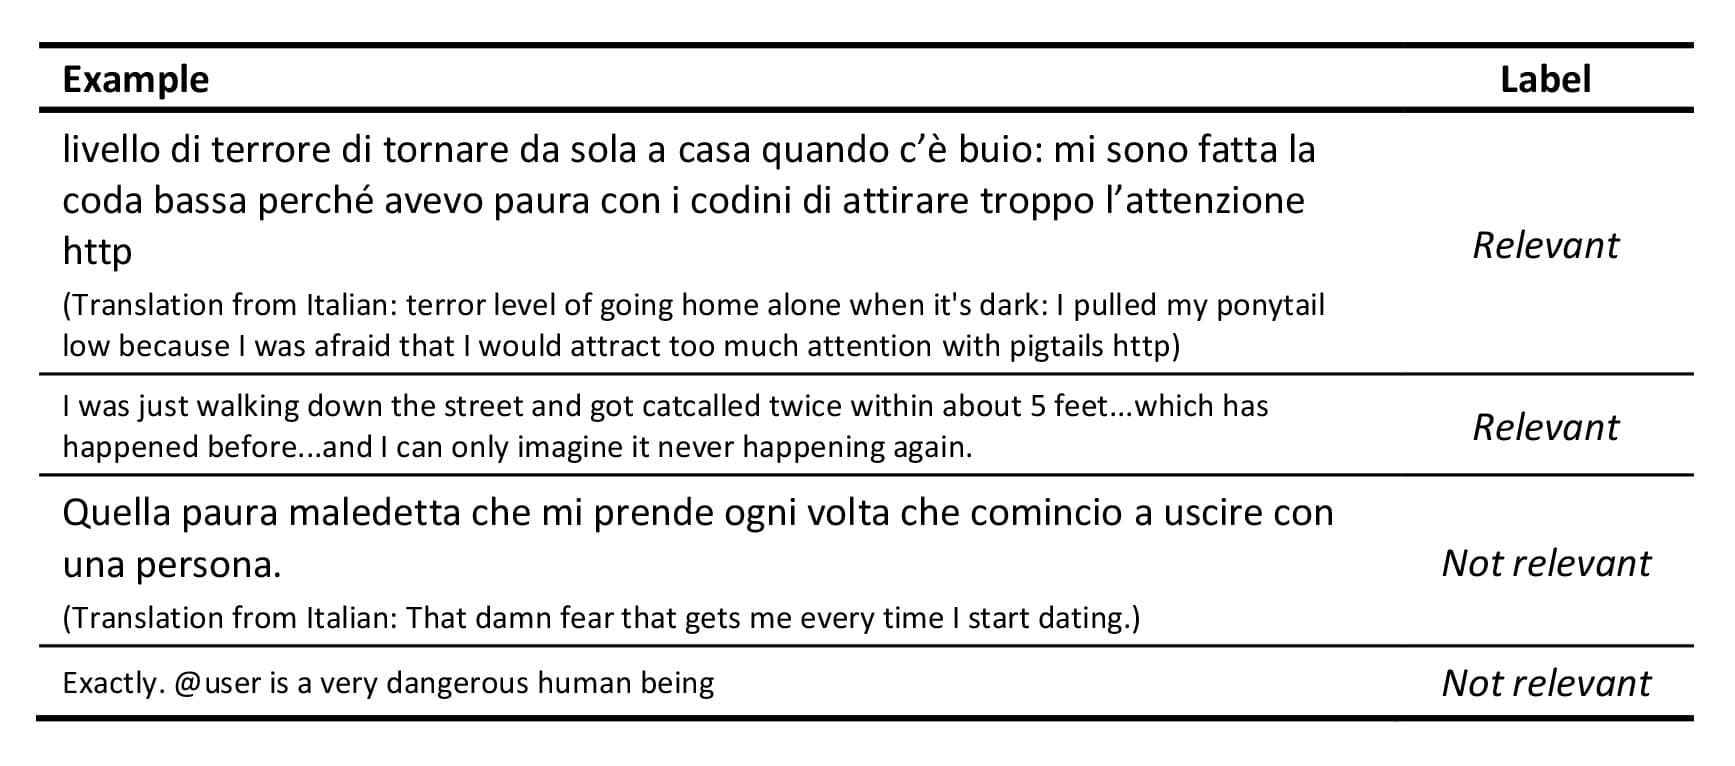
A few-shot semantic classifier was developed to identify posts explicitly related to women’s perceived urban security. A manually annotated dataset of 141 posts, balanced between relevant and non-relevant examples, supported model training using SetFit (Tunstall et al., 2022), a lightweight fine-tuning framework based on sentence transformers (Reimers & Gurevych, 2019). The multilingual-e5-base model (Wang et al., 2024) was fine-tuned using TPE optimisation (Watanabe, 2023) to maximise F1-score, with optimal hyperparameters including a learning rate of 4.23e-5, two epochs, batch size 16 and ten pair-generation iterations. Evaluation using accuracy, precision, recall and F1 score provided an indication of performance given the small sample size, and the resulting classifier was applied alongside sentiment and emotion outputs to isolate posts relevant to perceived security.
Spatial Aggregation and Classification
To analyse spatial patterns, posts were aggregated using an H3 hexagonal grid (Uber, 2018) at resolution 9, corresponding to an average edge length of 200.79 metres and ensuring comparability with the security perception datasets. For each hexagon, the number of posts expressing negative sentiment, containing fear indicators or classified as relevant by the semantic model was computed. This aggregation provided a consistent framework for comparing geo-social media signals with city-level security perception metrics.
Spatial Analyses and Model Testing
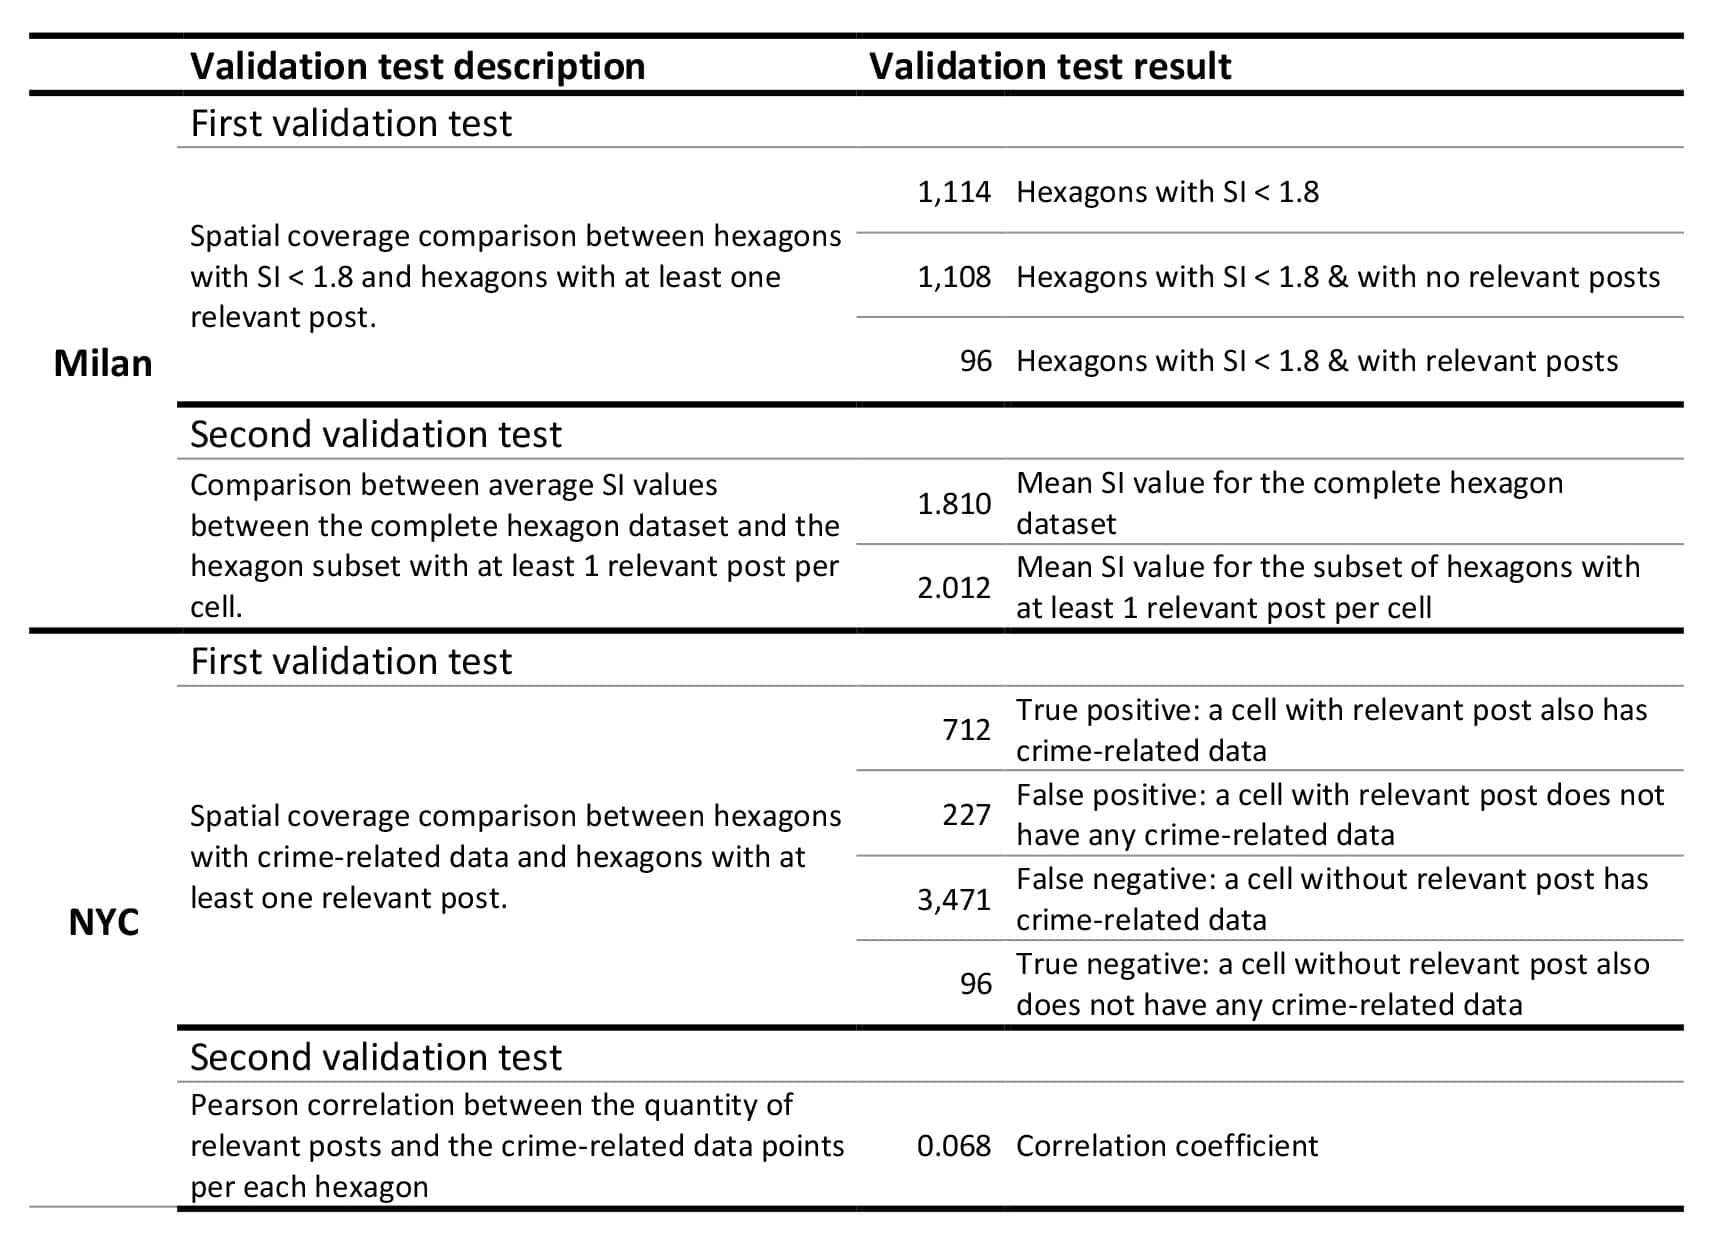
Validation strategies were tailored to the available ground-truth data in each city. In Milan, comparisons were made with the STEP UP synthetic Safety Score, which ranges from 1 (“Feels very unsafe”) to 3 (“Feels very safe”), with scores below 1.8 indicating perceived uneasiness (Abdelfattah et al., 2024; Messa et al., 2025). Hexagons were evaluated based on the presence or absence of relevant posts, and differences in average Safety Score were assessed for cells with at least one relevant post. In New York City, relevant posts were compared with the spatial distribution of sexual crime reports, aggregated per hexagon. Evaluation focused on identifying true positives, false positives, false negatives and true negatives, alongside calculating the Pearson correlation between the number of relevant posts and the number of crime incidents.
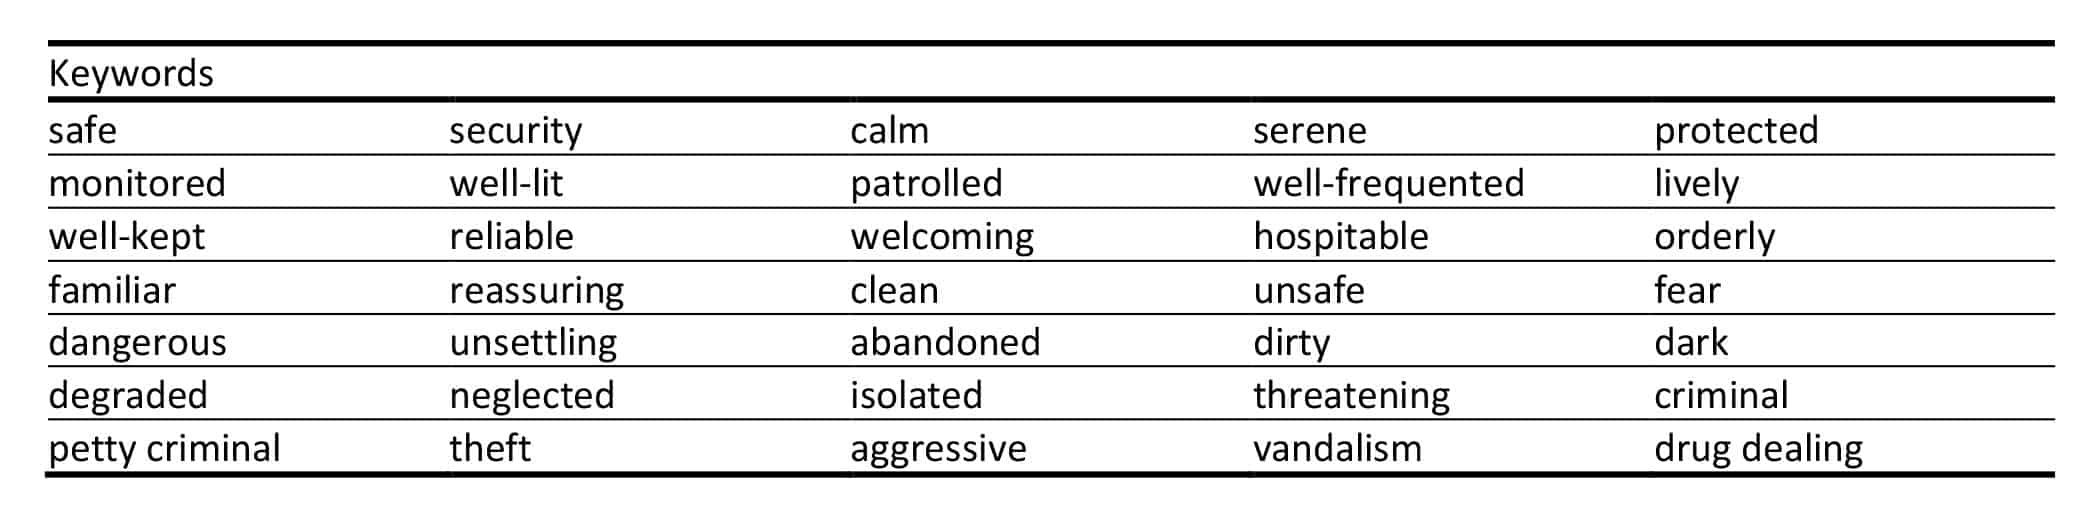
Social Media-based Keyword Analysis
To complement NLP-based classification, a keyword lookup approach was applied to both X datasets, using a list of contextually relevant terms (see Table 4). This reduced complexity to a binary measure of keyword presence or absence, following a strategy used by the authors in a previous study analysing shifts in term frequency during the Covid-19 pandemic (Messa et al., 2021). As with the semantic classification tests, keyword presence was compared with binary representations of baseline security perception data: the STEP UP Safety Index for Milan and crime distribution data for New York City.
Google Place Reviews Validation and Analysis
To address low social media coverage in Milan and explore an alternative geo-social source, Google Places data (Google maps place reviews) were analysed using the SetFit semantic model trained on X data. Model predictions were validated through a three-step manual review: a general performance check on 350 randomly selected reviews, a keyword-based assessment of 401 reviews containing terms from Table 4 and an evaluation of 204 reviews classified as relevant with confidence scores above 0.7. The comparison between manual annotations and model predictions assessed classification accuracy and helped identify patterns of relevance across different place types, such as parks and public transport locations. This validation informed the interpretation of review content and assessed the transferability of the semantic model to heterogeneous user-generated data.
Results
Characteristics of the Geo-social Media Data
The two X datasets differed substantially in size, composition and spatial coverage, shaping their analytical potential. After cleaning and filtering, the NYC dataset contained more than 1.1 million posts from over 100,000 users, compared with 142,054 posts from 25,985 users in Milan. Retention rates also varied, with Milan keeping 14.5% of its retrieved posts and NYC 9.6%. Language distributions reflected local contexts: Milan’s dataset included a mix of Italian (51.0%), English (29.3%) and other languages, while NYC was overwhelmingly dominated by English (93.6%). Spatially, posts in Milan were strongly centralised, whereas NYC showed broad activity across multiple boroughs. These baseline differences underscore the unevenness of geo-social media as a data source and influence the reliability of subsequent analyses.
Performance of Semantic and Affective Classifiers
The few-shot semantic classifier performed moderately well on the small test dataset, achieving an accuracy of 0.72 but producing many false positives when applied at scale. While it successfully captured all relevant posts in the test set, its precision was low (0.50), meaning that many posts labelled as relevant were in fact unrelated to women’s security concerns. Applied to the full datasets, the classifier marked 59.3% of Milan posts and 69.2% of NYC posts as relevant, far exceeding realistic expectations. For this reason, a stricter filter was introduced, identifying posts only when they were simultaneously semantically relevant, negative in sentiment and expressing fear. This significantly narrowed the results to a more plausible set: 711 posts in Milan (0.501%) and 3,773 posts in NYC (0.328%). Manual review confirmed that this filtered subset far more accurately reflected accurate expressions of discomfort, fear or perceived threat.
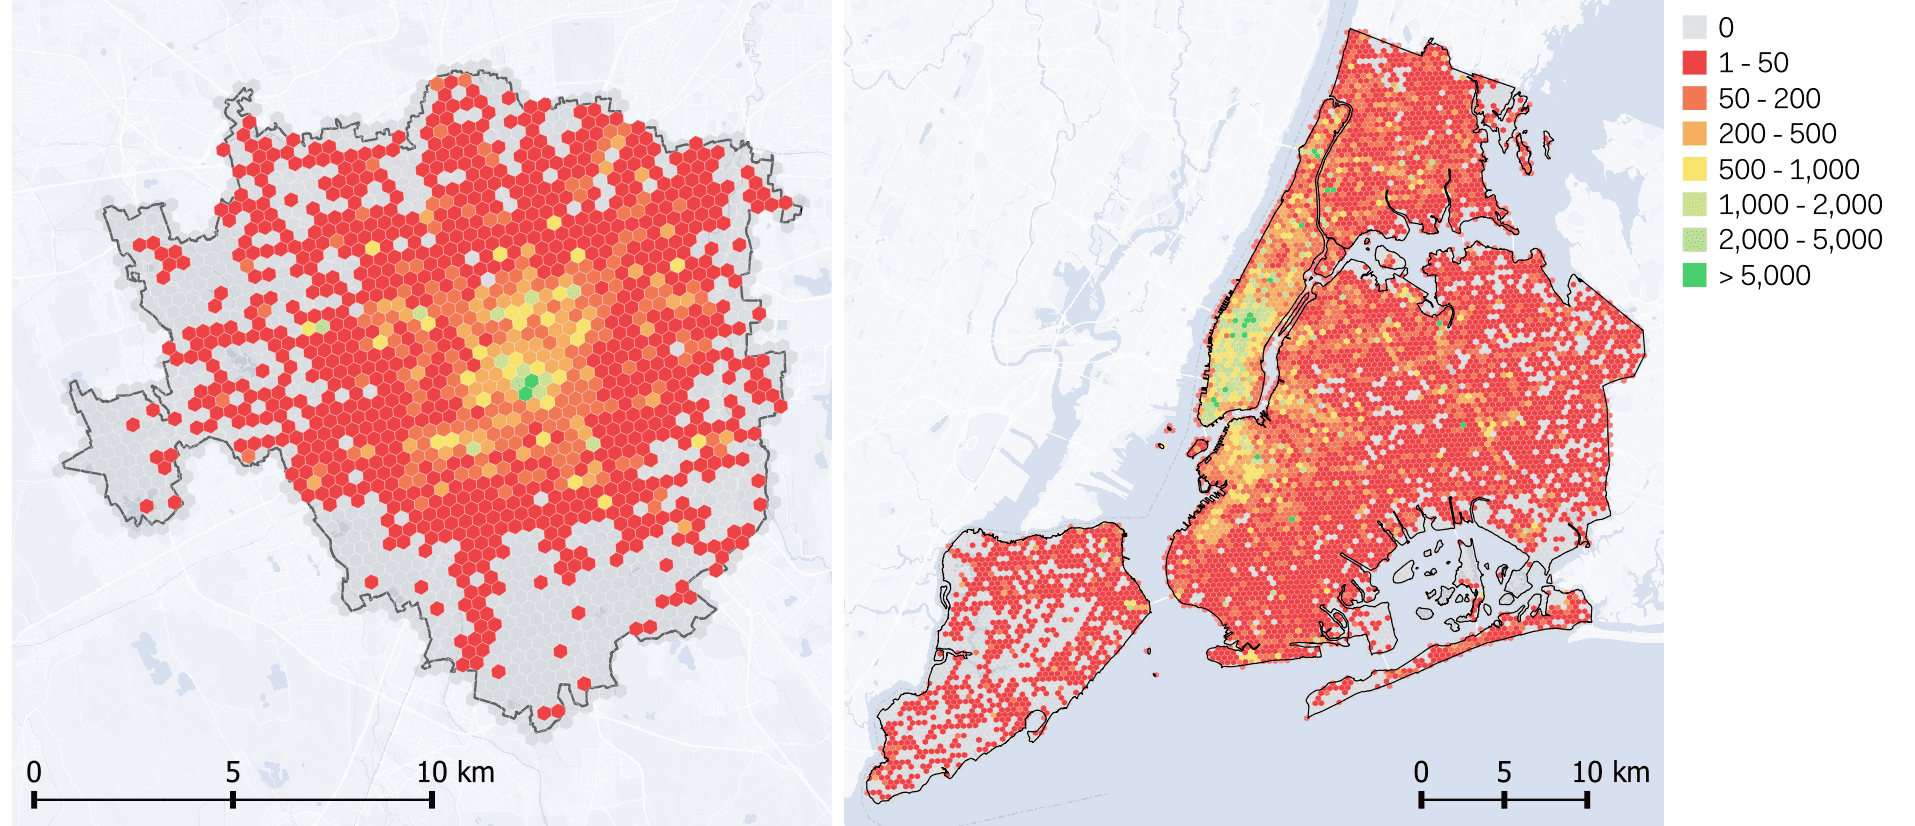
Spatial Patterns of Activity and Security-related Posts
Spatial aggregation using the H3 grid revealed distinct posting patterns across the two cities (see fig.2). Milan showed a dense cluster of posts in the central areas, with sparse activity in the periphery, while NYC displayed broader distribution with clusters across Manhattan, Brooklyn, Queens and transport corridors.
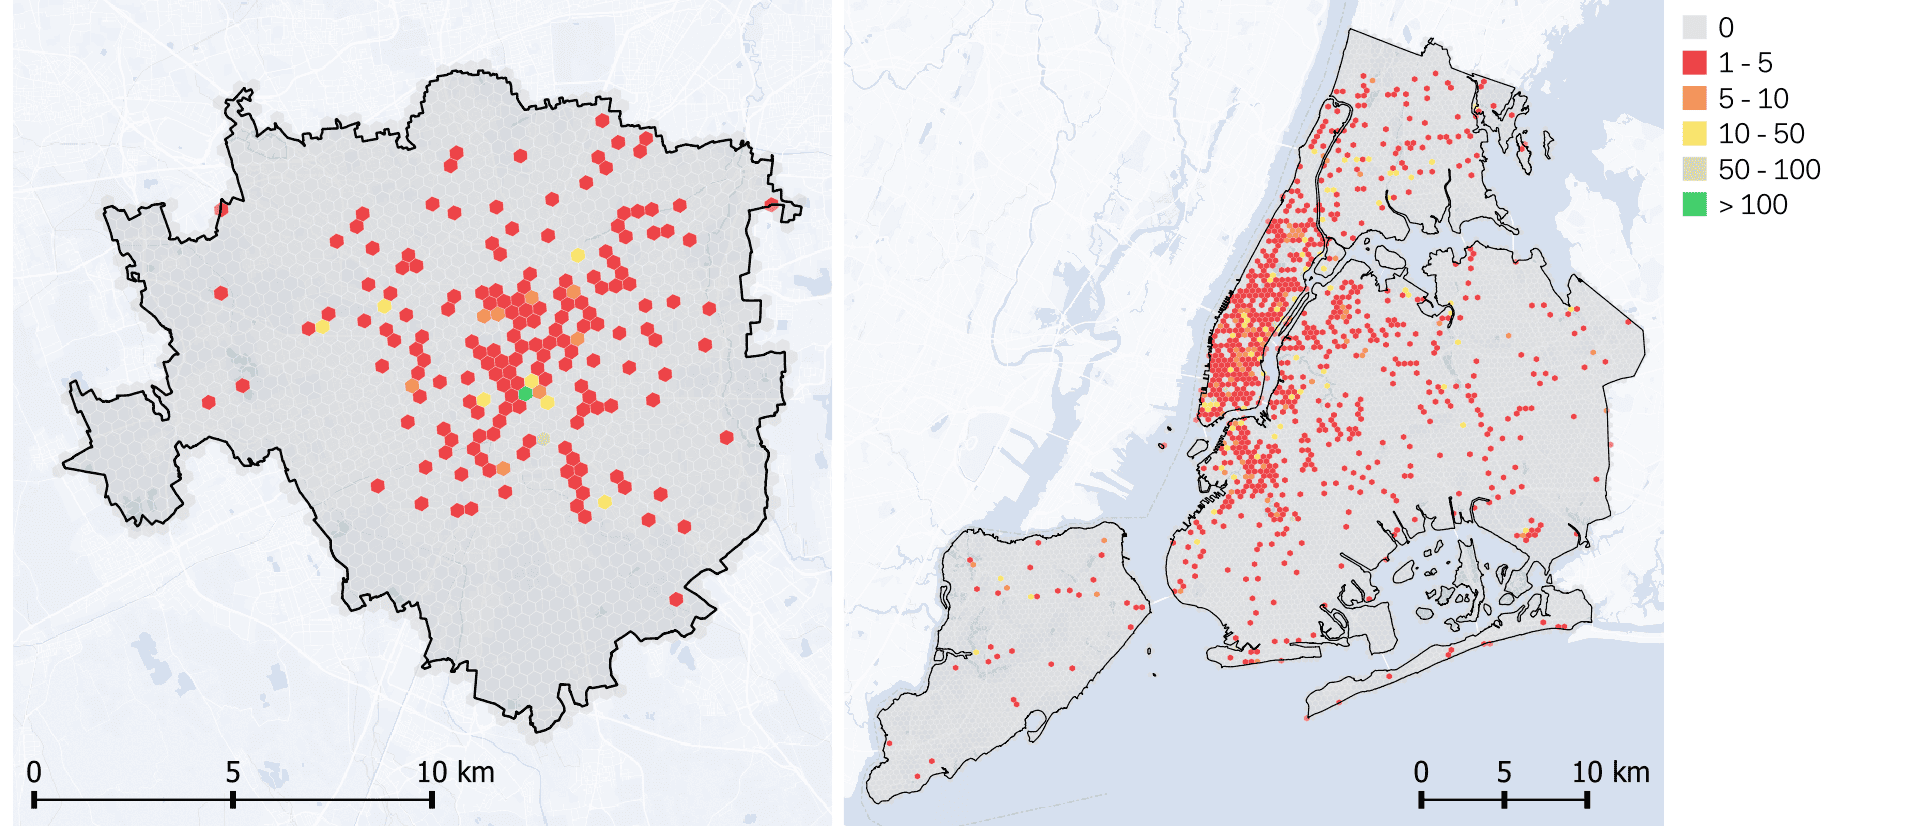
When focusing on posts meeting the stricter relevance criteria, coverage decreased considerably in both cases, reflecting the rarity of security-related expressions (see fig.3). NYC still exhibited a wider spread of such posts than Milan, mirroring its larger user base and broader posting footprint. These patterns illustrate that the detectability of security concerns in social media is strongly shaped by underlying posting behaviour rather than the phenomenon being studied.
Comparison with Ground-Truth Security Indicators
Validation against independent security perception and crime datasets revealed little to no alignment with social media indicators. In Milan, only 8.6% of hexagons with a low Safety Index (below 1.8) contained at least one relevant post, and cells with relevant posts paradoxically showed higher average safety scores than the citywide mean. In New York City, while true positives were relatively high, the analysis was dominated by false negatives: 83% of hexagons with crime incidents contained no relevant posts, and the correlation between the number of relevant posts and crime counts was negligible (r = 0.068). Across both cities, social media signals failed to capture the spatial distribution of perceived or reported insecurity, demonstrating that, currently, geo-social media (X in particular), is not a reliable proxy for these phenomena at city scale.
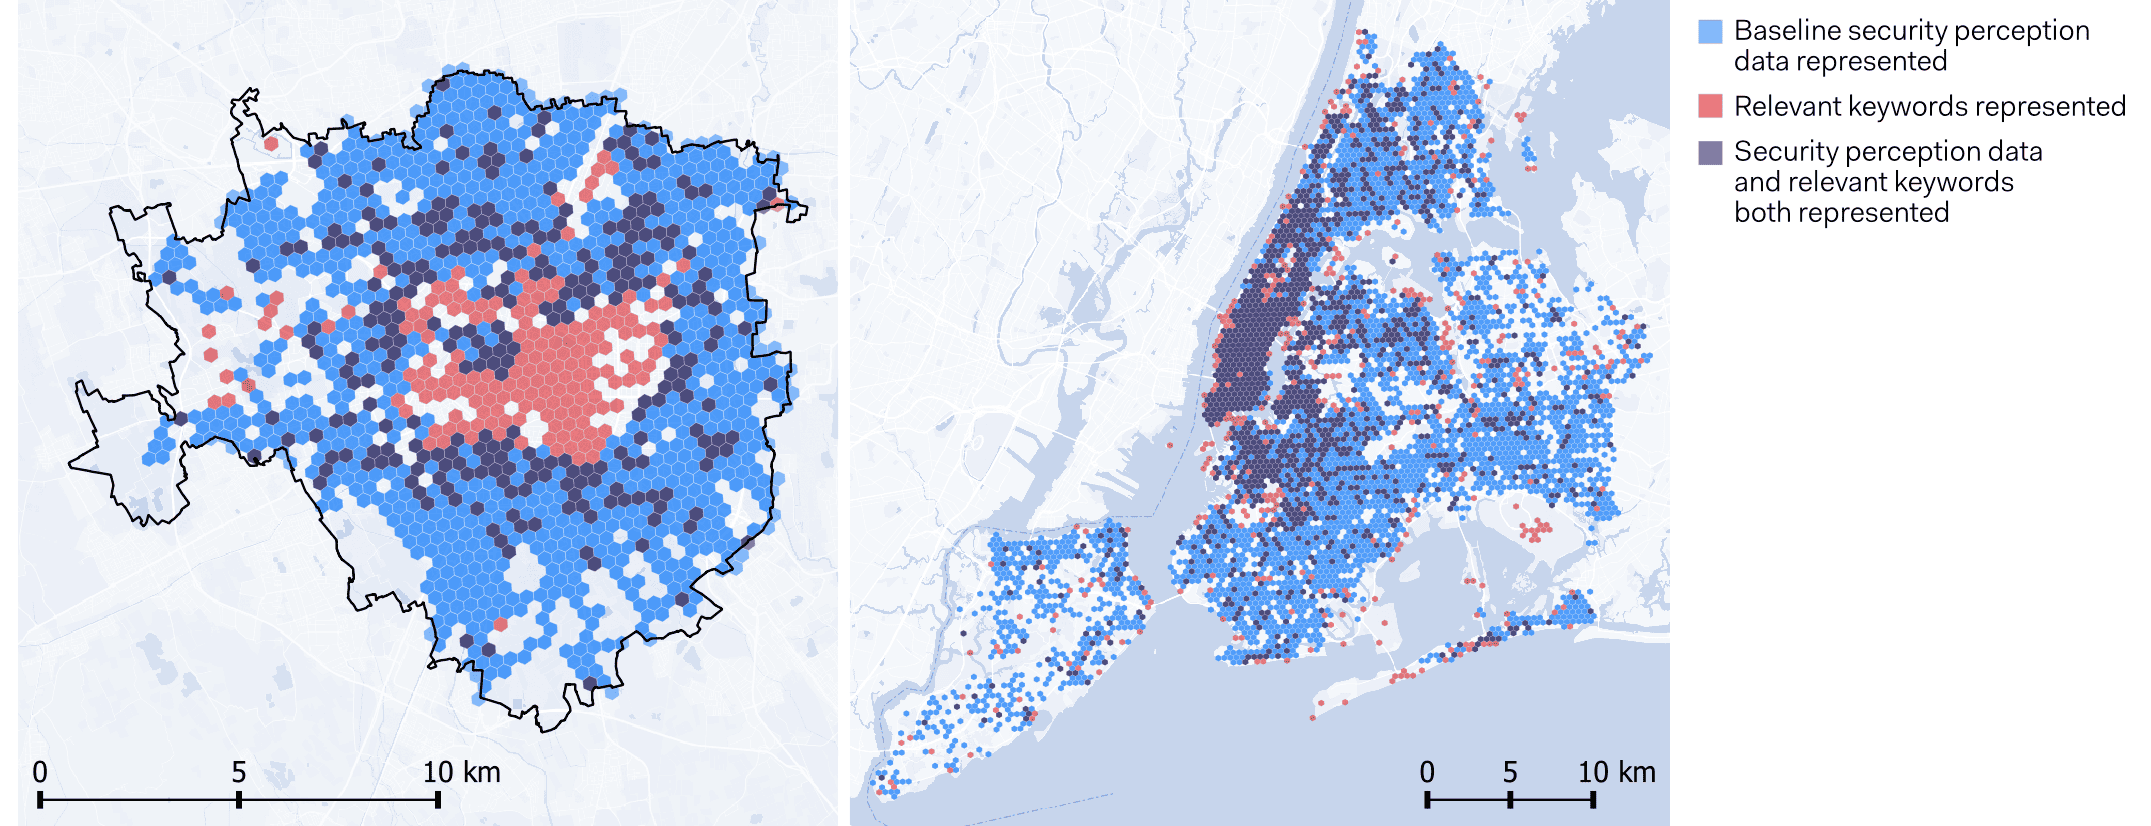
Keyword-based Analysis and Its Limitations
A simpler keyword-matching test yielded similarly weak results. The presence of contextually relevant terms in posts aligned primarily with areas of high posting activity rather than locations associated with lower perceived security or higher crime. Bivariate mapping confirmed that keyword-based indicators overlapped only marginally with baseline security perception data, replicating earlier observations from classifier-based analyses. These findings indicate that keyword approaches, like semantic and sentiment models, are highly dependent on posting density and insufficiently sensitive to the nuances of security perception.
Insights from Google Places Reviews
Analysis of Google Places reviews offered complementary insights but also highlighted important limitations. The SetFit model trained on X data did not generalise well to review-style content due to differences in language structure and context. Only 8% of manually reviewed texts were relevant to women’s perceived security, rising modestly to 17–20% in keyword-based or high-confidence subsets. However, relevance increased significantly for specific place types: transport-related locations showed relevance rates up to 57% in keyword-filtered samples, and parks also showed higher-than-average relevance. These results suggest that place-type-specific modelling could improve detection of security-related perceptions, although API constraints limiting the number of accessible reviews per place restrict the depth of analysis. Overall, Google Places reviews show promise as a supplementary data source but require tailored analytical approaches to reach their full potential.
Discussion and Future Works
The analysis shows that geo-social media data only partially captures localised expressions of perceived insecurity and lacks the consistency and spatial coverage needed for city-scale assessments. While Milan exhibited centralised posting activity and NYC displayed more dispersed clusters, these patterns largely reflect differences in population and platform usage rather than security perceptions. Overall, social media data may signal emerging issues or public discourse but does not reliably align with broader population-level perceptions obtained from surveys, crowdsourced inputs, or crime statistics. Additionally, the differences in rates of penetration of different social media platforms with geolocation data between case studies limits the capacity for scaling the approach for broader regional-level analyses. Main research limitations and potential directions for future development of this line of research are outlined below.
Research Limitations
- The limited precision of geolocation in X data due to bounding boxes, manually selected tags, and structural changes, hampers fine-grained urban analyses.
- The absence of large-scale annotated datasets and the lack of a clear definition of transport security-related content reduce the accuracy and generalisability of semantic classification methods.
- Differences in social media penetration, population size, and sociodemographic patterns between cities influence results, but their impact on security-related behaviour remains underexplored.
- Keyword-based classification fails to capture security-related phenomena, as it mirrors the general distribution of social media content rather than isolating meaningful patterns.
- Google Places reviews are constrained by API limits, small sample sizes, and mismatched models, reducing coverage and representativeness, though transport hubs and parks show promise as reliable sources of relevant content.
From Limitations to Improvements: Priorities for Future Research
- A scalable methodology is needed to capture the multi-dimensional and dynamic nature of perceived urban security for use in transport planning and policy.
- Ensuring the authenticity of geo-social media and place-based data requires robust filtering, though this reduces the volume of usable content.
- Advances in geolocation accuracy are essential, as current methods lack precision and limit the interpretability of results.
- Larger, multilingual, and well-annotated datasets are necessary to improve NLP-based classification and reduce errors in security perception analysis.
- Future models should integrate multiple predictors, combining geo-social media with complementary data sources to provide holistic assessments of perceived security.
- Static benchmark datasets must be complemented with new, dynamic data sources to ensure temporal continuity in capturing security perceptions.
The full research findings are published in a working paper published on Zenodo: Hanny, D., Abdelfattah, L., Messa, F., Ceccarelli, G., Gorrini, A., Resch, B. & Giordano, A. (2025). Exploratory research on measuring urban security perception in transport from social media data to inform transport network models. Transform Transport Working Papers Collection, Zenodo. https://zenodo.org/records/18017361
Acknowledgements
We thank the European Commission – Joint Research Centre (JRC) and IT:U Interdisciplinary Transformation University for their fruitful collaboration. This research was funded by the European Commission – Joint Research Centre under the tender code JRC/SVQ/2025/VLVP/0866.
The analysed data were treated according to the GDPR-General Data Protection Regulation (EU, 2016/679). During the preparation of this work, the authors used Claude AI to produce parts of the NLP scripts, and ChatGPT to initially structure the python code, and enhance clarity, coherence, and readability of the manuscript text. After using these tools/services, the authors manually reviewed and thoroughly edited all generated outputs and take full responsibility for the content of the research and publication.
The content of this presentation and views expressed are purely those of the authors and may not in any circumstances be regarded as stating an official position of the European Commission. Mention of trade or commercial products does not constitute endorsement or recommendation by the authors or the European Commission.
References
Abdelfattah, L., Albashir, A., Ceccarelli, G., Gorrini, A., Messa, F., & Presicce, D. (2025). The Right to the Night City: Exploring the Temporal Variability of the 15-min City in Milan and Its Implications for Nocturnal Communities. Computers, 14(1), 22. https://doi.org/10.3390/computers14010022
Abdelfattah, L., Scarponi, L., Messa, F., Guida, C., Zucaro, F., Carpentieri, G., Andreola, F., Muzzonigro, A., Walker, J., & Gorrini, A. (2024). A Digital Humanities Approach to Study Women’s Perceptions of Safety in the City of Milan: The STEP uP Project. In O. Gervasi, B. Murgante, C. Garau, D. Taniar, A. M. A. C. Rocha, & M. N. Faginas Lago (Eds), Computational Science and Its Applications – ICCSA 2024 Workshops (Vol. 14823, pp. 49–65). Springer Nature Switzerland. https://doi.org/10.1007/978-3-031-65329-2_4
Bao, J., Liu, P., Yu, H., & Xu, C. (2017). Incorporating twitter-based human activity information in spatial analysis of crashes in urban areas. Accident Analysis & Prevention, 106, 358–369. https://doi.org/10.1016/j.aap.2017.06.012
Barbieri, F., Espinosa Anke, L., & Camacho-Collados, J. (2022). XLM-T: Multilingual Language Models in Twitter for Sentiment Analysis and Beyond. In N. Calzolari, F. Béchet, P. Blache, K. Choukri, C. Cieri, T. Declerck, S. Goggi, H. Isahara, B. Maegaard, J. Mariani, H. Mazo, J. Odijk, & S. Piperidis (Eds), Proceedings of the Thirteenth Language Resources and Evaluation Conference (pp. 258–266). European Language Resources Association. https://aclanthology.org/2022.lrec-1.27/
Bianchi, F., Nozza, D., & Hovy, D. (2022). XLM-EMO: Multilingual Emotion Prediction in Social Media Text. Proceedings of the 12th Workshop on Computational Approaches to Subjectivity, Sentiment & Social Media Analysis, 195–203. https://doi.org/10.18653/v1/2022.wassa-1.18
Crooks, A., Pfoser, D., Jenkins, A., Croitoru, A., Stefanidis, A., Smith, D., Karagiorgou, S., Efentakis, A., & Lamprianidis, G. (2015). Crowdsourcing urban form and function. International Journal of Geographical Information Science, 29(5), 720–741. https://doi.org/10.1080/13658816.2014.977905
Dubey, S., Bailey, A., & Lee, J. (Brian). (2025). Women’s perceived safety in public places and public transport: A narrative review of contributing factors and measurement methods. Cities, 156, 105534. https://doi.org/10.1016/j.cities.2024.105534
European Commission (2024). Transport poverty – Definitions, indicators, determinants, and mitigation strategies – Final report. Publications Office of the European Union. https://doi.org/doi/10.2767/0662480
European Commission. (2025a). Commission Recommendation (EU) 2025/1021 of 22 May 2025 on transport poverty: ensuring affordable, accessible and fair mobility. Retrieved from 2025/1021: http://data.europa.eu/eli/reco/2025/1021/oj
European Commission. (2025b). Commission notice: Guidance on the Social Climate Plans. Brussels, C/2025/1597, http://data.europa.eu/eli/C/2025/1597/oj
European Investment Bank. (2024). Promoting gender equality and diversity in urban transport in Barcelona. Publications Office. https://data.europa.eu/doi/10.2867/5386218
Farina, L., Boussauw, K., & Plyushteva, A. (2022). Moving safely at night? Women’s nocturnal mobilities in Recife, Brazil and Brussels, Belgium. Gender, Place & Culture, 29(9), 1229–1250. https://doi.org/10.1080/0966369X.2021.1937064
Gorrini, A., Presicce, D., Choubassi, R., & Sener, I. N. (2021). Assessing the Level of Walkability for Women Using GIS and Location-based Open Data: The Case of New York City. Findings. https://doi.org/10.32866/001c.30794
Honzák, K., Schmidt, S., Resch, B., & Ruthensteiner, P. (2024). Contextual Enrichment of Crowds from Mobile Phone Data through Multimodal Geo-Social Media Analysis. ISPRS International Journal of Geo-Information, 13(10), 350. https://doi.org/10.3390/ijgi13100350
Levy, C. (2013). Travel choice reframed: “Deep distribution” and gender in urban transport. Environment and Urbanization, 25(1), 47–63. https://doi.org/10.1177/0956247813477810
Lin, Y., & Geertman, S. (2019). Can Social Media Play a Role in Urban Planning? A Literature Review. In S. Geertman, Q. Zhan, A. Allan, & C. Pettit (Eds), Computational Urban Planning and Management for Smart Cities (pp. 69–84). Springer International Publishing. https://doi.org/10.1007/978-3-030-19424-6_5
Loureiro, D., Barbieri, F., Neves, L., Espinosa Anke, L., & Camacho-collados, J. (2022). TimeLMs: Diachronic Language Models from Twitter. Proceedings of the 60th Annual Meeting of the Association for Computational Linguistics: System Demonstrations, 251–260. https://doi.org/10.18653/v1/2022.acl-demo.25
Messa, F., Ceccarelli, G., Gorrini, A., Presicce, D., & Deponte, D. (2021). Analysing ‘Twitter Conversation’ of London Tube Stations: The Case of the Covid-19 Pandemic. https://doi.org/10.5281/ZENODO.6493631
Messa, F., Scarponi, L., Abdelfattah, L., Carpentieri, G., Martinelli, V., Stiuso, T., & Gorrini, A. (2025). Modeling women’s perceived level of safety at night in Milan. Journal of Transport Geography, 127, 104243. https://doi.org/10.1016/j.jtrangeo.2025.104243
Pain, R. (2001). Gender, Race, Age and Fear in the City. Urban Studies, 38(5–6), 899–913. https://doi.org/10.1080/00420980120046590
Reimers, N., & Gurevych, I. (2019). Sentence-BERT: Sentence Embeddings using Siamese BERT-Networks. Proceedings of the 2019 Conference on Empirical Methods in Natural Language Processing and the 9th International Joint Conference on Natural Language Processing (EMNLP-IJCNLP), 3980–3990. https://doi.org/10.18653/v1/D19-1410
Tunstall, L., Reimers, N., Jo, U. E. S., Bates, L., Korat, D., Wasserblat, M., & Pereg, O. (2022). Efficient Few-Shot Learning Without Prompts (Version 1). arXiv. https://doi.org/10.48550/ARXIV.2209.11055
Uber, 2018. H3: Uber’s Hexagonal Hierarchical Spatial Index. Accessed April 19, 2023. Retrieved from: https://github.com/uber/h3
Wang, L., Yang, N., Huang, X., Yang, L., Majumder, R., & Wei, F. (2024). Multilingual E5 Text Embeddings: A Technical Report (Version 1). arXiv. https://doi.org/10.48550/ARXIV.2402.05672
Watanabe, S. (2023). Tree-Structured Parzen Estimator: Understanding Its Algorithm Components and Their Roles for Better Empirical Performance (Version 4). arXiv. https://doi.org/10.48550/ARXIV.2304.11127