
Covid-19 pandemic has deeply affected urban mobility: the social-distancing strategies adopted to cope with the virus transmission pushed the majority of city users into avoiding public transport services in favour of safe and contactless travel options. To investigate this phenomenon, this research proposes an Urban Informatics approach to understand passengers’ opinions and expressed polarity through user-generated social-media data (Twitter) in the Greater London Area. The analysed corpus consists of 27,700 tweets posted between January 13th, 2020 and May 17th, 2021, and geolocated in immediate proximity of a short sample of selected Tube stations. Data is segmented in several phases, based on the restriction measures enforced by the UK National Authorities. Each subset is then analysed through texts structuring and semantic analyses, with LDA topic modelling and Sentiment Analysis. Finally, the outcomes of these processes are interpreted in their chronological succession and compared to demand data and service-disruption data.
User-generated Social-media Data as a Tool for Understanding the City
Data is at the foundation of modern planning practice and among other tools that enable collection of mobility patterns and flows. In particular, user-generated social-media data has the potential to represent both national-scale (Jurdak et al., 2015) and urban-scale mobility patterns (Plunz et al., 2019).
This opportunity has become even more crucial considering the need to investigate the unprecedented effects of disruption of the Covid-19 pandemic on urban mobility. In particular, the nation-wide lockdown and post-lockdown phases have drastically changed citizens behaviours and mobility patterns related to the use of public transport services (Buhrmann et al., 2020), due to the need to avoid crowded transport infrastructures in favour of safe and contactless travel options (e.g., private vehicles, cycling, walking, etc.).
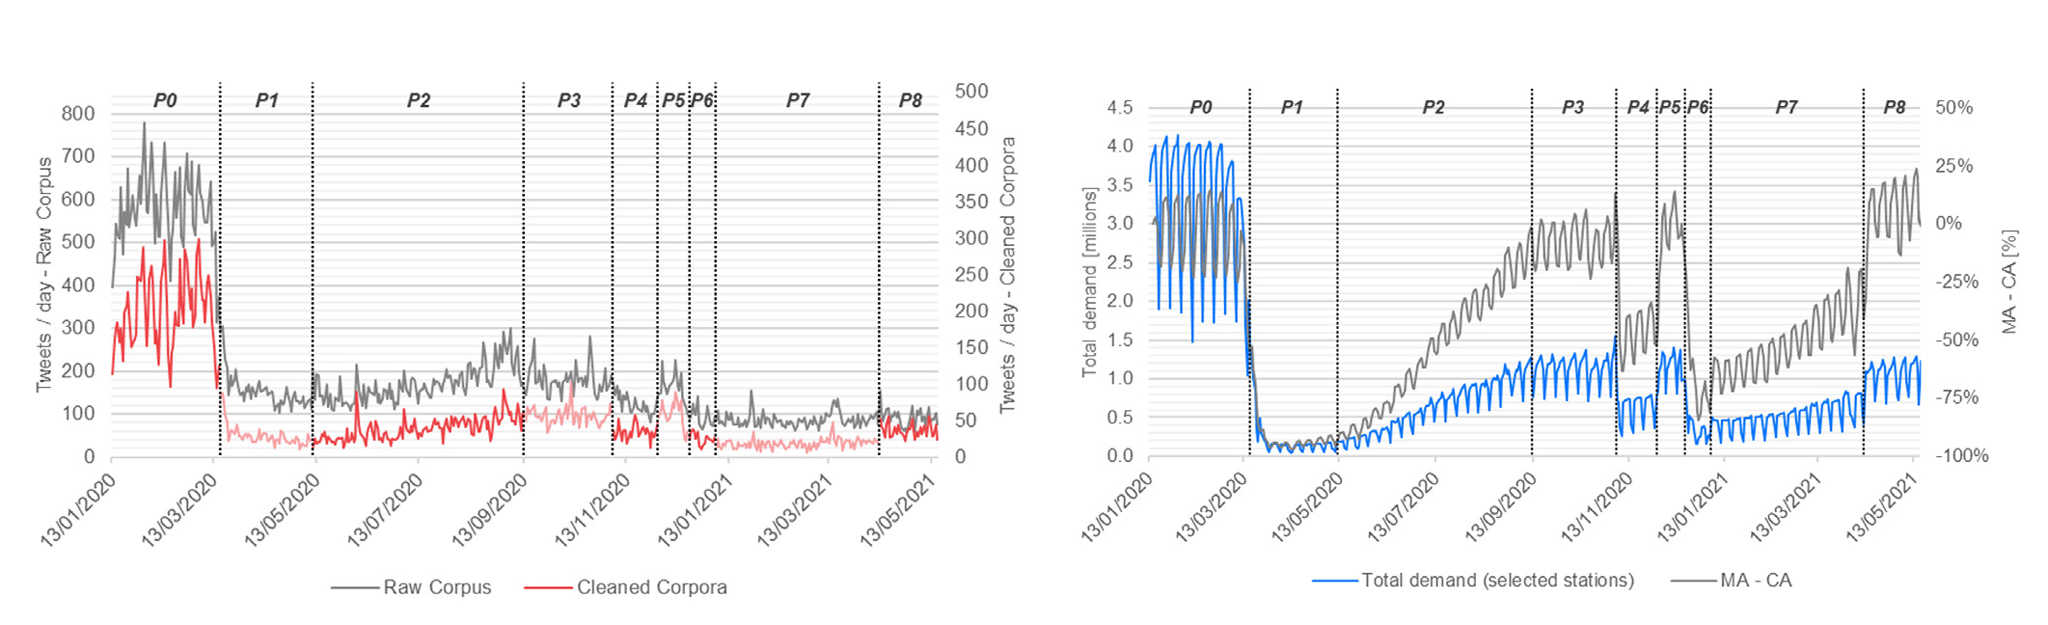
In this context, the article presents an extended analysis of a Twitter-data corpus, collected by geographical location and specific timeframes, and further filtered by removing non-relevant tweets and non-human posting. The acquired corpus consists of 27,700 tweets geolocated in immediate proximity of selected Tube stations of the Greater London Area (UK) and posted between January 13th, 2020 and May 17th, 2021. The social-media data is segmented in 9 phases, shown in Figure 1, to compare the outcomes of the analyses in timeframes that have a mobility-demand significance, but also a social connotation.
The goal of these analyses is to offer a comprehensive view of the relation between public transport and user-generated data. Hence, the process is twofold: firstly, the analysis is focused on understanding the impact of the pandemic on the public transport mobility patterns through daily demand data and daily service-disruption data. Secondly, the social-media data is investigated with two different methodologies based on texts structuring and semantic analyses, specifically: (i) identification of tweets’ subjects through LDA Topic Modelling, and (ii) assessment of the conversation emotional polarity through Sentiment Analysis.
Social Media Data Gathering
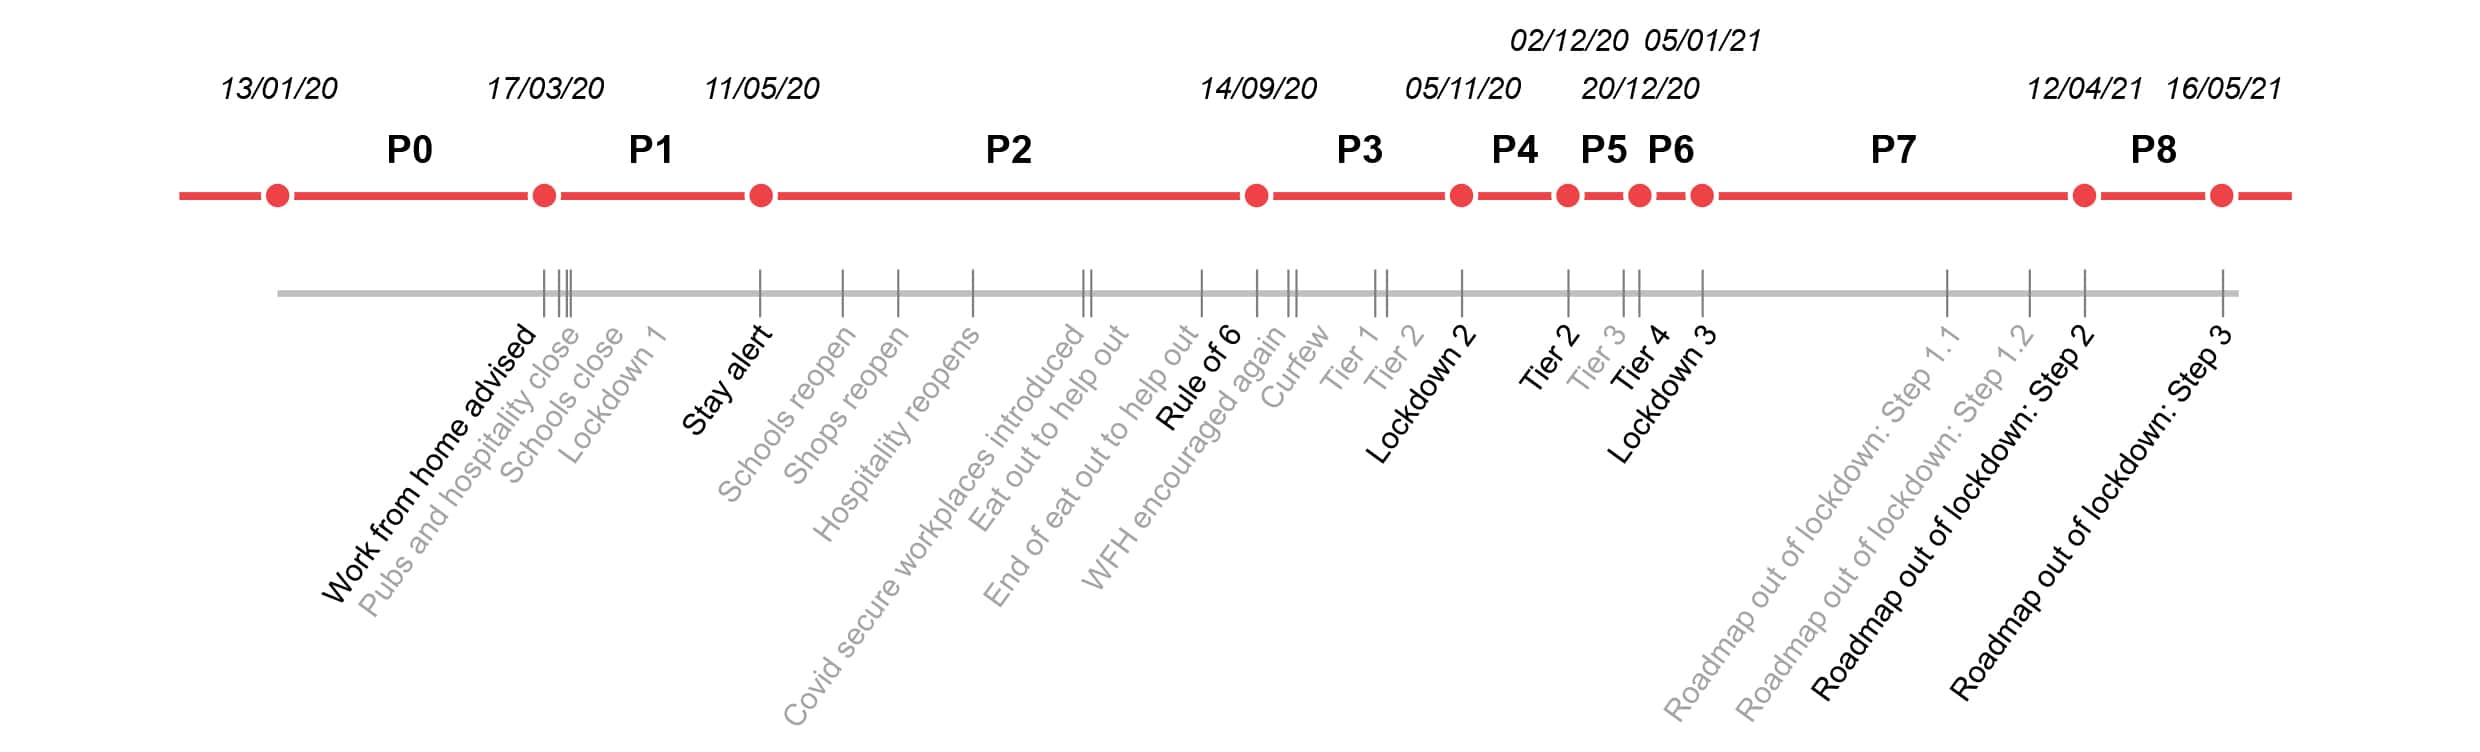
In accordance with the research scope, the phasing structure is derived from the evolution of the pandemic; the phases were selected by considering the national and local policies imposing restrictions affecting Greater London. The calendar, comprising of 25 policy milestones, was reduced to 9 phases in order to avoid an excessive segmentation of the outputs, considering only the major self-distancing measure changes. In addition to the pandemic period, a Baseline Phase was added for the purpose of providing a reference scenario for the assessed indicators (see Figure 2). This practice is common in a before-after analysis and the timeframe chosen was in line with the Coronavirus publications produced by Transport for London (TfL).
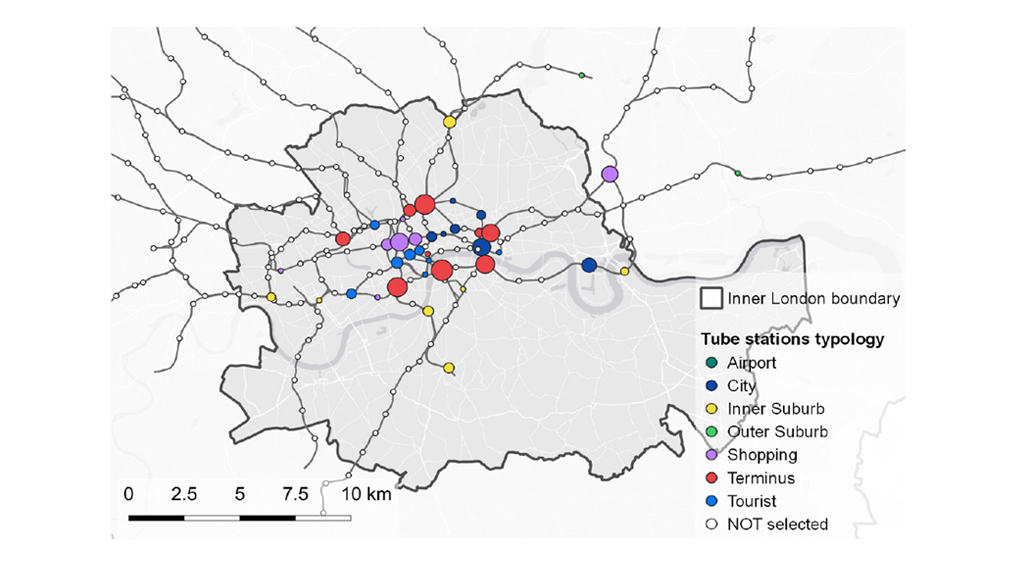
Similarly, a selection of Tube stations (see Figure 3) was performed in order to identify the locations to look for geo-located tweets. This process was achieved by using demand data from 2019 published by TfL, which represents the daily entry/exit for the typical weekday of a pre-pandemic year. The stations were selected by considering the 85th percentile of the demand, resulting in 40 stations located in the Greater London Area.
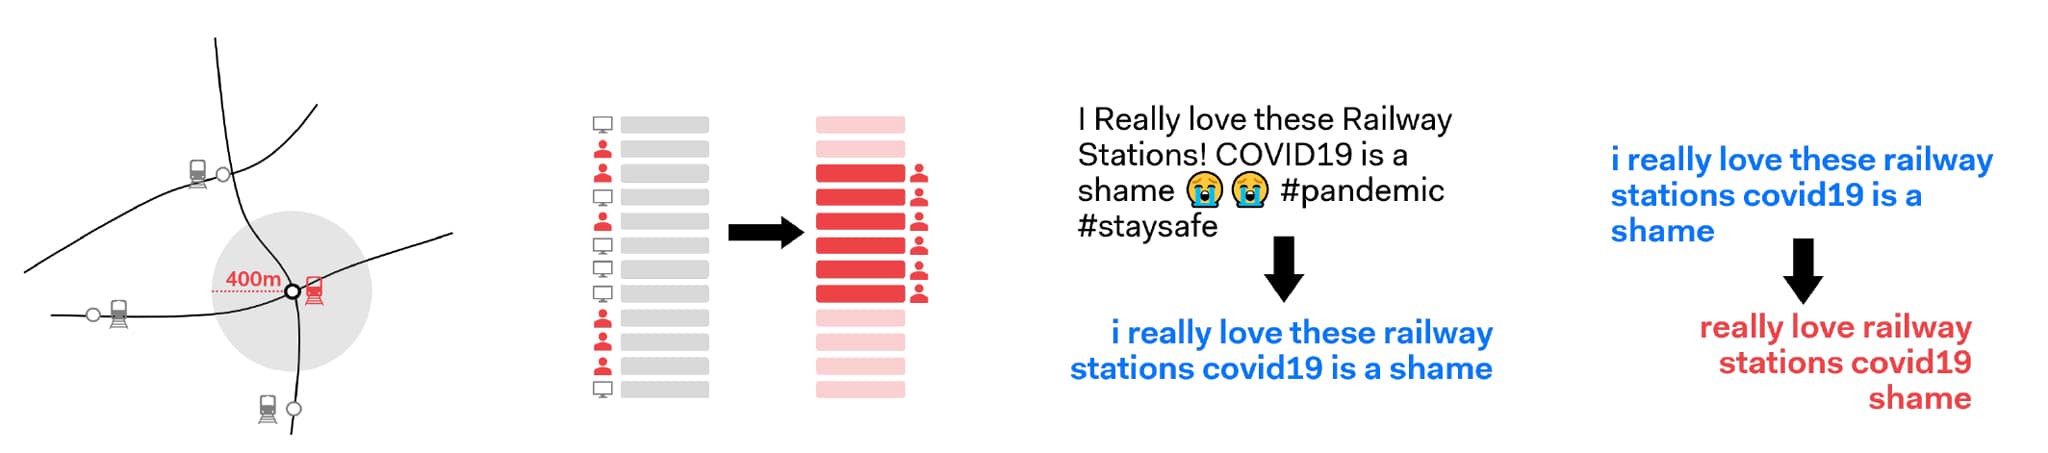
The selected stations’ locations are used as centroids to calculate buffers of 400 meters of radius. The measure of the proposed catchment area around stations was chosen since it can be considered as a 5-minute walking distance in the analysis setting. Moreover, the small catchment area represents a location bias able to represent the content posted in proximity of public transport infrastructure.
The raw outcome of this process is a dataset comprising of 95,463 tweets, which was then post-processed in several steps in order to harmonize tweets’ text to be input in further semantic analyses, removing noise and superfluous information, by:
- Detecting repetitive and non-human posts in the overall corpus, the presence of which could lead to biased and inaccurate topic modelling;
- Text content pre-processing with characters-based simplifications removing punctuation signs, emojis, URLs and converting all the text to lowercase format;
- Natural Language Processing (NLP) methodologies, such as stop words removal and lemmatizations (Bird et al., 2009).
All these processes contribute to the harmonization of text and the removal of words with no semantic meaning, enhancing the performance of the topic modelling, specifically: (i) stop words removal was based on the NLTK English stop-words list (e.g. a, an, the, etc.) (Bird et al., 2009), which was extended with custom words (e.g., London, etc.) that appeared ubiquitously in the corpus; (ii) lemmatization consists of a reduction of each word to its root and allows a further selection of allowed tokens, in this case leading to the selection of nouns, verbs, adjectives and adverbs in each tweet. The data cleaning process was differentiated for topic modelling and sentiment analysis and it’s shown in Figure 4.
Text Semantic Analysis
The two analyses performed to comprehend the content of the corpora were (see Figure 5):
- Topic modelling: to gain knowledge on the main tweets’ subjects
- Sentiment analysis: to investigate the expressed message polarity.
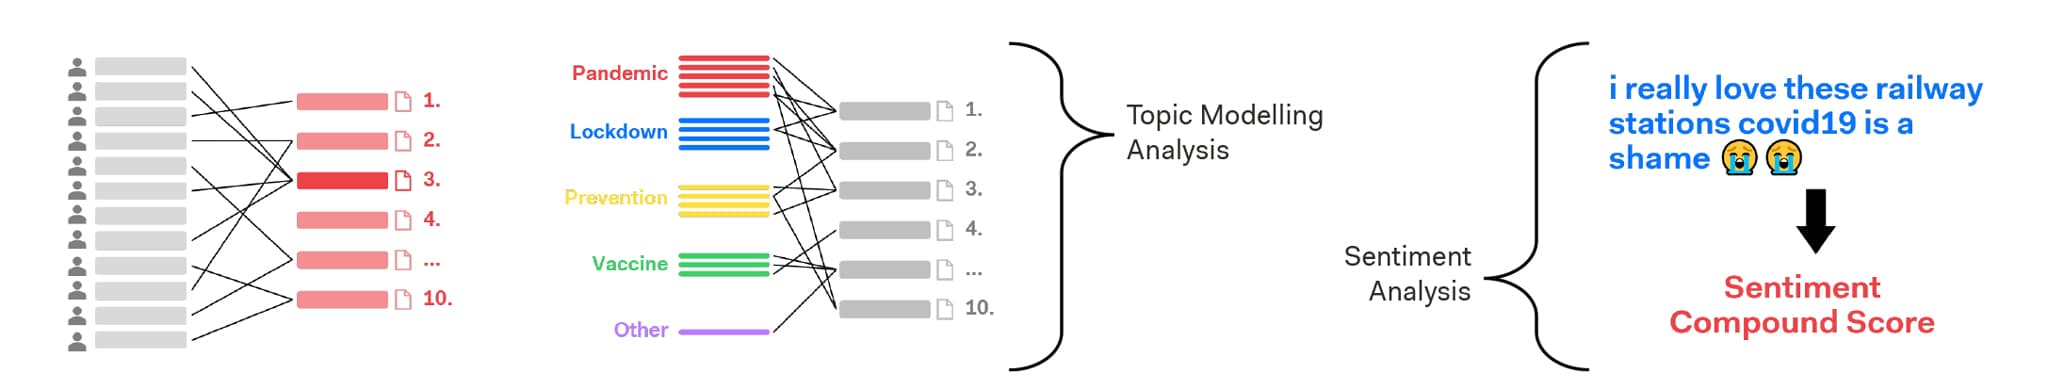
Topic Models are statistical language models used to understand the theme structure of a document. In particular, the used model was Latent Dirichlet Allocation (LDA), which is a probabilistic generative model that takes as input a collection of lemmatized texts and outputs topics’ probability distribution over each document (Kapadia, 2019). For each phase of the analysis timeframe, topic modelling was used to identify 10 topics per period.
The model parameters were hypertuned to obtain best fitting topics, looping over LDA’s main parameters. Subsequently, the significance of the results was quantified using the topics’ coherence metric, which measures the degree of semantic similarity between high-scoring words in the topic, helping to distinguish artifacts from semantically valid outcomes. In order to measure the influence of pandemic-related posts in the analysed corpora, a reference control set built around Covid-19 related words was defined and compared against the previously obtained topics.
By using the reference set as an unseen document to query the models, the output was the probabilistic distribution of the queried control words among the phases’ topics set. Furthermore, Sentiment Analysis was performed using Vader (Valence Aware Dictionary and sEntiment Reasoner) (Hutto et al., 2014), a lexicon and rule-based analysis tool developed to estimate the polarity of social media texts. The tool outputs three values divided into positive, neutral and negative scorings and a compound value to summarize the sentiment’s results.
Topic Modelling Analysis
Since the topic modelling analysis was performed on diverse corpora and the LDA model is generative, the reference was devised to infer the relation between Covid-19 related terms during the phases.
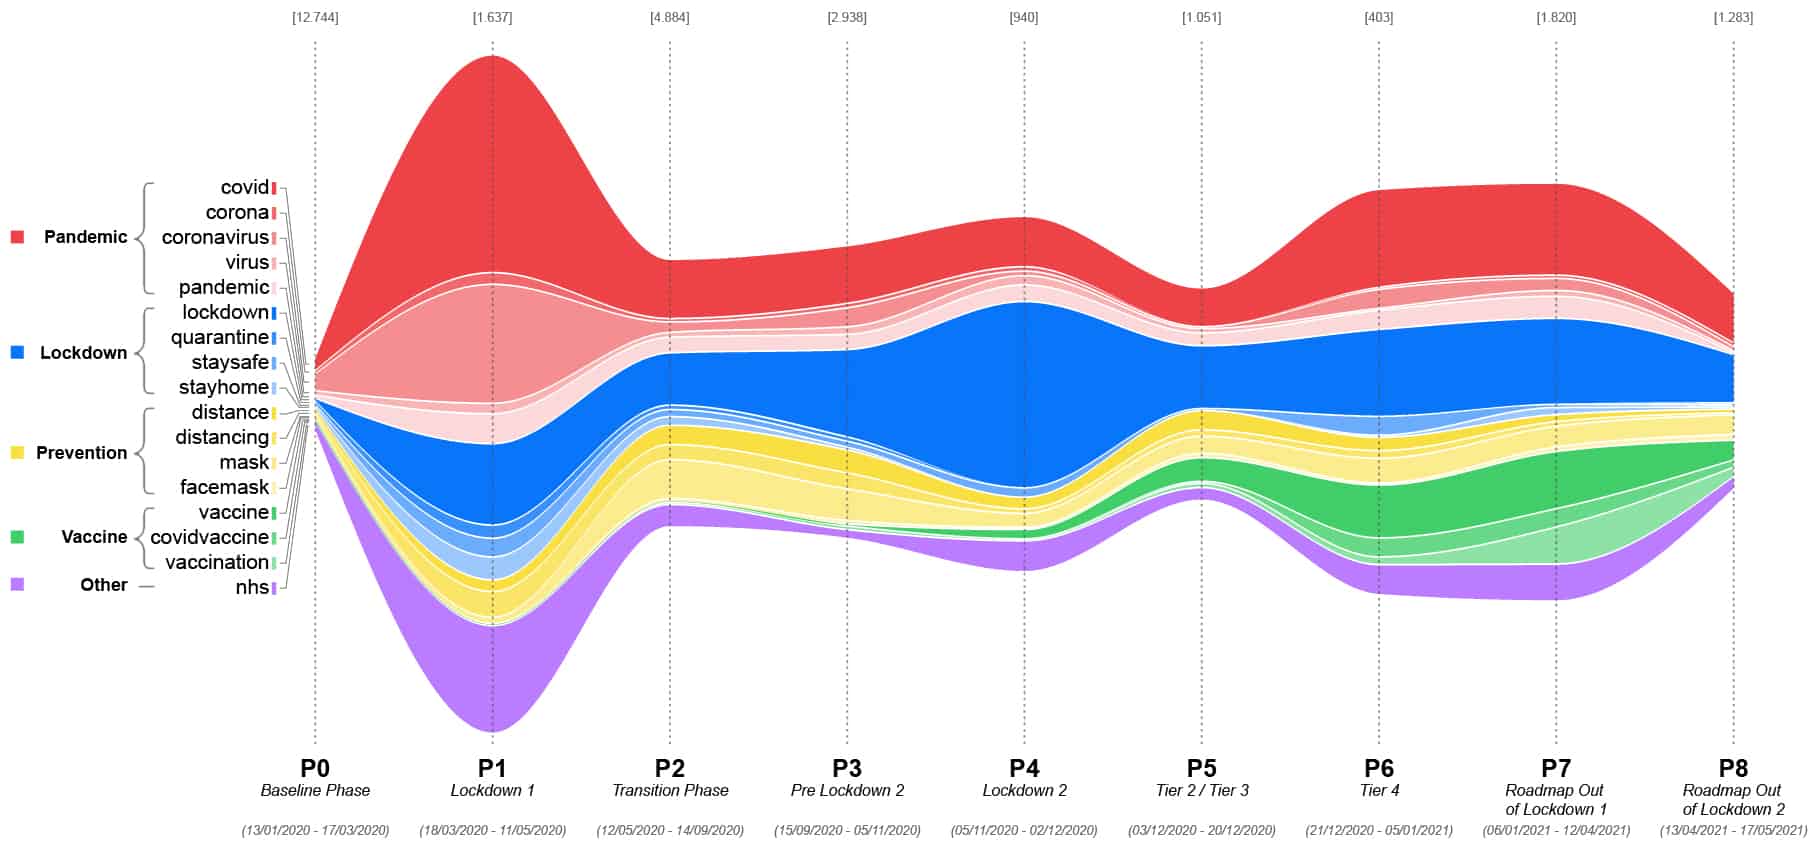
The set consists of 17 terms that also include variation of the same lemma, divided thematically into five categories:
- Pandemic: covid, corona, coronavirus, virus, pandemic;
- Lockdown: lockdown, quarantine, staysafe, stayhome;
- Prevention: distance, distancing, mask, facemask;
- Vaccine: vaccine, covidvaccine, vaccination;
- Other: nhs.
This set was built considering the overall corpus content by manually evaluating a random subset of tweets, Figure 1 shows the distribution of these words.
The relation between the reference set and the phases’ corpora is expressed by measuring how many terms of the set fall into the dominant topic (i.e., the topic with highest semantic similarity with the queried text) and by the overall topic weight (i.e., the probability distribution of the topics with respect to the queried text).
Demand Data and Tweets
In addition to the demand used to select the stations, which was referred to the pre-pandemic year (2019), the daily demand of the selected timeframe was analysed in order to understand the actual impact of Covid-19 on the Tube’s mobility. The variation between the phases is substantial to the extent that during the last phase (P8) the average daily demand is -67% compared to the Baseline Phase (see Figure 6).
Service Disruption Analysis
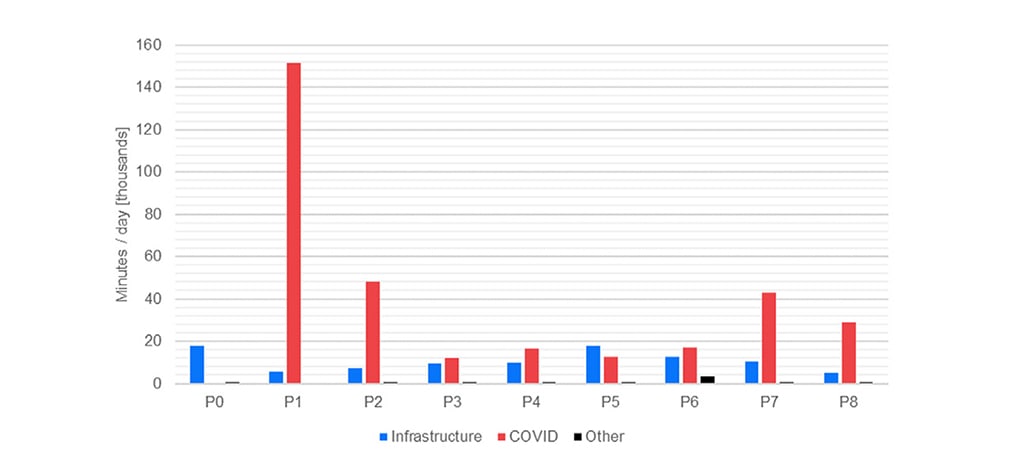
In order to structure a comprehensive view of the public transport usage during the pandemic evolution, the service disruption was taken into consideration. In this regard, the disruptions caused by diverse sources were categorized and aggregated per phase. The service interruptions and delays were considered for all the Tube lines since the selected stations are distributed among all the subway lines and a service quality index was calculated in term of minutes of delay per day, as shown in Figure 7.
Sentiment Anylysis
While the Topic Modelling Analysis is performed separately on each corpus, the Sentiment Analysis is used to interpret each single tweet, then the results are aggregated and interpreted per phase. VADER tool expresses the polarity of each item by three values, defined as positive, neutral and negative and a normalized weighted Compound Score to summarize the overall results (Hutto et al., 2014). For the scope of this research the value considered is the Compound Score, which expresses a single comparable score among the entries.
Findings
While the demand and service data describe a currently well-known phenomenon, the text semantic analysis allows the gathering of more insights on the perception of the pandemic. The distribution of covid-related terms in the different phases allow to understand the evolution of the conversation: during the Lockdown 1 phase, the conversation was more focused on the actual situation, with the largest part of the conversation focused on the “Pandemic” theme. This was followed by an interest more related to the “Lockdown” theme and the restriction measures, during Lockdown 2 phase. Finally, the discussion converged towards the “Vaccine” theme during the last analysed phases.
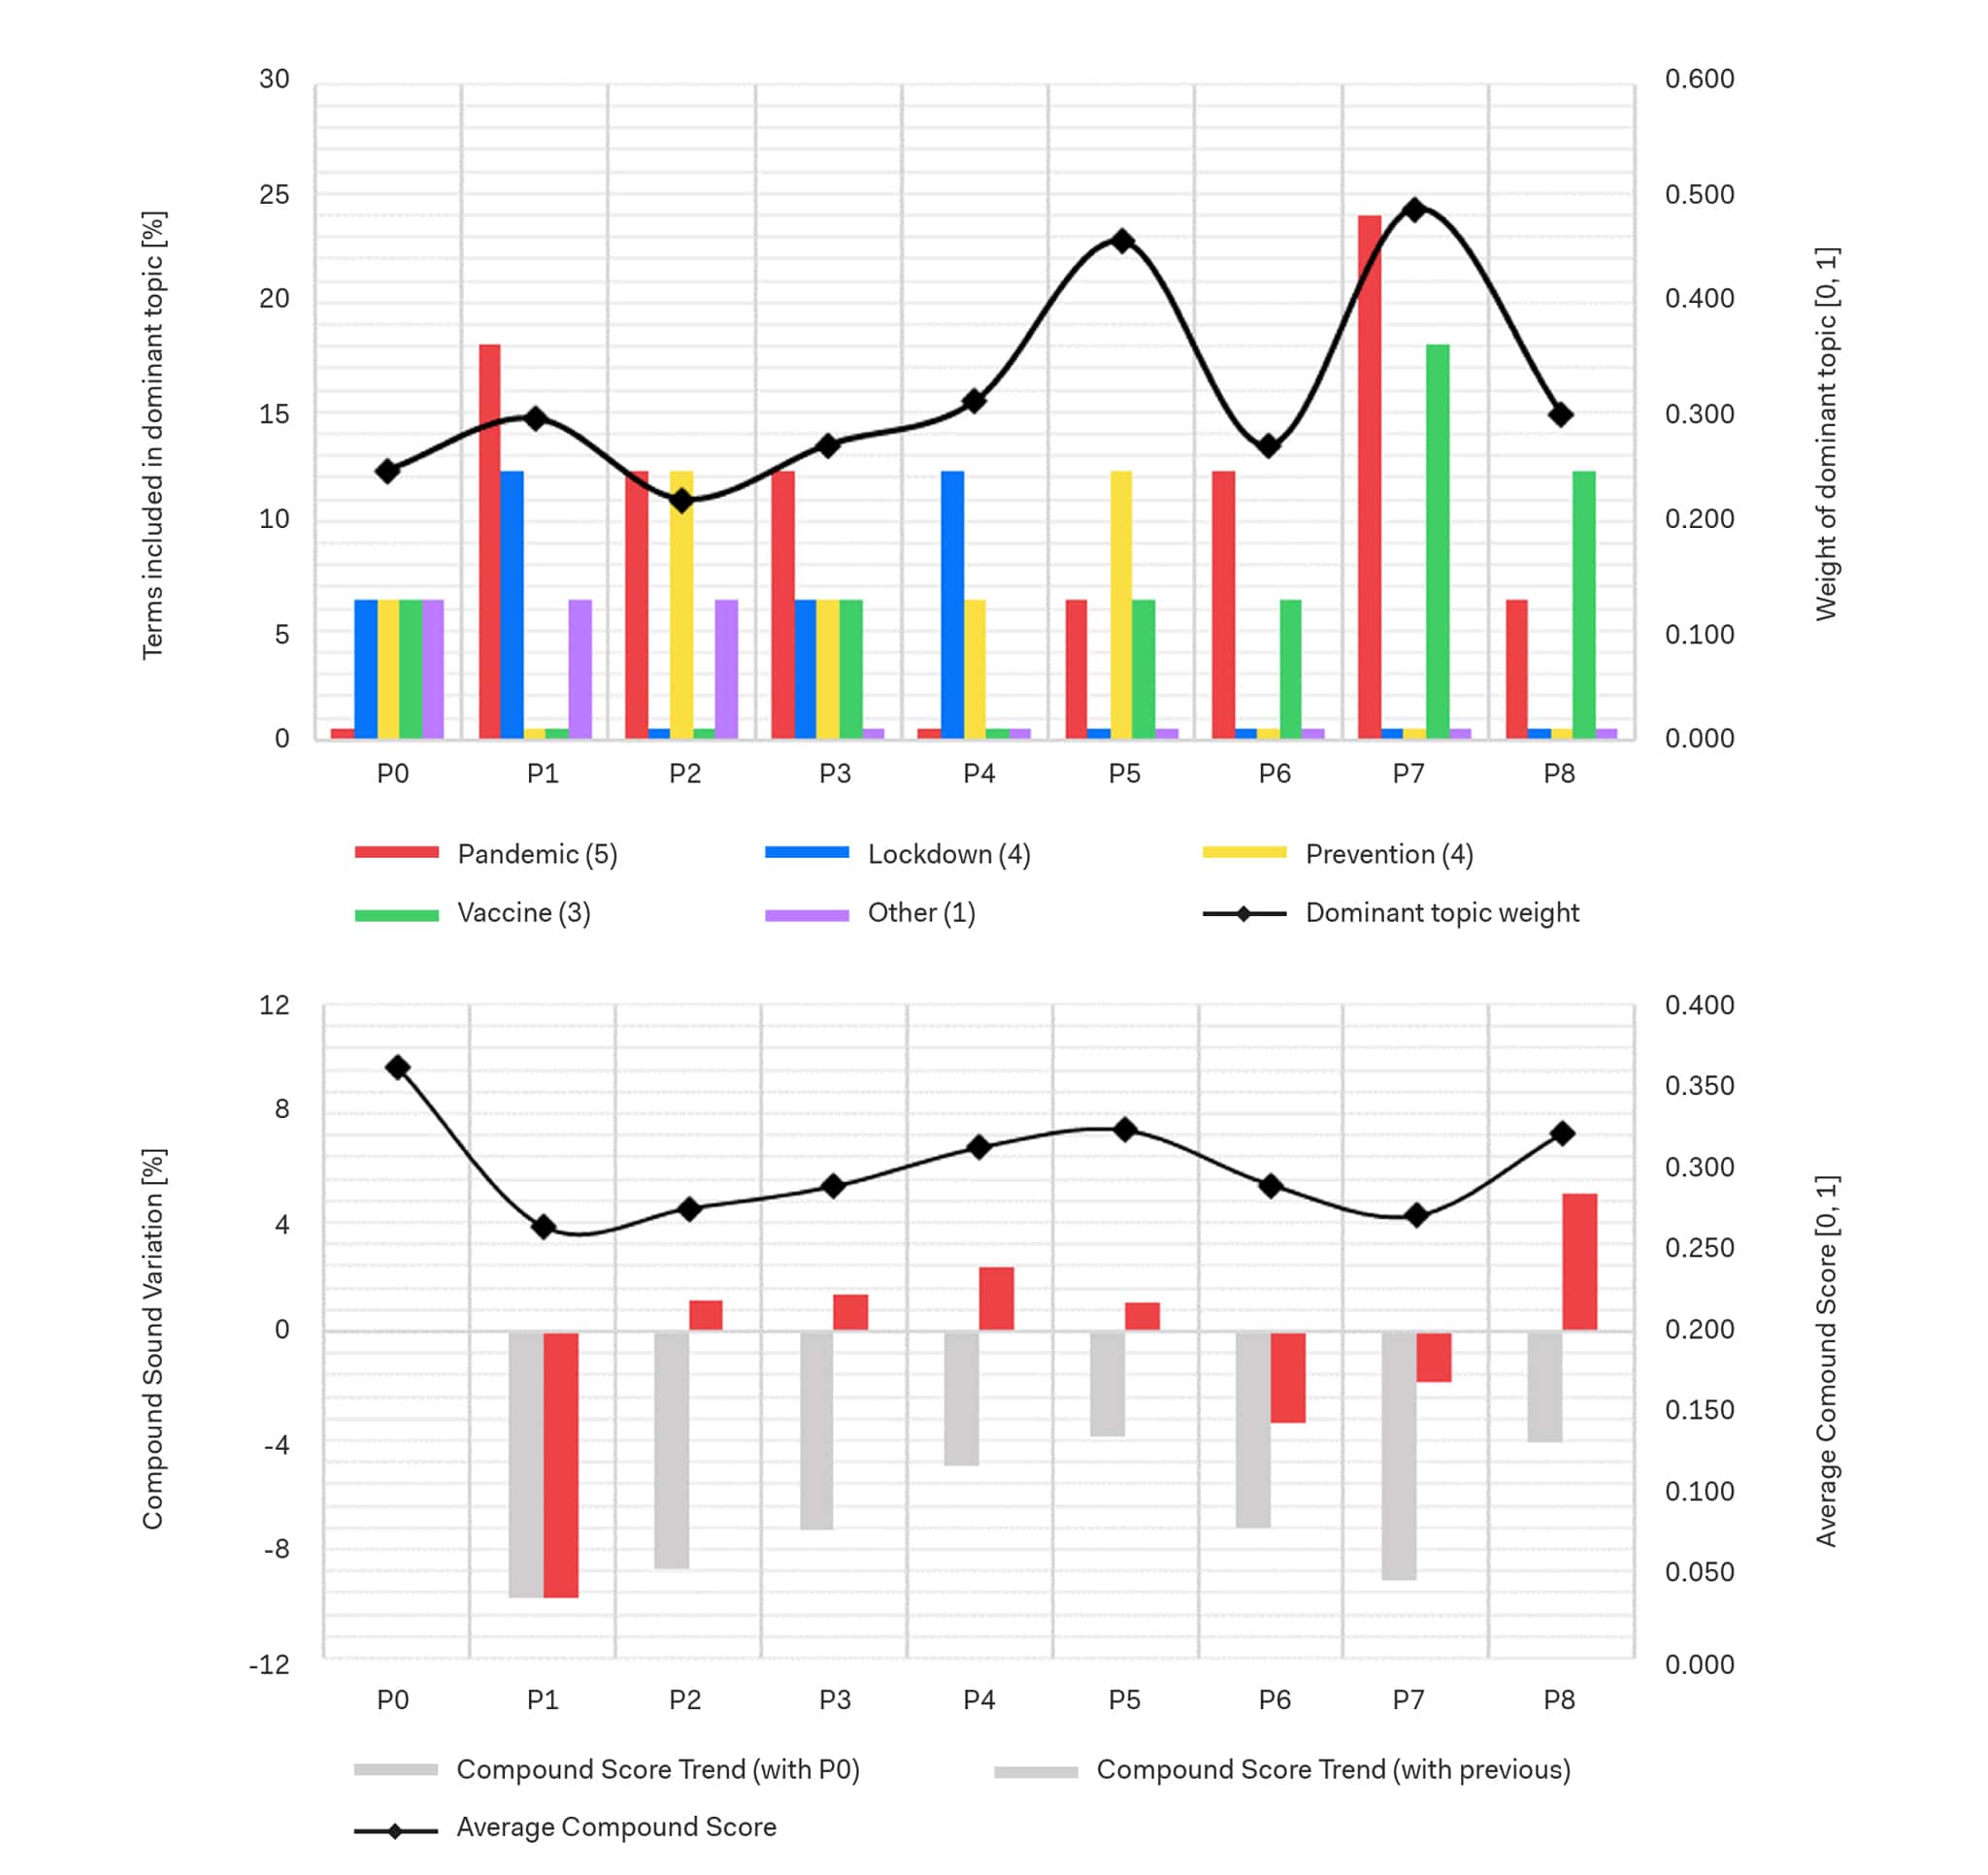
By comparing these considerations to the topic modelling outputs, it is possible to confirm some of these insights. During the Lockdown 1 phase (P1), the dominant topic relates to “Pandemic” and “Lockdown” themes and it shifts toward “Lockdown” in P4 and to “Vaccine” during the last phases. However, the Dominant topic weight metric shows how relevant the topic is in relation to the generated model. A more or less relevant topic can be influenced by several factors, such as an effective topic modelling process or the semantic significance of the analysed corpus. However, for the scope of this research, it can be considered as a reference-set independent weight metric describing the relevance of the outputs.
Finally, the sentiment analysis can be interpreted using the threshold proposed by the tool creators (Hutto et al., 2014): typical compound limits are positive (score ≥ 0.05), neutral ( – 0.05 > score > 0.05) and negative (score ≥ – 0.05). Considering these values, all the phases are characterized by a positive average compound score. However, social-media data is usually influenced by a positivity bias (Waterloo et al., 2018) because negative emotions are often considered as not appropriate to publicly share on social media. For this reason, the trend metrics are proposed, and it is possible to appreciate how the general sentiment per phase is always lower than the Baseline Phase and especially how the variation closely follows the demand data, hence the restrictions implementation calendar.
Even if in a qualitative fashion, these sets of data manage to add information that is otherwise difficult to obtain without the utilization of surveys or time-consuming and cost-impactive methods. For this reason, the analysis of social media data is steadily increasing its applications, ranging from sociological and medical studies to mobility-related analyses. Crowd-sourced data could be one of the potential data feeds needed to develop a comprehensive model of an urbanized area (digital twin) able to describe and simulate phenomena happening in the urban environment, because in addition to location-based information, they allow to identify social and cultural patterns.
The results of this research work has been presented at the 49th European Transport Conference 2021 (ETC 2021, 13-15 September 2021 – Online), organized by AET, and published on ZENODO: Messa, F., Ceccarelli, G., Gorrini, A., Presicce, D., Deponte, D. (2021). Analysing ‘Twitter Conversation’ of London Tube Stations: The Case of the COVID19 Pandemic. In: Proceedings of the 49th European Transport Conference 2021 (ETC 2021), 13-15 September 2021 – Online. https://doi.org/10.5281/zenodo.6493631
References
Bird, S., Klein, E., & Loper, E. (2009). Natural language processing with Python: analyzing text with the natural language toolkit. O’Reilly Media, Inc.
Buhrmann, S., Wefering, F., Rupprecht, S. (2019). Guidelines for Developing and implementing a sustainable urban mobility plan – 2nd edition. Rupprecht Consult-Forschung und Beratung GmbH. Available at: https://www.eltis.org/mobility-plans/sump-guidelines
Hutto, C., & Gilbert, E. (2014). Vader: A parsimonious rule-based model for sentiment analysis of social media text. In: Proceedings of the International AAAI Conference on Web and Social Media 8 (1). Available at: https://ojs.aaai.org/index.php/ICWSM/article/view/14550
Jurdak, R., Zhao, K., Liu, J., AbouJaoude, M., Cameron, M., & Newth, D. (2015). Understanding human mobility from Twitter. PloS one, 10 (7), e0131469. https://doi.org/10.1371/journal.pone.0131469
Kapadia, S. (2019). Topic Modeling in Python: Latent Dirichlet Allocation (LDA). Available at: https://towardsdatascience.com/end-to-end-topic-modeling-in-pythonlatent-dirichlet-al location-lda-35ce4ed6b3e0.
Plunz, R. A., Zhou, Y., Vintimilla, M. I. C., Mckeown, K., Yu, T., Uguccioni, L., & Sutto, M. P. (2019). Twitter sentiment in New York City parks as measure of well-being. Landscape and urban planning, 189, 235-246. https://doi.org/10.1016/j.landurbplan.2019.04.024
Waterloo, S. F., Baumgartner, S. E., Peter, J., & Valkenburg, P. M. (2018). Norms of online expressions of emotion: Comparing Facebook, Twitter, Instagram, and WhatsApp. new media & society, 20 (5), 1813-1831. https://doi.org/10.1177/1461444817707349