
The relevance of computer-based pedestrian crowd simulations has become crucial in transport planning considering the unprecedented effects of the Covid-19 pandemic on urban mobility. However, there is still a lack of knowledge regarding the impact of social distancing on crowding, queuing, route choice, and other pedestrian crowd phenomena. In this context, the current study was aimed at applying the Social Force Model of the pedestrian simulation platform PTV Viswalk to investigate the effects of disruption of social distancing on pedestrian dynamics. First, a descriptive set of metrics and parameters was applied for calibrating the dynamic regulation of interpersonal distances among pedestrians. Then, the plausibility of the proposed Social Distancing Model has been evaluated against the so-called fundamental diagram to calibrate pedestrian Volume-Delay Functions. Finally, the proposed model has been integrated into the PTV Visum simulation platform to evaluate the effect of social distancing on large-scale pedestrian route choice. To do so, a macroscopic static model of the City of Venice was developed to test the effectiveness of alternative crowd management strategies related to pedestrian dynamics, in a predictive scheme.
Introduction
Pedestrian movements are one of the most complicated items when approaching transport planning, since they are strongly based on people behavior and personal perceptions of environment, social distancing and reasons at the basis of the trip. The use of computer-based systems for the simulation of pedestrian dynamics (e.g., Legion, MassMotion, PTV Viswalk, etc.) is a consolidated and successful domain, thanks to its scientific relevance and its capability to provide practical solutions for supporting transport planners in managing crowded facilities (Gorrini et al., 2018).
The relevance of computer-based simulations in transport planning has become even more crucial considering the unprecedented effects of the Covid-19 pandemic on pedestrian dynamics, and urban mobility more in general. The activities of transport planners and decision makers have been projected ahead towards promoting pedestrian mobility and walkability in order to reduce risk of contagion associated with high contact and crowding conditions.
This research approaches the problem of pedestrian flow assignment under social distancing in a multi-level scale. First, a microscopic pedestrian model was developed to evaluate flow conditions at different demand levels. The microscopic model evaluated both BAU (Business-As-Usual) and SD (Social Distancing) pedestrian flow conditions by means of the Social Force Model (SFM) (Helbing and Molnar, 1995). By measuring flow, density and speed under different demand levels, the fundamental diagrams for both scenarios were built (BAU and SD). Then, Pedestrian Volume-Delay Functions (pVDFs) were calibrated by estimating the parameters that better fit the fundamental diagrams. Such functions were implemented in a large-scale macroscopic static pedestrian assignment model to evaluate the effect of social distancing on route choice.
Microscopic Model
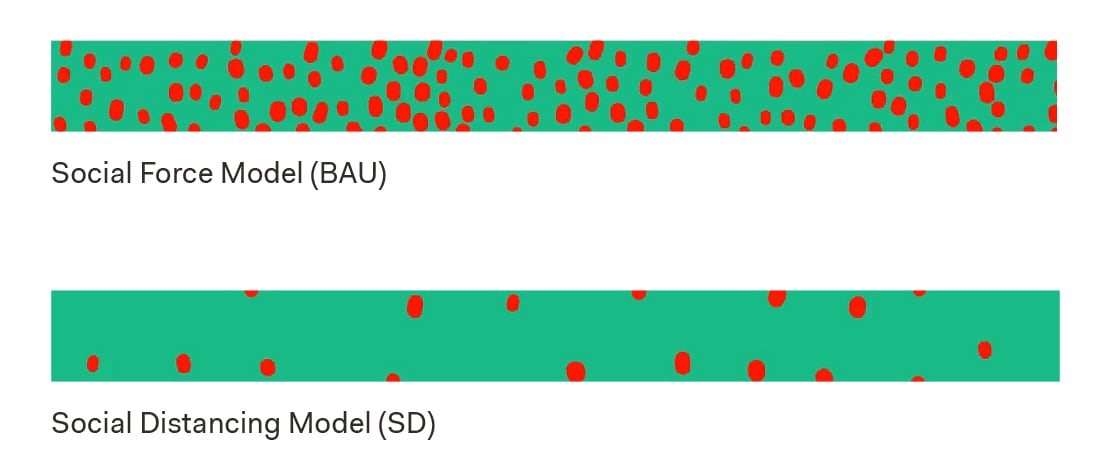
In a preliminary work previously presented by the authors (Deponte et al., 2020), a modification to the parameters of the default social force model implemented in the pedestrian simulation platform PTV Viswalk was proposed in order to simulate social-distancing conditions. The study focused on calibrating the dynamic regulation of interpersonal distances among pedestrians (i.e., social isotropic parameters related to repulsive force), to avoid conditions of inappropriate proximity and spatial restriction due to high density situations. The calibration process consisted of the iterative variation of the Social Force Model parameters until reaching a flow condition in which pedestrians would respect the majority of the time a predefined maximum density threshold (1 ped/sqm), with a regular behavior and avoiding back and forth oscillations of pedestrians when approaching others (Kretz, 2015). This predefined maximum density is a proxy for a minimum interpersonal distance of 1 m, considering squared cells. Figure 1 shows a comparison of the time duration in which the density threshold is exceeded for a given input flow for the standard Social Force Model (BAU) and the Social-Distancing Model (SDM).
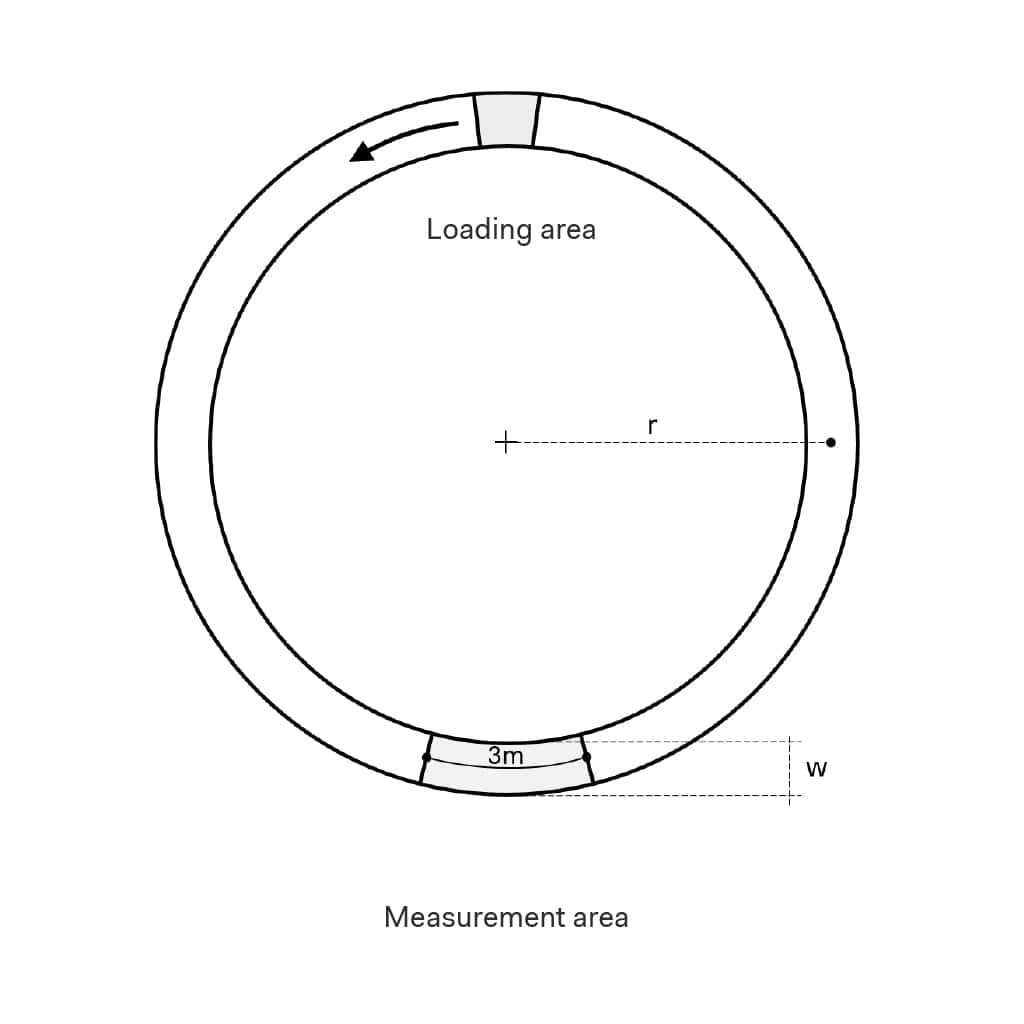
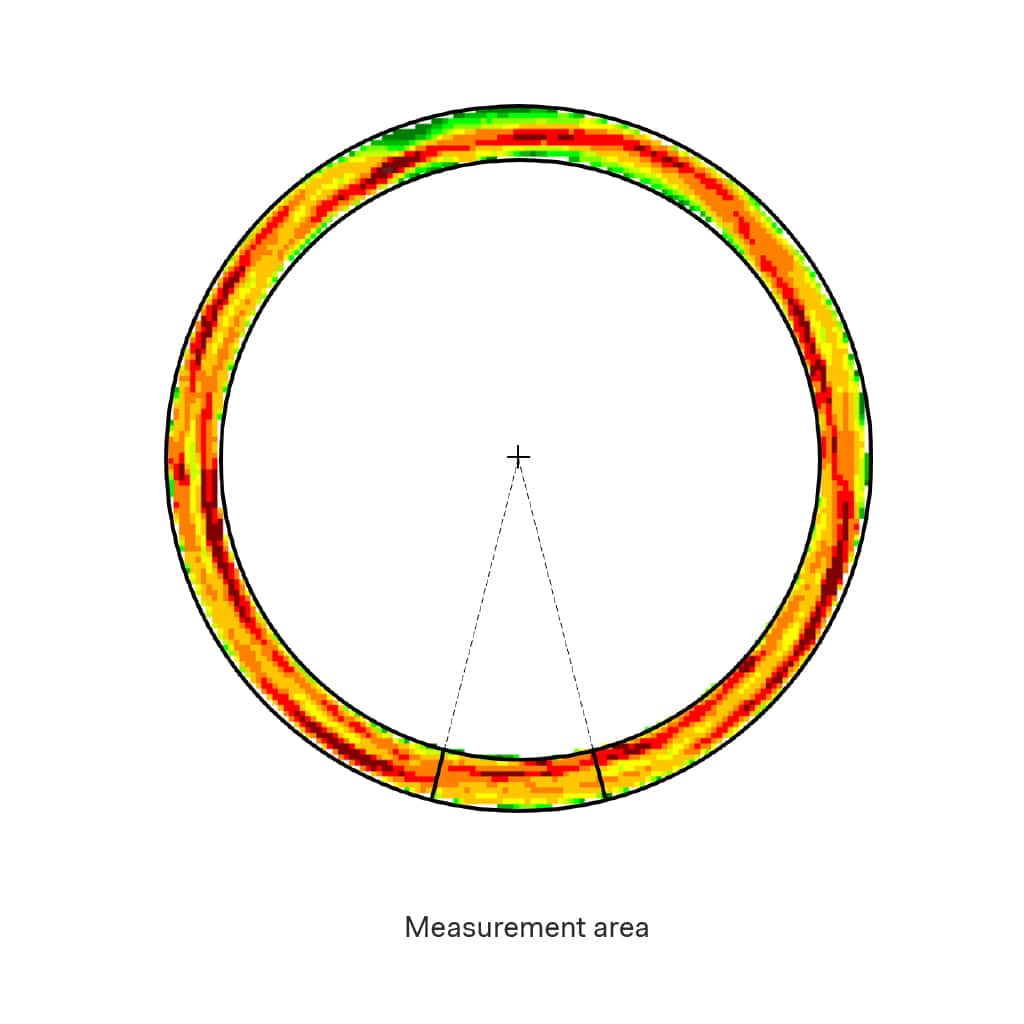
The calibrated SFM under social distancing (SD), and the default model (Business as Usual: BAU), were used to build the pedestrian fundamental diagrams for both conditions. The straight corridor set-up did not allow to observe the complete domain of densities of the fundamental diagram, since the flow input was limited by the release (loading) capacity. To overcome this limit, a closed loop set-up was implemented, as done by Seyfried et al. (2005), so it was possible to observe also hypercritical flow conditions (i.e., densities exceeding the density-at-capacity). The following image shows the simulation set-up (see Figure 2):
Fundamental Diagrams and Volume-Delay Functions
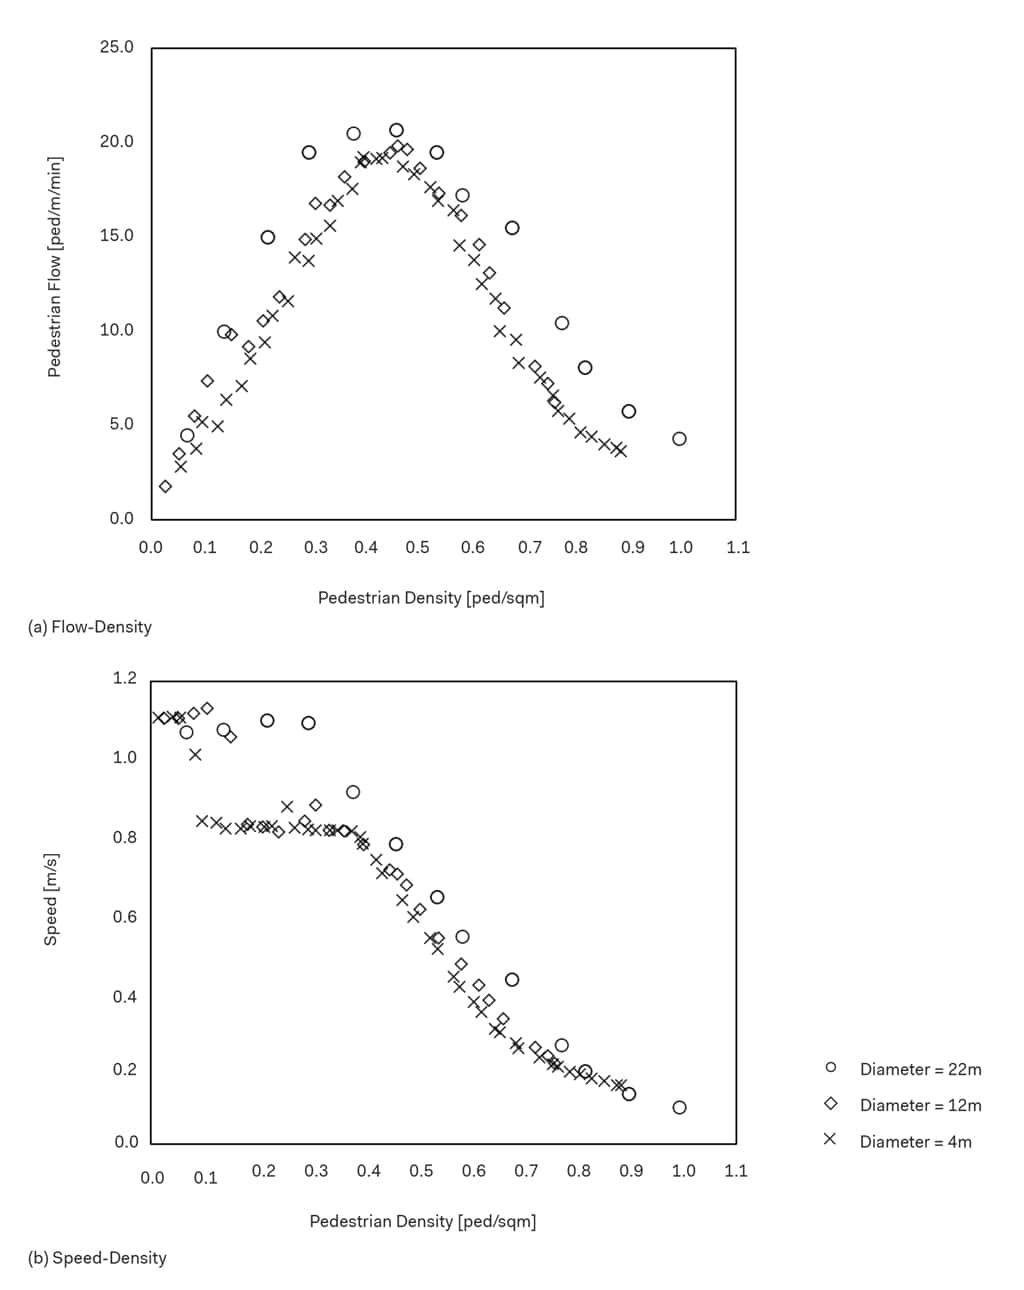
From the results of the microscopic model, the fundamental diagrams for the BAU Model and the SD Model were built (see Figure 3). A significant reduction in the capacity is observed under social-distancing conditions, going down from 63 ped/m/min in the BAU model to 21 ped/m/min in the SD model. The maximum density falls down from 4 ped/sqm to 1 ped/sqm, which was indeed the maximum density used as input for the calibration of the social-force model parameters (Deponte et al., 2020).
In order to apply the findings from the microscopic simulation model into a large-scale macroscopic pedestrian assignment model, both the hypo- and hypercritical parts of the fundamental diagrams were used to calibrate Pedestrian Volume-Delay Functions for BAU and SD models, through the least-squares method. In this work the standard BPR (Bureau of Public Roads, 1946) function formulation was used.
Case Study
The calibrated Pedestrian Volume-Delay Functions were then used in a large-scale macroscopic pedestrian assignment developed in the software PTV Visum (PTV Group, 2021). The chosen case study was the City of Venice, Italy. The main island of the Venetian Lagoon is certainly a suitable example of a dense urban pedestrian network to apply and analyze people flow distribution across a complex urban context through the use of User-Equilibrium Pedestrian Assignment. The model implements an OD matrix including both external trips (between the island and the dry land) and internal trips (Origin and Destination within the island) for the morning peak hour of an average working day. The total estimated pedestrian OD matrix consists of 15,700 trips.
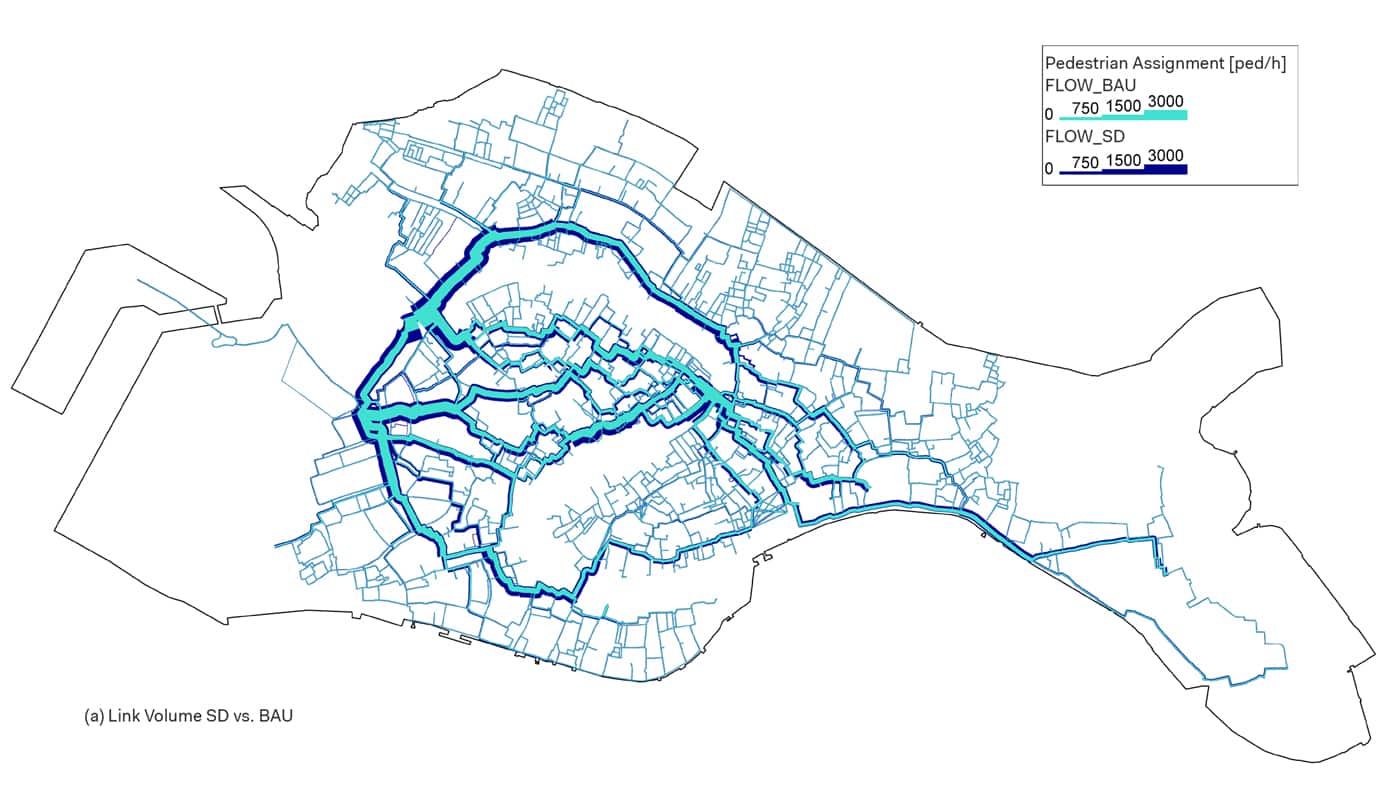
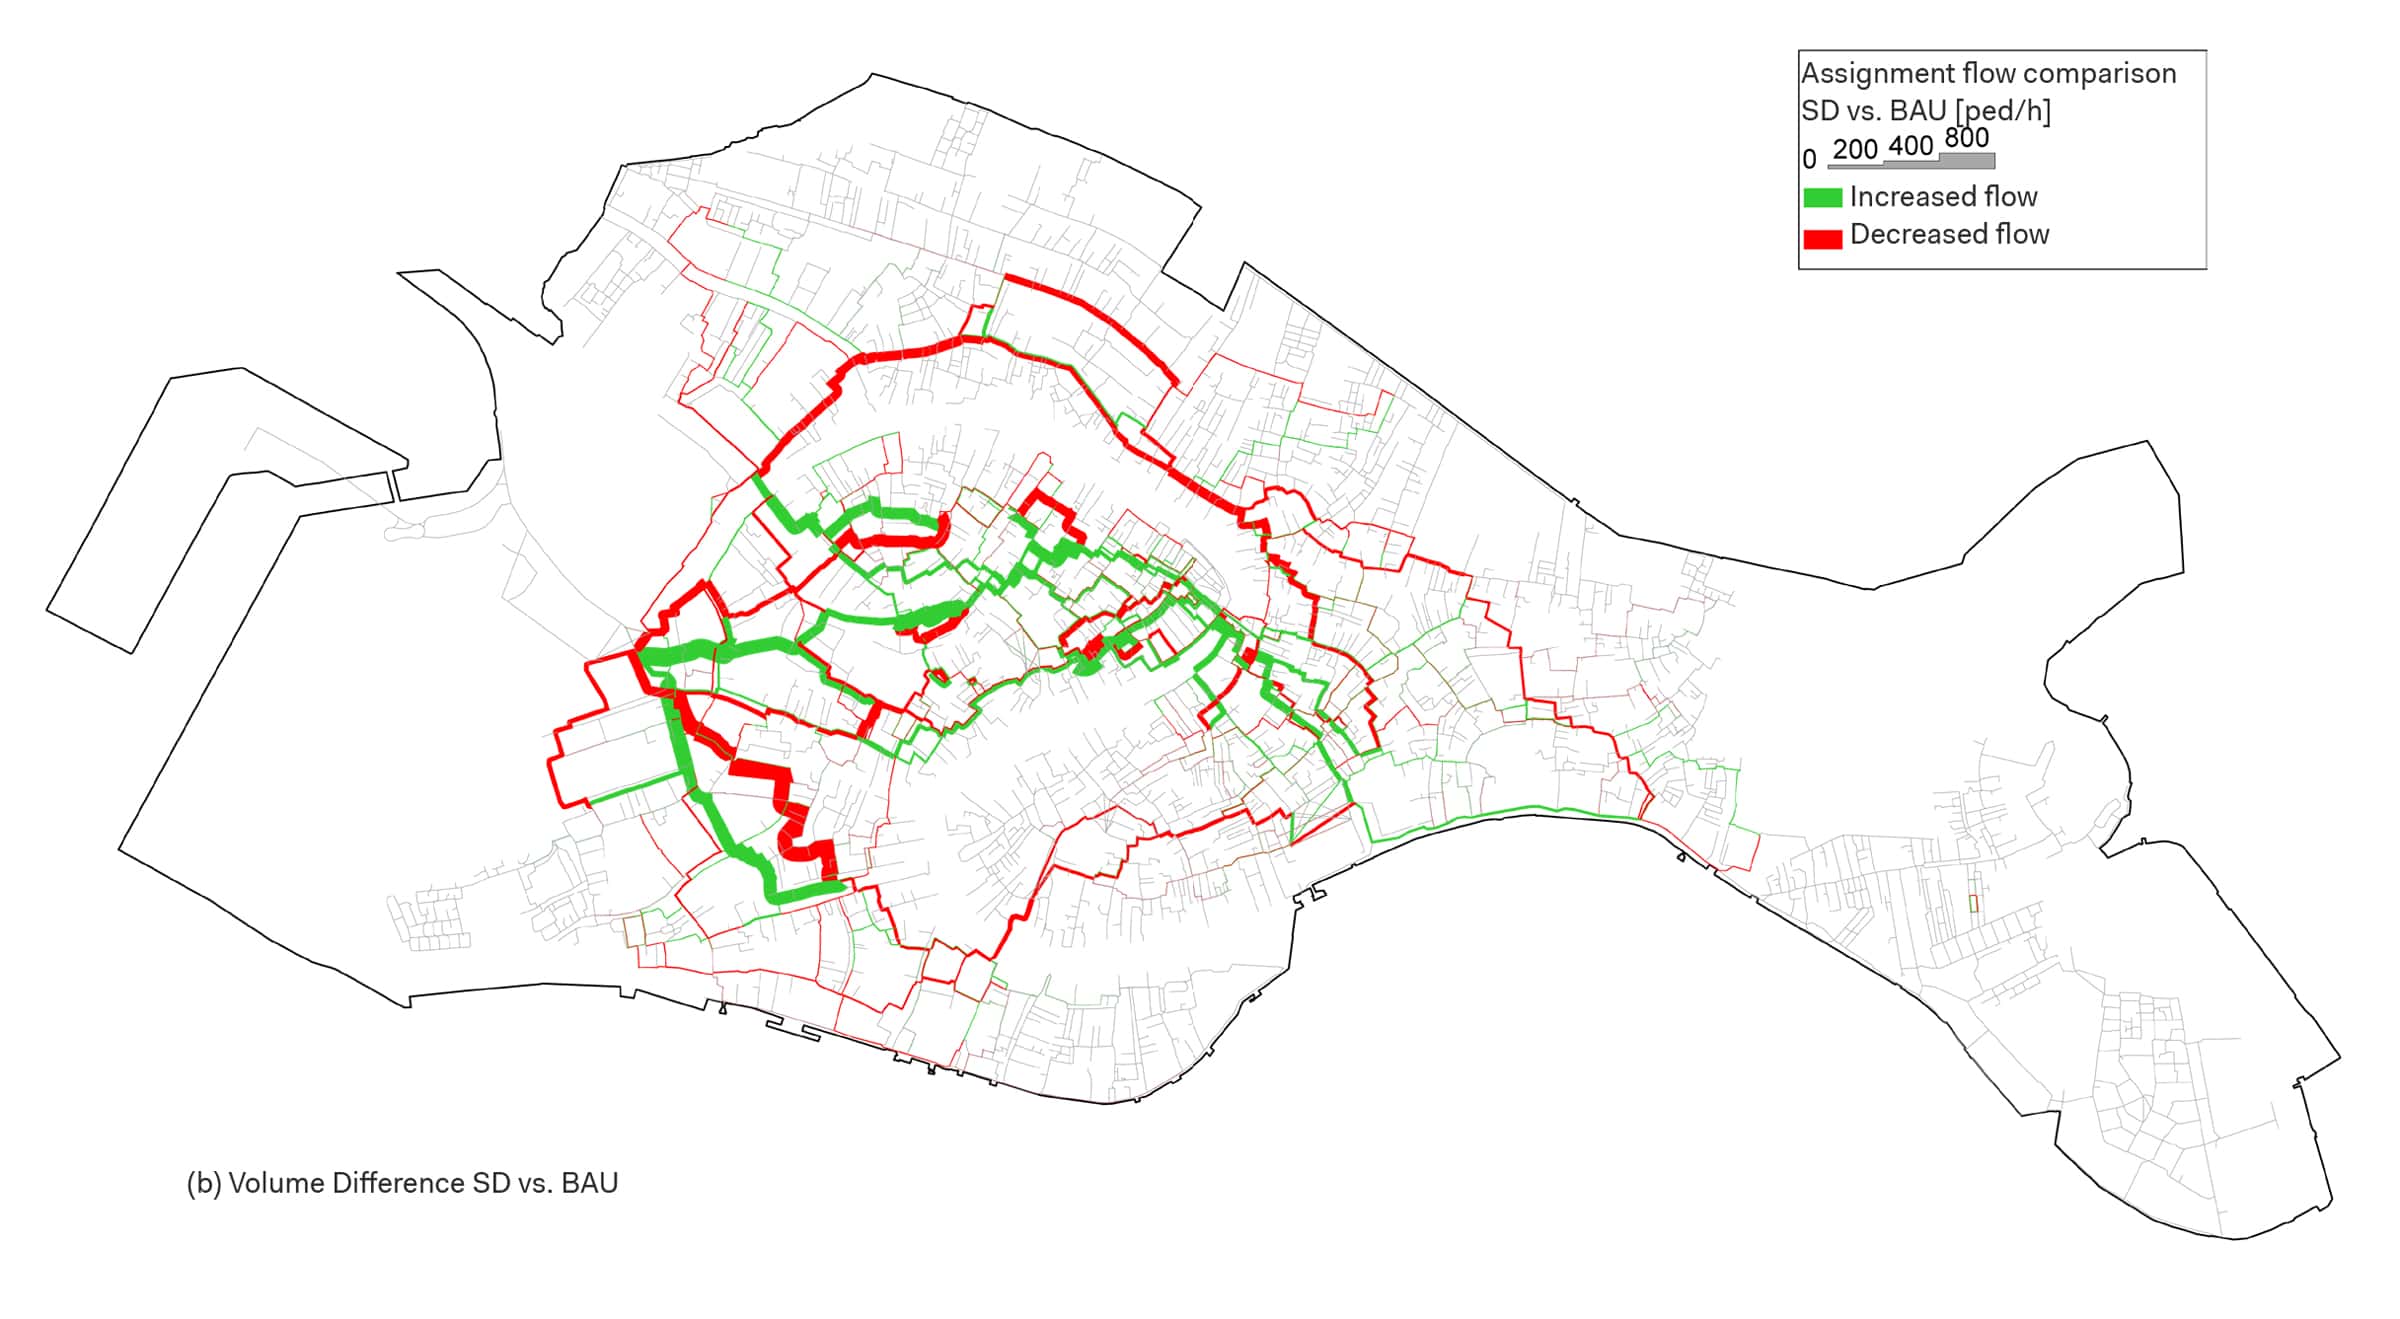
Figure 4 (a) shows the pedestrian assignment flows in the network for both the BAU and SD models, while Figure 4 (b) shows volume differences in the SD assignment compared to the BAU model. Significant volume differences are observed in the network, not only at link-level (localized) but also at paths-level (large scale). Looking at the large-scale, in the SD assignment the pedestrian flows increase along the northern and southern sectors of the island, while the flow along the central connection (The Rialto Bridge) decreases significantly (-15%). This is the result of the redistribution of flows coming from Piazzale Roma and the Railway Station and going to the eastern part of the island. Detouring through the Cannaregio district (north) or through Dorsoduro district (south), allows to reach a new equilibrium by maintaining lower densities.
Concluding remarks
Beside the ability to support the definition and the operational assessment of effective responsive strategies to face the impact of the Covid-19 pandemic on urban mobility, the proposed analytical approach demonstrates the importance of pedestrian modeling and simulation. The use of advanced and robust pedestrian macroscopic models capable of capturing and replicating a larger variety of pedestrian dynamics allows to enrich the definition of innovative city walking plans with further valuable and evidence-based insights. In fact, the main goal of state-of-the-art walking plans, which consist of operational and actual implementation programs, is to understand, analyze, foresee and manage people movements in and around cities, allowing people to get access to urban opportunities, meet, and move safely and easily, by ensuring permeability, access for all abilities and planning for future growth.
The results of this research activity have been published in the following scientific Journals: Espitia, E., Gorrini, A., Vacca, A., Deponte, D., Sarvi, M. (2022). How Covid-19 is Affecting Pedestrian Modelling and Simulation: The Case of Venice. Transportation Research Record. https://doi.org/10.1177/03611981221088224
Acknowledgments
We thank Prof. Majid Sarvi (University of Melbourne, VIC, Australia) for his contribution as co-author of the paper. We also thank the team of PTV for their collaboration and for sharing information about how to calibrate the model of the Viswalk platform, and Simone Castelnuovo (Senior Consultant of Systematica Srl) for his fruitful contribution in calibration of the model. This research received no specific grant from any funding agency in the public, commercial, or not-for-profit sectors.
References
Gorrini, A., L. Crociani, L. Vizzari, G., and S. Bandini. (2018). Stress estimation in pedestrian crowds: Experimental data and simulations results. Web Intelligence, 17(1), 85-99. http://dx.doi.org/10.3233/WEB-190403
Helbing, D. and P. Molnar (1995). Social force model for pedestrian dynamics. Phys. Rev. E, 51(5), 4282-4286. https://doi.org/10.1103/PhysRevE.51.4282
Deponte, D., G. Fossa, G., and A. Gorrini (2020). Shaping space for ever-changing mobility. Covid-19 lesson learned from Milan and its region. TeMA – Journal of Land Use, Mobility and Environment, 2020, 133-149. https://doi.org/10.6092/1970-9870/6857
Kretz, T. (2015). On oscillations in the social force model. Physica A: Statistical Mechanics and its Applications, 438, 272-285. https://doi.org/10.1016/j.physa.2015.07.002
Seyfried, A., B. Steffen, W. Klingsch, and M. Boltes (2005). The fundamental diagram of pedestrian movement revisited. Journal of Statistical Mechanics: Theory and Experiment, 2005, 10, P10002. https://doi.org/10.1088/1742-5468/2005/10/p10002
Bureau of Public Roads (1946). Traffic Assignment Manual, Department of Commerce, Urban Planning Division, US Department of Commerce, Washington, DC.
PTV Group (2021). PTV Visum. Karlsruhe: PTV Group.