
The development of new technologies is shaping the growth of cities in many ways. Among these, the Internet of Things (IoT), Artificial Intelligence (AI), the high-resolution global positioning system (GPS), big data and new building materials and techniques are expected to transform cities’ core functioning elements, affecting all aspects of our lives (Joint Research Centre, 2019; Geospatial Commission, 2020). When technology is combined with the growing availability of open data, new possibilities emerge to develop a novel understanding of the urban fabric and use.
Deep learning algorithms are a subset of machine learning algorithms that process and combine their input in ever growing abstractions to obtain meaningful outputs. This project focuses on the analysis of pre-trained deep learning models for object detection, image segmentation and crowd counting and on their applications on research topics linked to the understanding of temporal patterns related to the development of Covid-19, climate analysis and thermal comfort, and their integration with transport modelling.
Deep learning algorithms are of particular interest in the field of computer vision, enabling the manipulation of large datasets in an automatic way. In the past years, the rising availability of deep learning techniques led to new frontiers in the automatic understanding of images and estimating the number of objects within an image. Deep learning methods obtained state-of-the-art results for image classification, object detection (Zhao et al., 2019) and instance/semantic segmentation tasks. Furthermore, in the past years, the availability of pre-trained weights for deep learning algorithms has grown.
Dataset and First Steps
The study area centers around Corso Buenos Aires, Milan, one of the longest and most well-known retail streets in Europe (Transform Transport, 2018). The dataset consists of a collection of images (from MilanoCam) depicting the street with a strong perspective view, showing the flow of vehicles and people from Piazza Lima to Porta Venezia. These are taken at one-hour intervals, with a high potential for comparative analyses of changes in the street use behavior at peak times and different seasons.
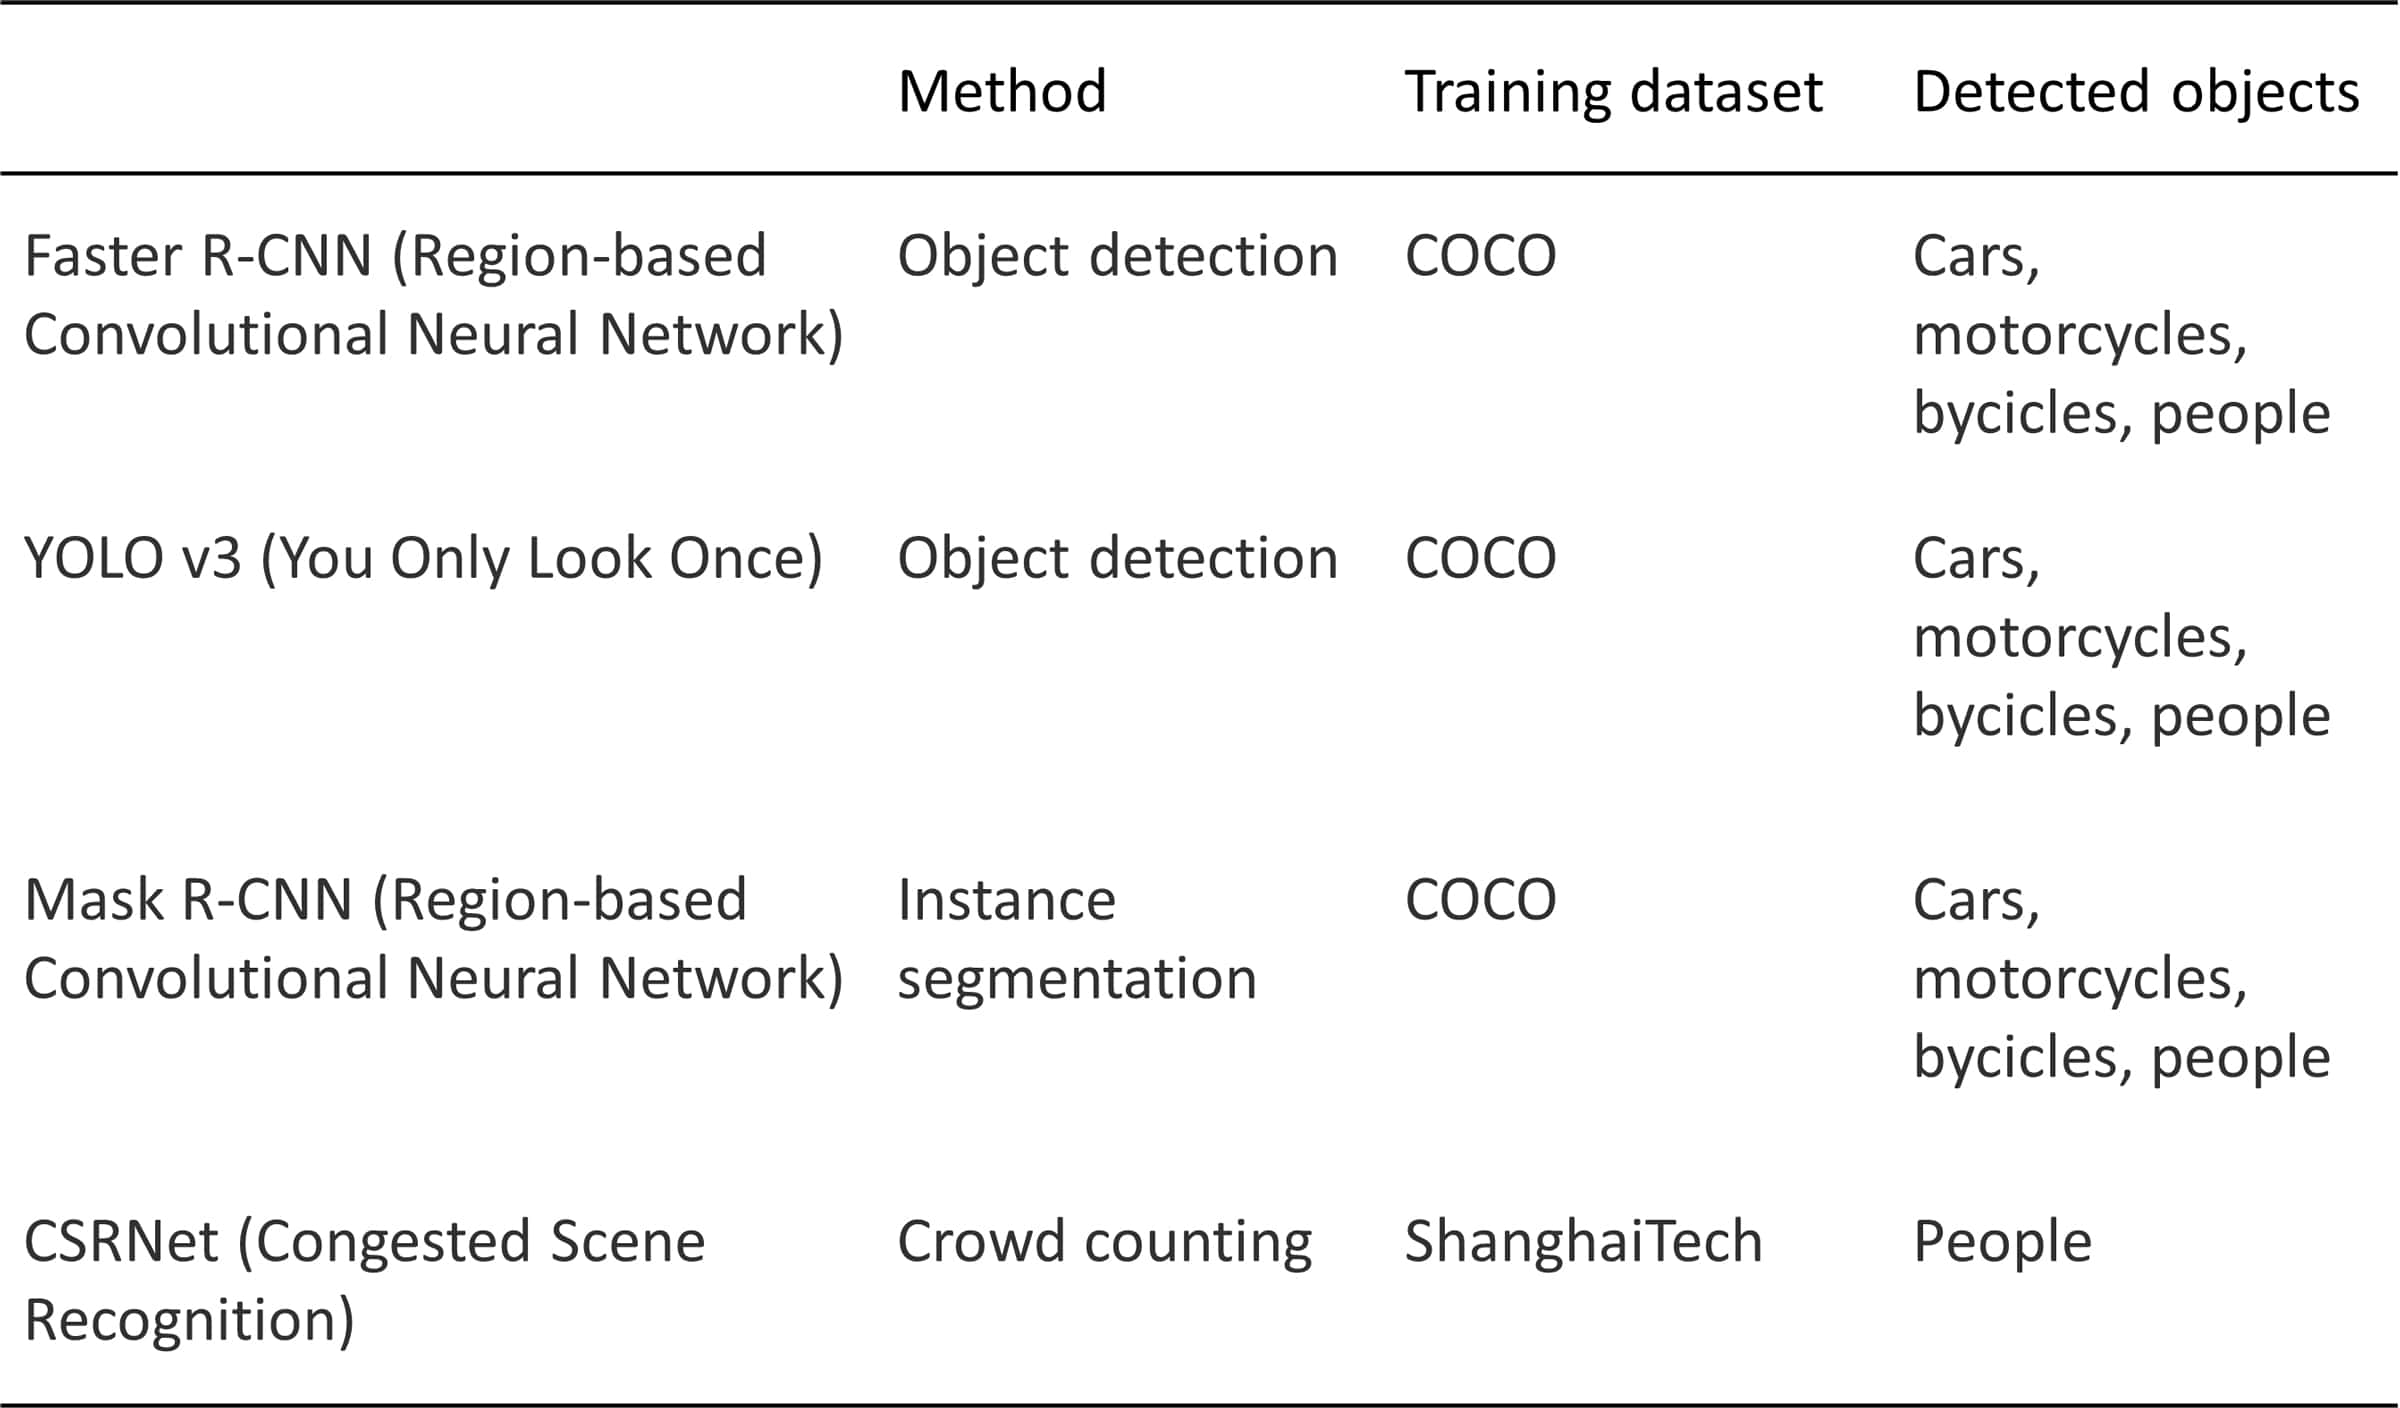
The current study builds on previous research presented in Shifting Paradigm 1st edition, which was structured in two phases. In the first phase, a set of algorithms with pre-trained weights were selected based on their popularity and tested on a selection of 16 images. The results were then measured against the manual counts performed on each image. The goal was to define the usability of these models out-of-the-box, for the given dataset. Table 1 outlines algorithms tested within Phase 1 of the research and Table 2 lists the mean deviation between automatic counts and manual ones for each algorithm, computed as:
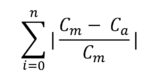
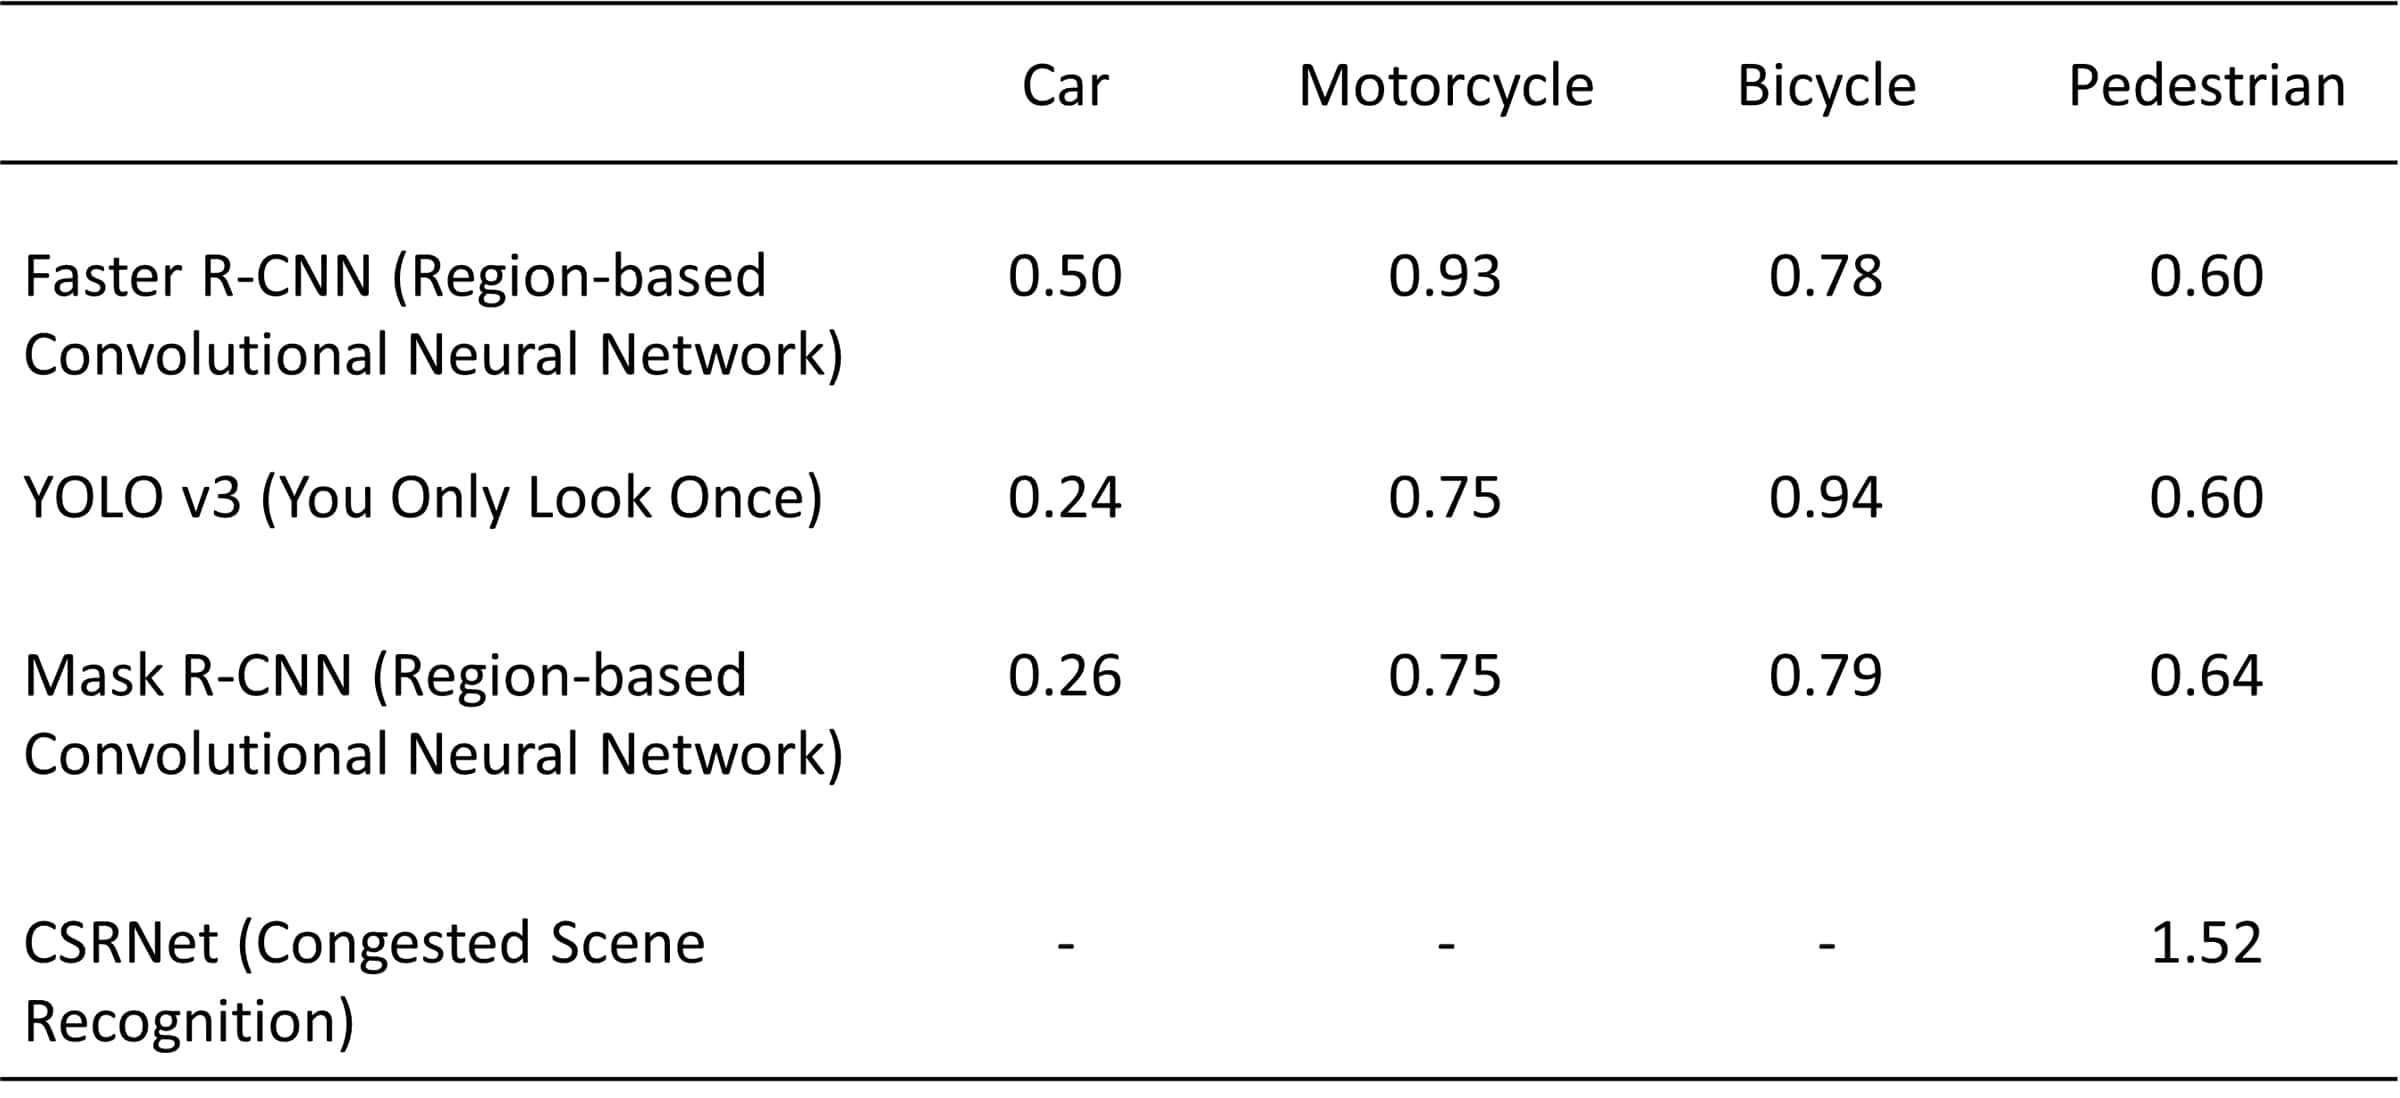
and manual counts for each algorithm
In the second step, the analysis of the images for a year-long period was carried out. The initial focus was on the performance of the algorithms with respect to weather and light conditions as well as business activity of the street.
Finally, the study aimed to identify the patterns in the street use every day at 19:00, the moment when people leave their offices, with particular attention to the Covid-19 lockdown period. Figure 1 outlines the main temporal trends and patterns for each mode.
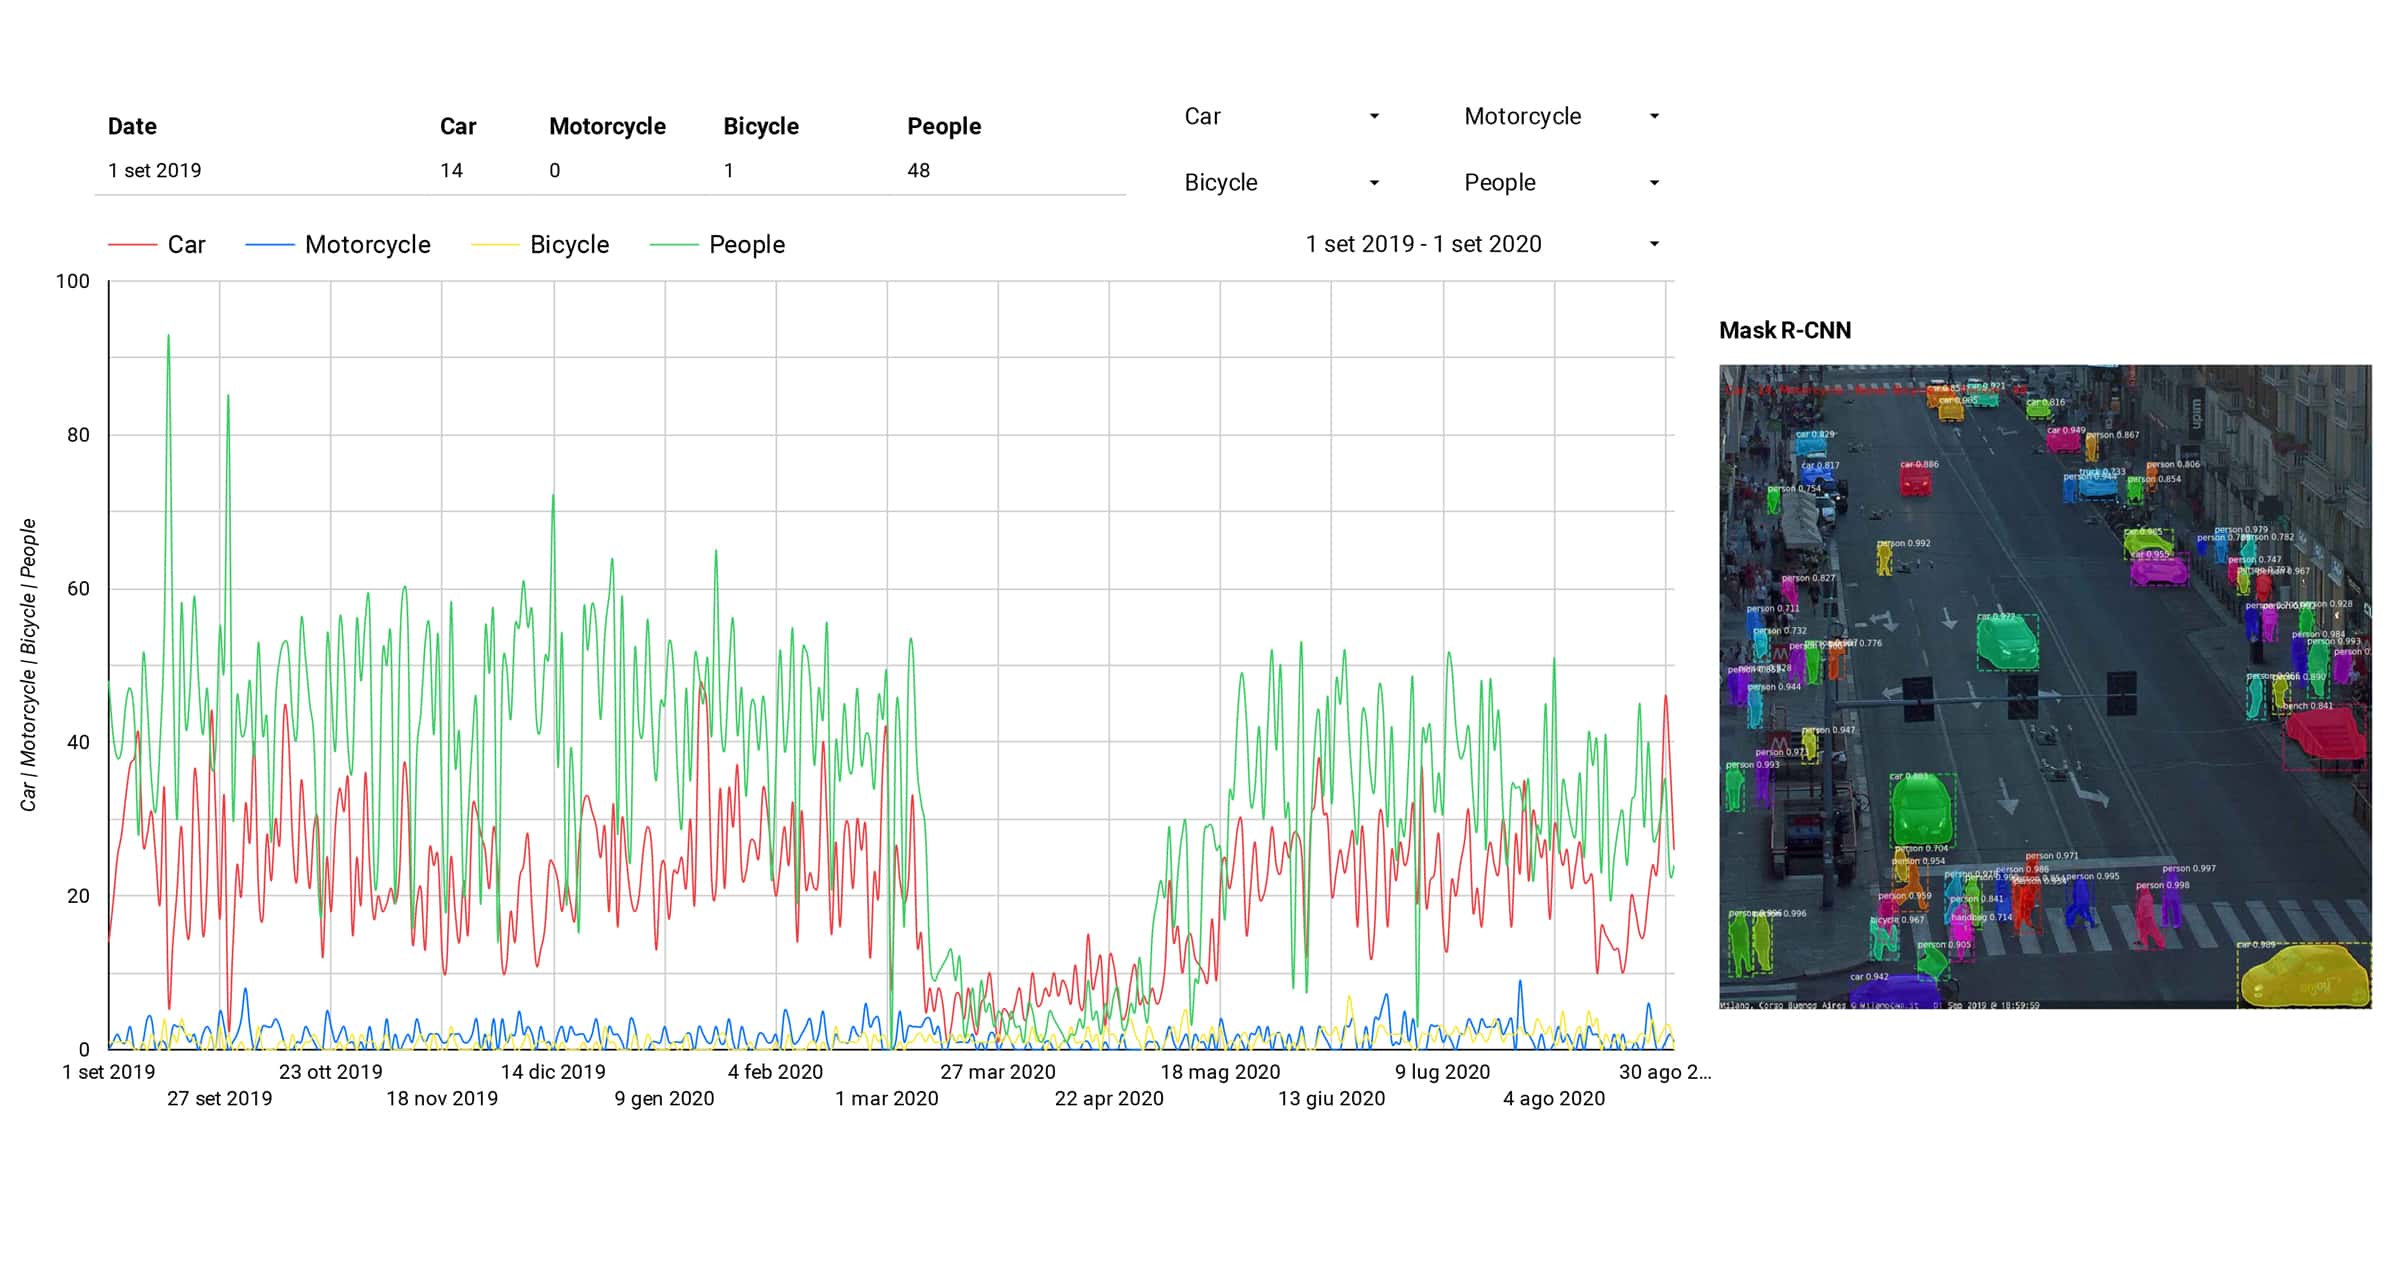
Data is available here: https://datastudio.google.com/reporting/1750a9ff-7a98-43ca-b385-5dcea733016c
Data and Tools
In the last phase, an extensive dataset of 14,956 images was constructed, representing 12 daily timeslots (6am – 10pm) between January 2019 and May 2021. These were then analyzed on the fly using Yolov5 (You Only Look Once) (Jocher et al., 2021) as an object detection algorithm. The goal was to recognize pedestrians and locate them in an image.
YOLOv5 represents an evolution of the YOLO architecture, which enables faster and more accurate class predictions. This architecture relies on CSPDarknet53 as the backbone and PAN as an aggregator level. Furthermore, it uses image augmentation methods in training to improve accuracy in results (Gutta, 2021).
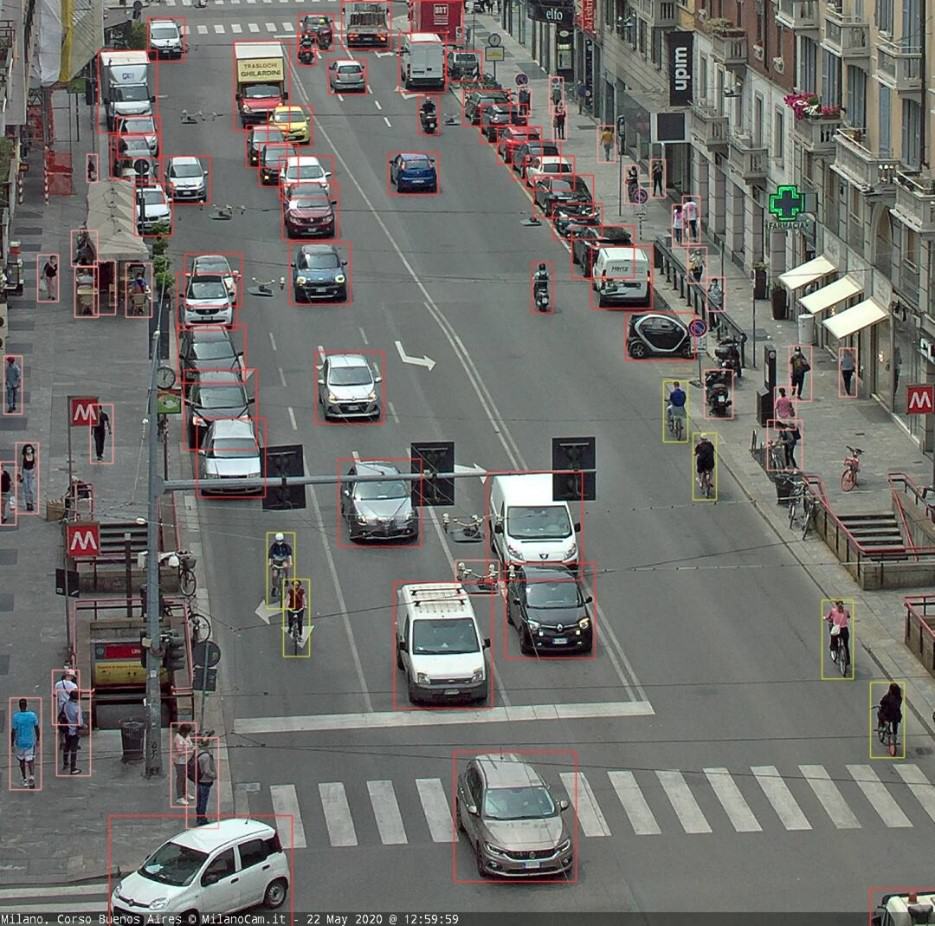
An open-source model was used to detect objects in the images, which was trained on CCTV cameras in Montreal. The dataset represents vehicles, pedestrians, constructions, cyclists, and bus instances, obtaining a mean Average Precision (mAP) equal to 0.809 in pedestrians’ recognition on the original training set (City of Montreal, 2021). Figure 2 shows results on a sample image of Corso Buenos Aires.
Analyses
Building on knowledge obtained from previous research, the study was then structured in four steps, which focus on the analysis of pedestrian patterns in Corso Buenos Aires with increasing temporal granularity (i.e., months, day types, hours) and spatial accuracy (i.e., whole image, sidewalks).
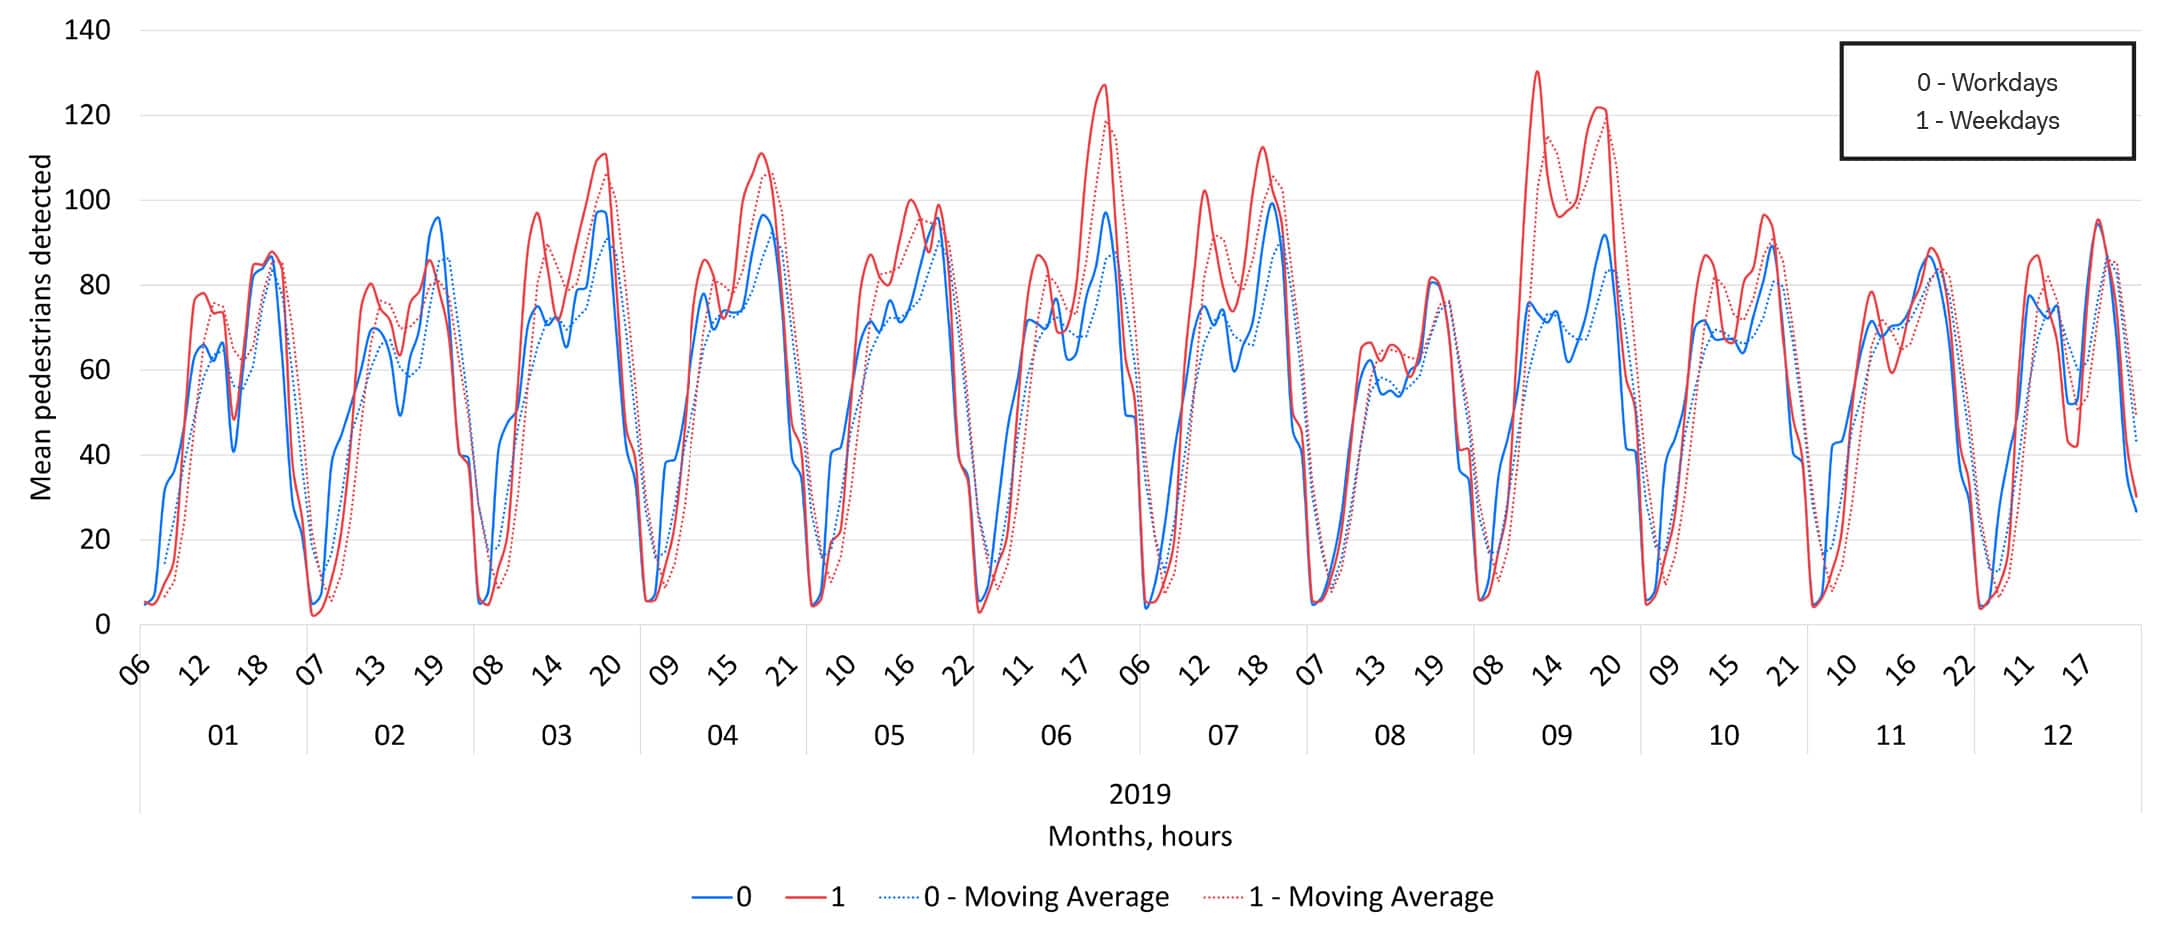
First, an exploratory analysis was performed on the dataset (see Figure 3). The goal was to visualize overall trends in registered pedestrian footfall in 2019. Figure 3 shows average monthly profiles for weekdays and weekends. These present expected patterns, with anomalies in June and September, when extraordinary events (i.e., Fashion week, Giro d’Italia, etc.) occurred in the street. Then, the internal validity of the dataset was assessed from two perspectives.
Workdays and Weekends, Pedestrians, 2019
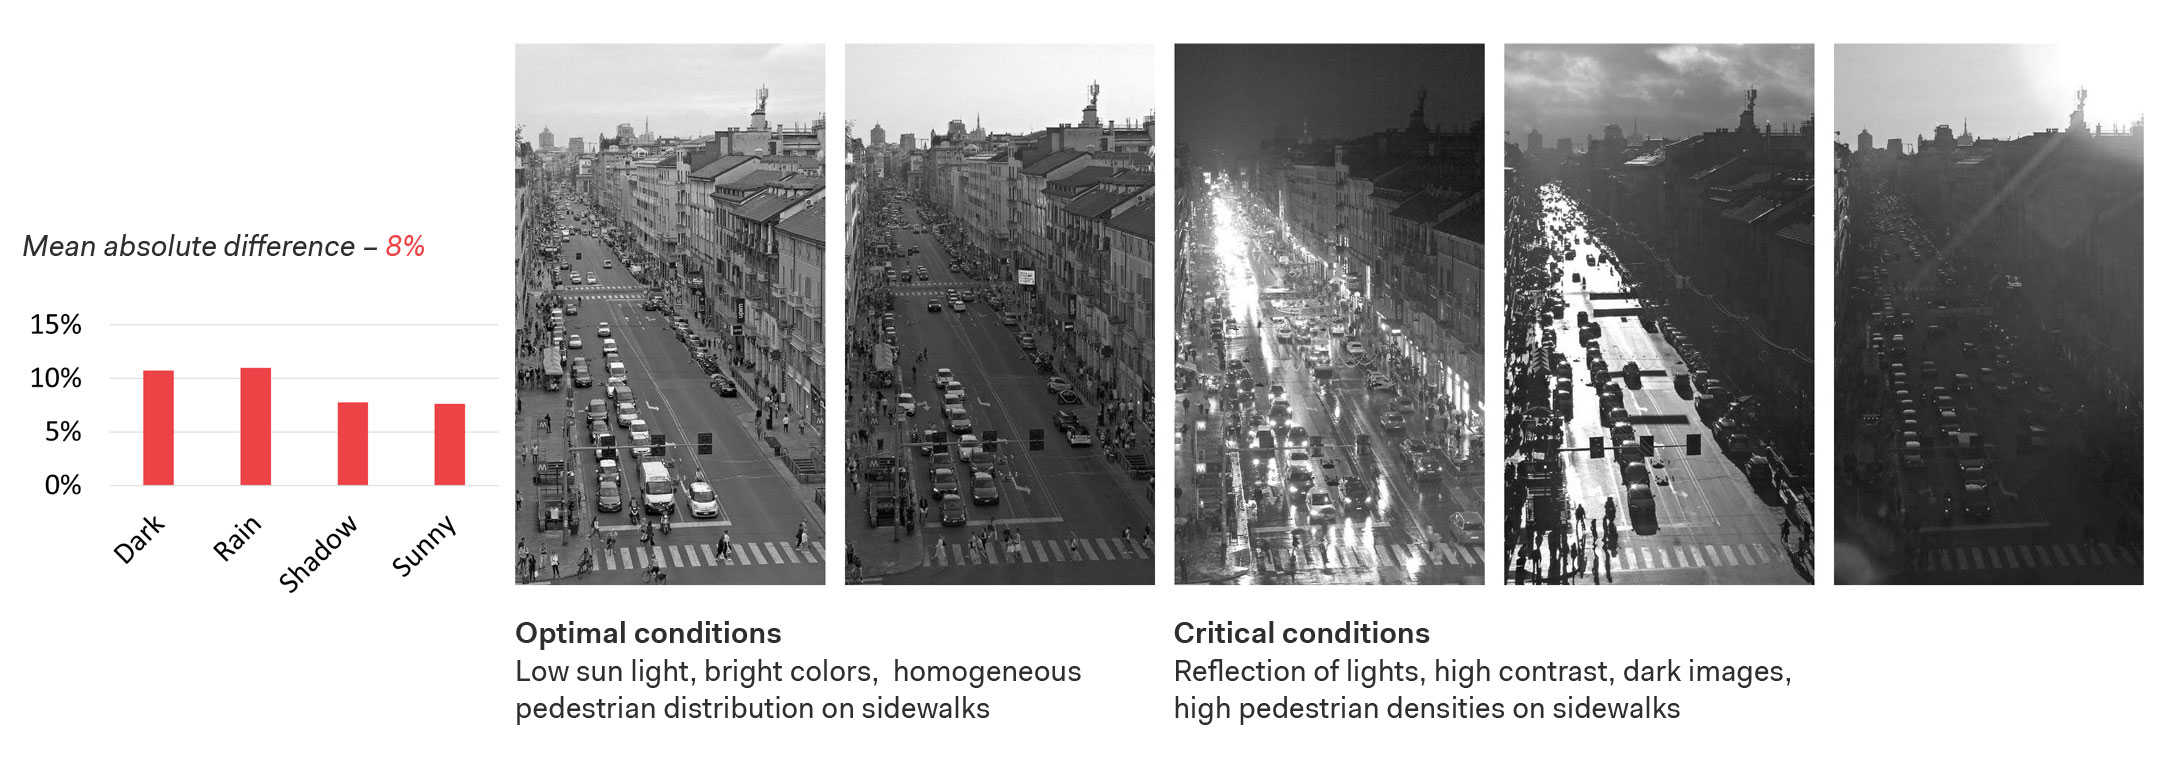
The first one aimed at quantifying the deviations of the model’s performance for different weather and lighting conditions, identifying systematic inaccuracies in the detections. Here, a manual validation methodology was implemented on 10% of all images, comparing the amount of automatically detected pedestrians with those counted manually. Results shown in Figure 4 demonstrate how darkness and rain worsen overall accuracy, leading to a mean absolute difference with manual counts above 10%. Instead, shadow and sun conditions affect results slightly, leading to a mean absolute difference equal to roughly 7.5%.
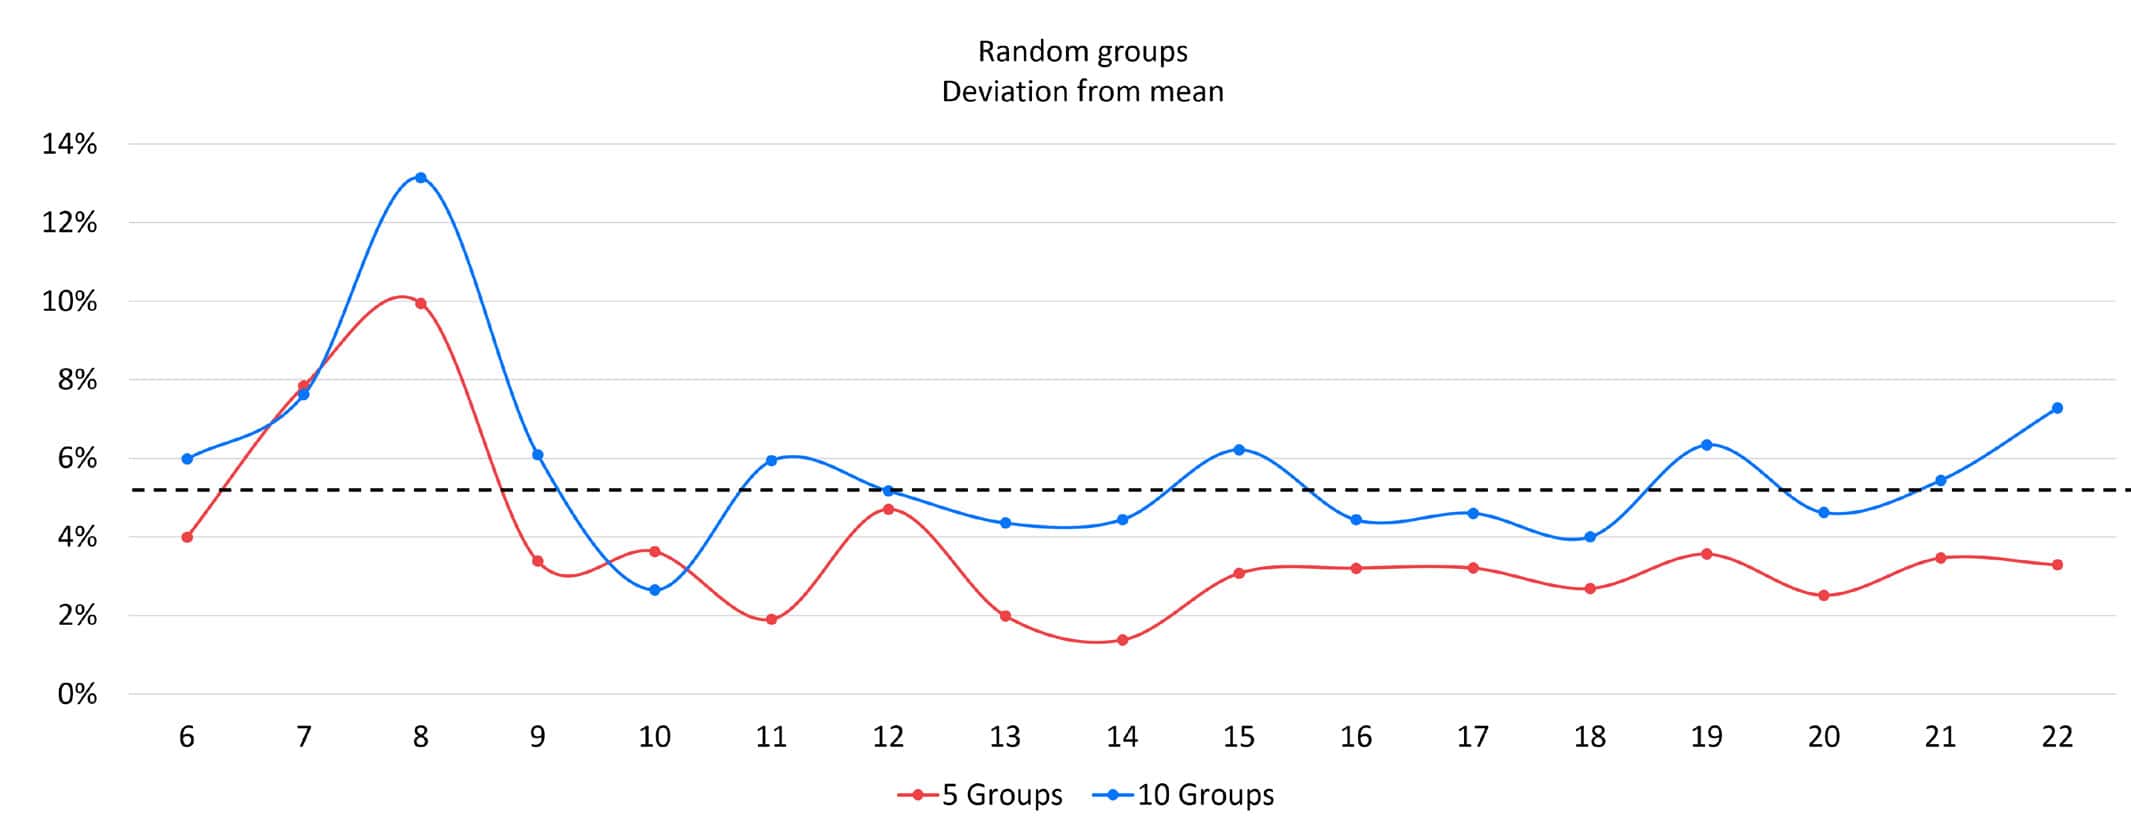
The second validity check aimed at defining the reliability of the dataset through a sensitivity analysis on data robustness and outliers. Data for the year 2019 was analyzed to ensure consistency in the analysis. First, a mean hourly number of detected pedestrians was computed. This should be the baseline value for comparisons. Then, hourly detections were grouped in random clusters. For each, the mean hourly value was computed to assess its deviation from the mean value. Figure 5 shows how splitting 2019 data into 5 random groups leads to a deviation from the mean lower than 5% for all moments of the day, with an exception for 7 and 8 am. This may be due to differences in footfall patterns during the weekday and weekends. Instead, splitting data into 5 random groups leads to a higher deviation from the mean, above the 5% threshold at multiple moments throughout the day.
The second phase of the study investigated specific patterns in the use of Corso Buenos Aires. The dataset was divided into five subsets, considering the Covid-19 pandemic restrictions. Then, hourly trends for workdays and weekends and for different day types were studied and compared among different restriction phases (see Figure 6). This analysis aimed at extending the one carried out in the first phase, with a focus on post lockdown restrictions. These can be classified as “necessity” restrictions (namely, movements were limited to necessity reasons, as work and grocery shopping), and “soft” restrictions (namely, leisure movements were allowed, such as shopping). The goal was to determine whether differences among the two phases could be recognized by means of pedestrian counting. Figure 6 gives an overview of the restriction phases and of the overall footfall trends.
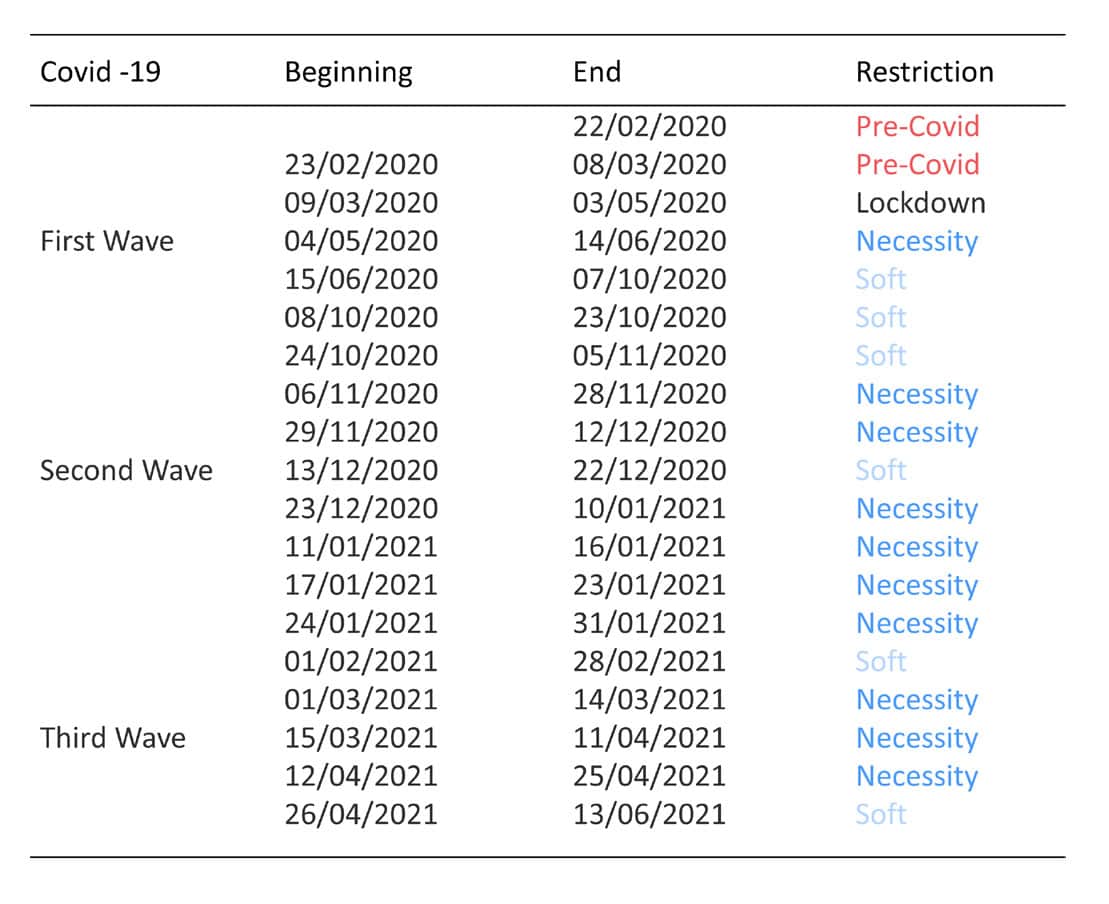
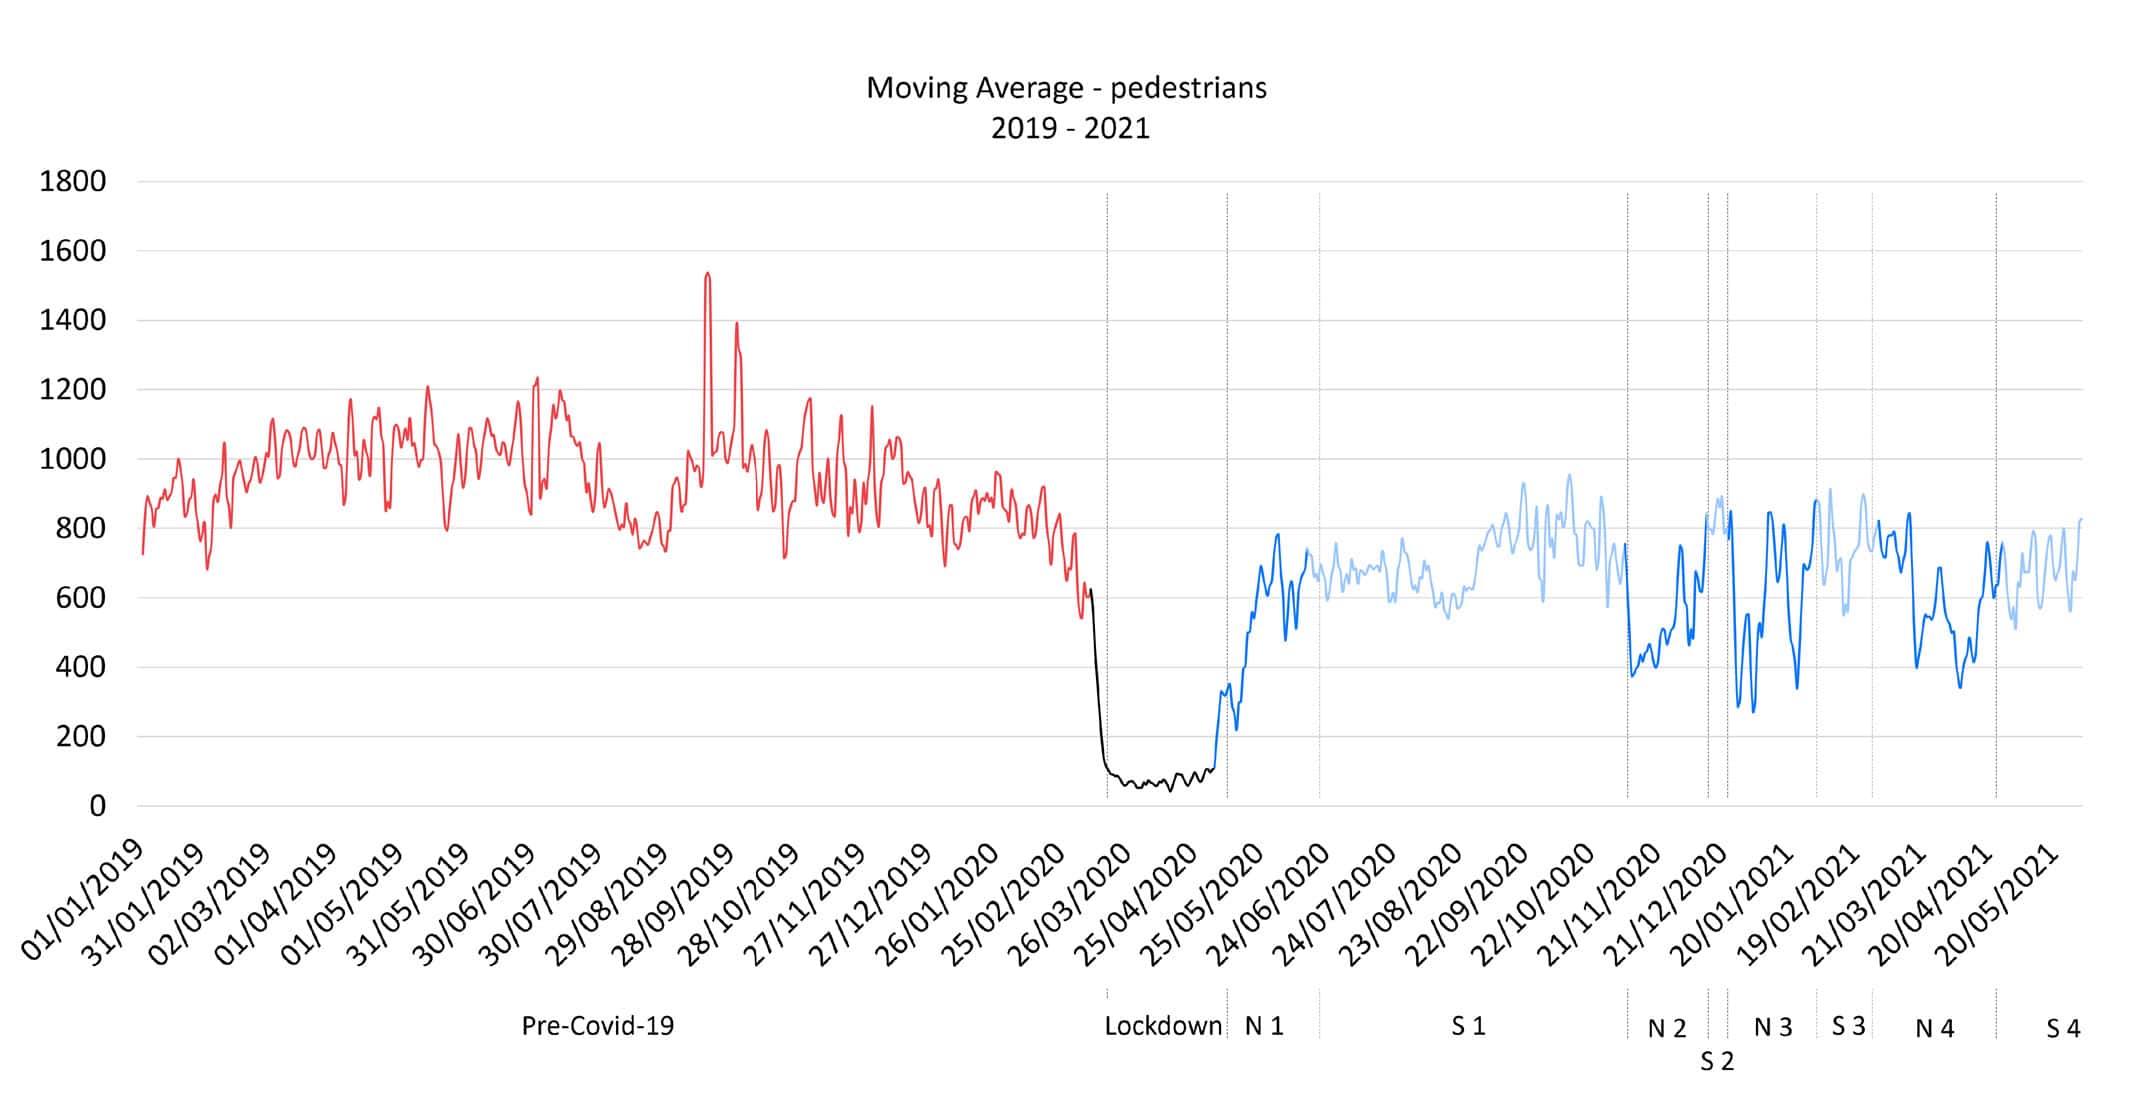
Daily pedestrian counts through Covid-19 restriction phases
Figure 7 outlines detected pedestrian volume trends by day type and hour. The top graph shows how mean pedestrian counts never reached pre-covid levels during the study period, with slight differences registered between “necessity” and “soft” restrictions phases. The bottom graph depicts hourly patterns for each restriction phase. Lower volumes were registered at lunch time and in the evening in “necessity” phases, while higher volumes can be seen in the weekends during “soft” phases. Furthermore, the effects of the curfew implementation in the city at 10pm can be seen from “necessity 2” to “necessity 4” phases.
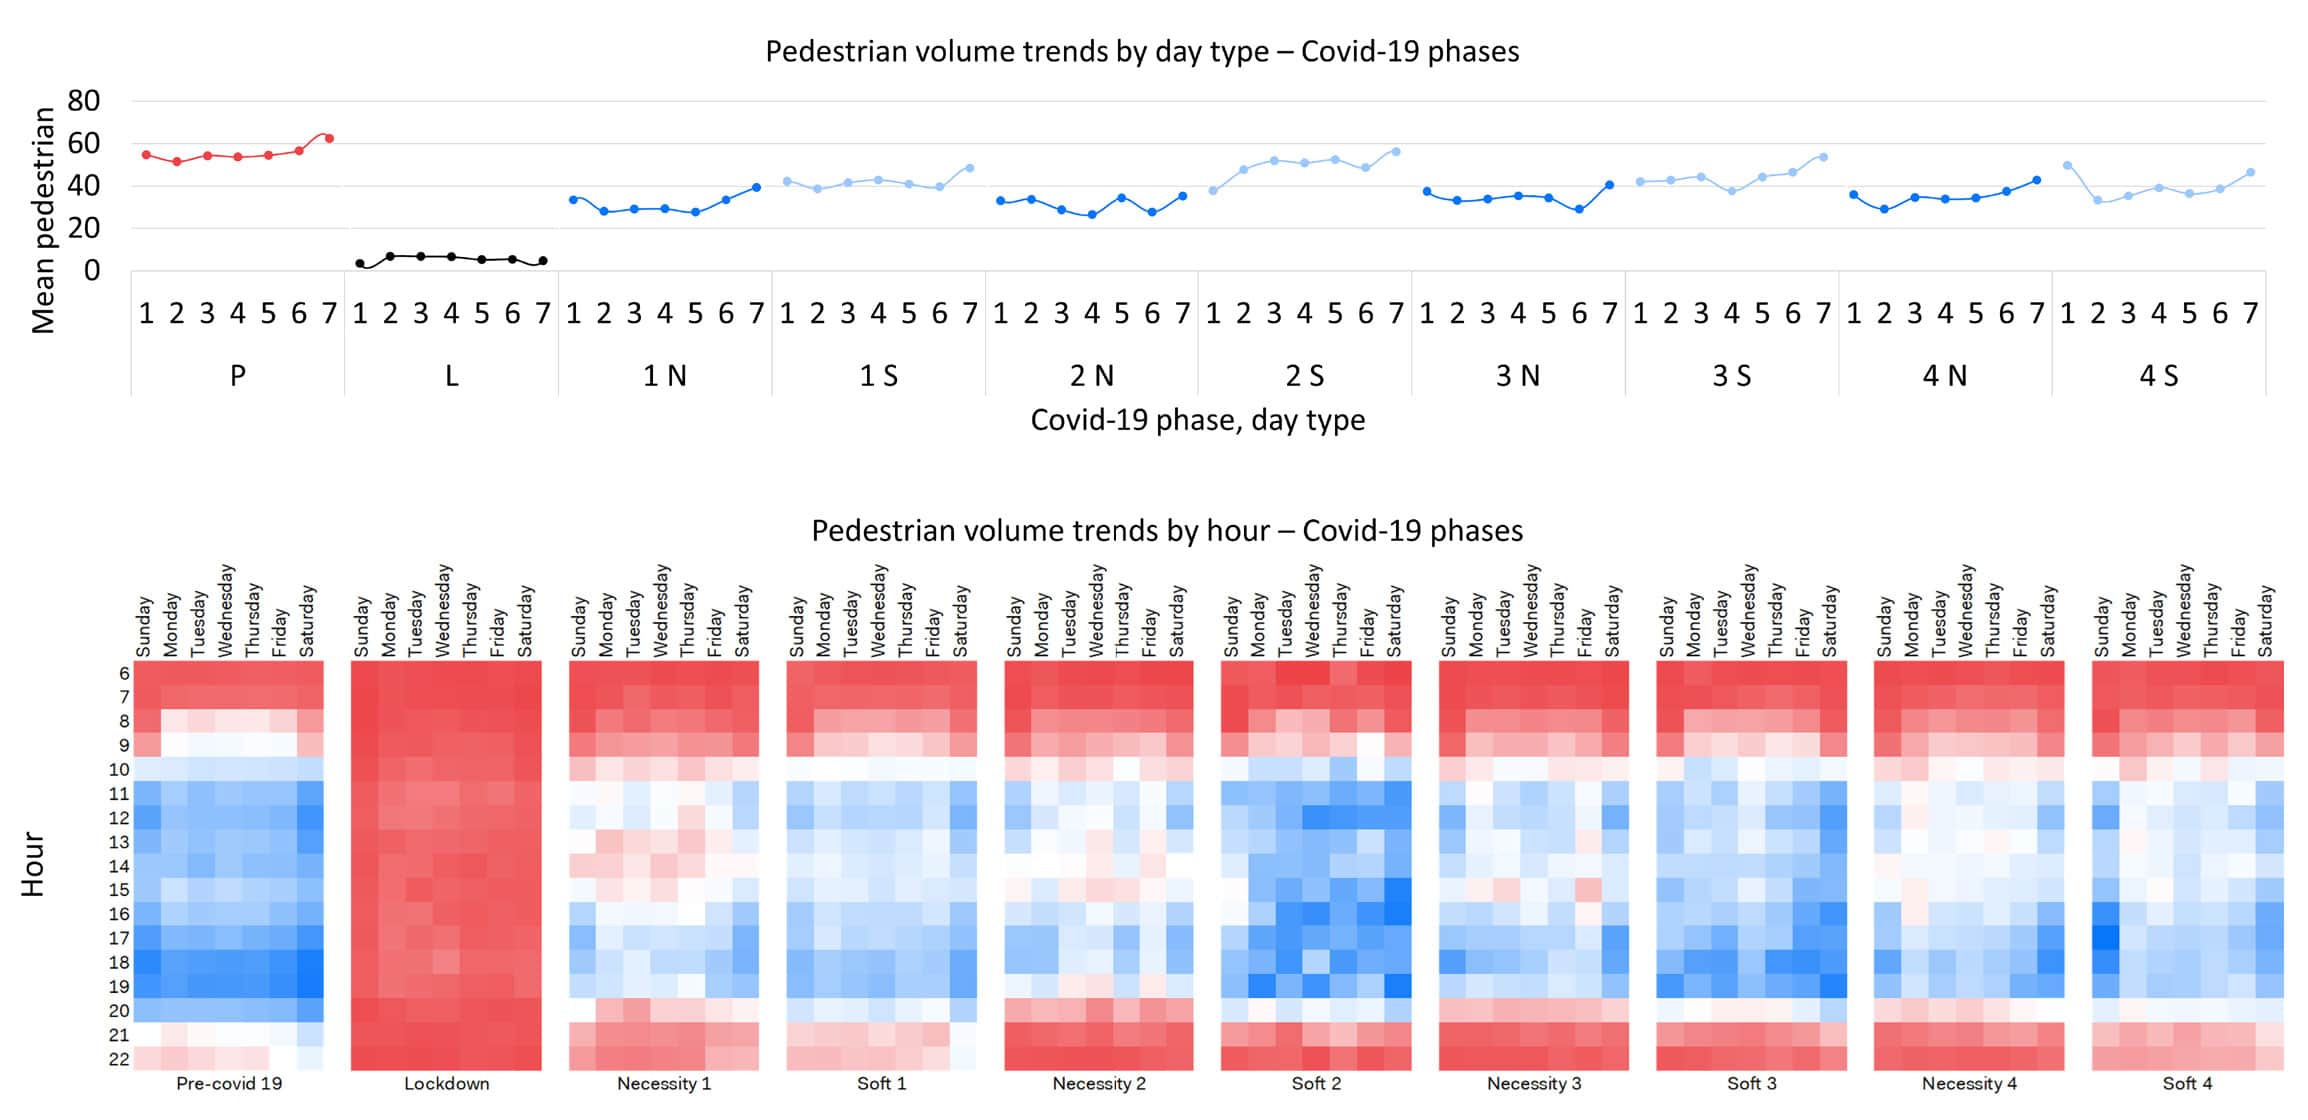
Daily pedestrian counts through Covid-19 restriction phases
The third step of the study consists in converting instantaneous pedestrian densities captured in images into pedestrian flow and related walking speed. To do so, pedestrian fundamental diagrams, specifically derived from an innovative application of dynamic microscopic model, were applied on the detections. The Social Force Model represents pedestrians as particles subject to forces (i.e., attraction and repulsion) in an analogy with fluid dynamics, quantifying pedestrian flows under business-as-usual conditions. The Social Distancing Model is a modification of the default parameters to simulate social distancing conditions (Espitia et al., 2022).
Figure 8 outlines the preliminary results on the application of these models to determine the overall influence of social distancing in the study area. The graph depicts Social Force Model and Social Distancing Model curves (red and blue curves), which quantify the hourly pedestrian flow in Corso Buenos Aires, given increasing pedestrian densities (x axis). These can be compared with the occurrences of the detected densities in the image dataset (black curve).
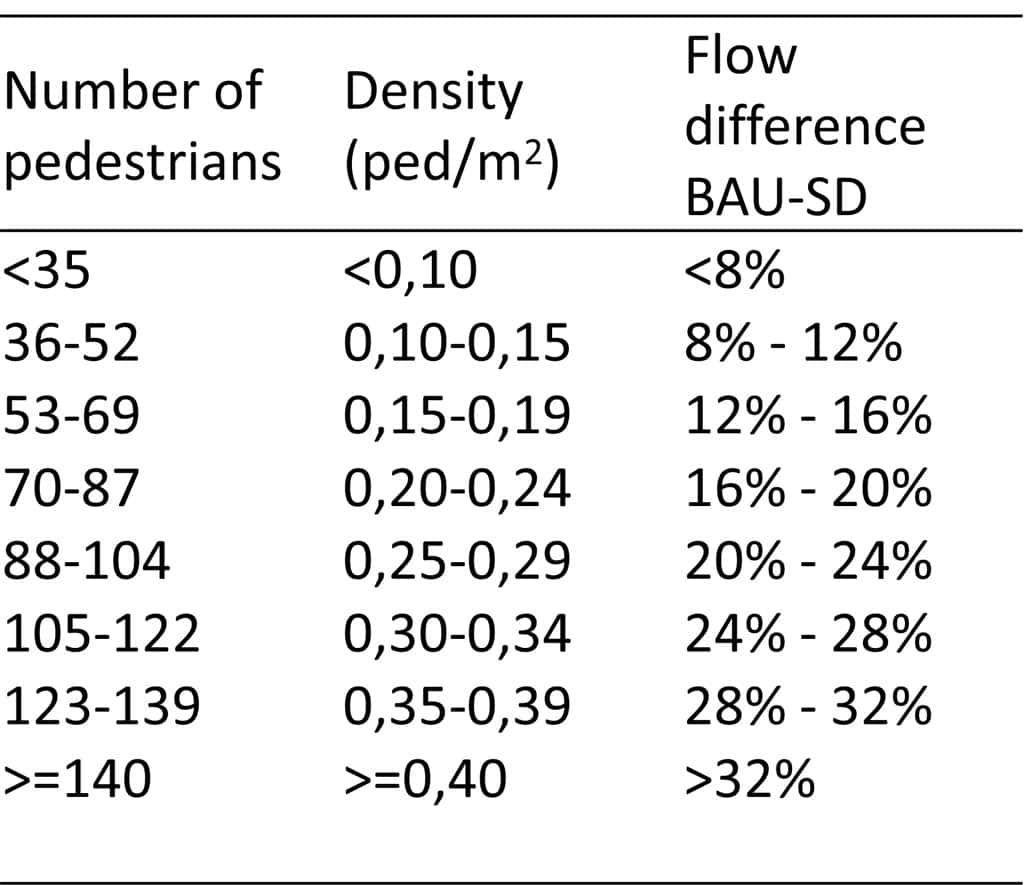
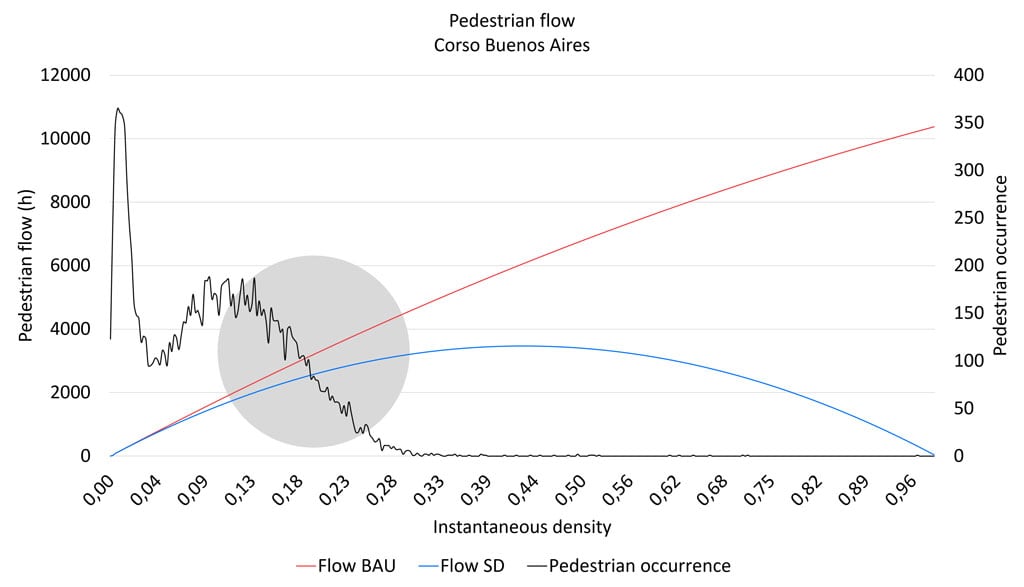
Definition of conditions that determine decrease in pedestrian flow
As can be seen, in 52% of the images in the dataset, the number of detected pedestrians would lead to a difference between business-as-usual and social distancing hourly flows greater than 8%. While images cannot be used to compute hourly flow, the graph gives insights on possible flows scenarios in different crowding conditions in Corso Buenos Aires, enabling a visual comparison with the occurrences of detected densities in images.
Lastly, a preliminary analysis on pedestrians’ distribution on sideways was carried out. As Corso Buenos Aires has a north-south orientation, its shading conditions change gradually during the day, allowing for a thorough pedestrian comfort study. In this phase, temperature and cloud conditions were researched by using an open-source meteorological dataset. These may influence the sidewalk choice. Figure 9 shows the shading conditions in Corso Buenos Aires on August 6th, 2021, between 12am and 5pm. The left sidewalk (east) is in the shade from 12am to 2pm, while the right one (west) is shaded from 3pm to 6pm.
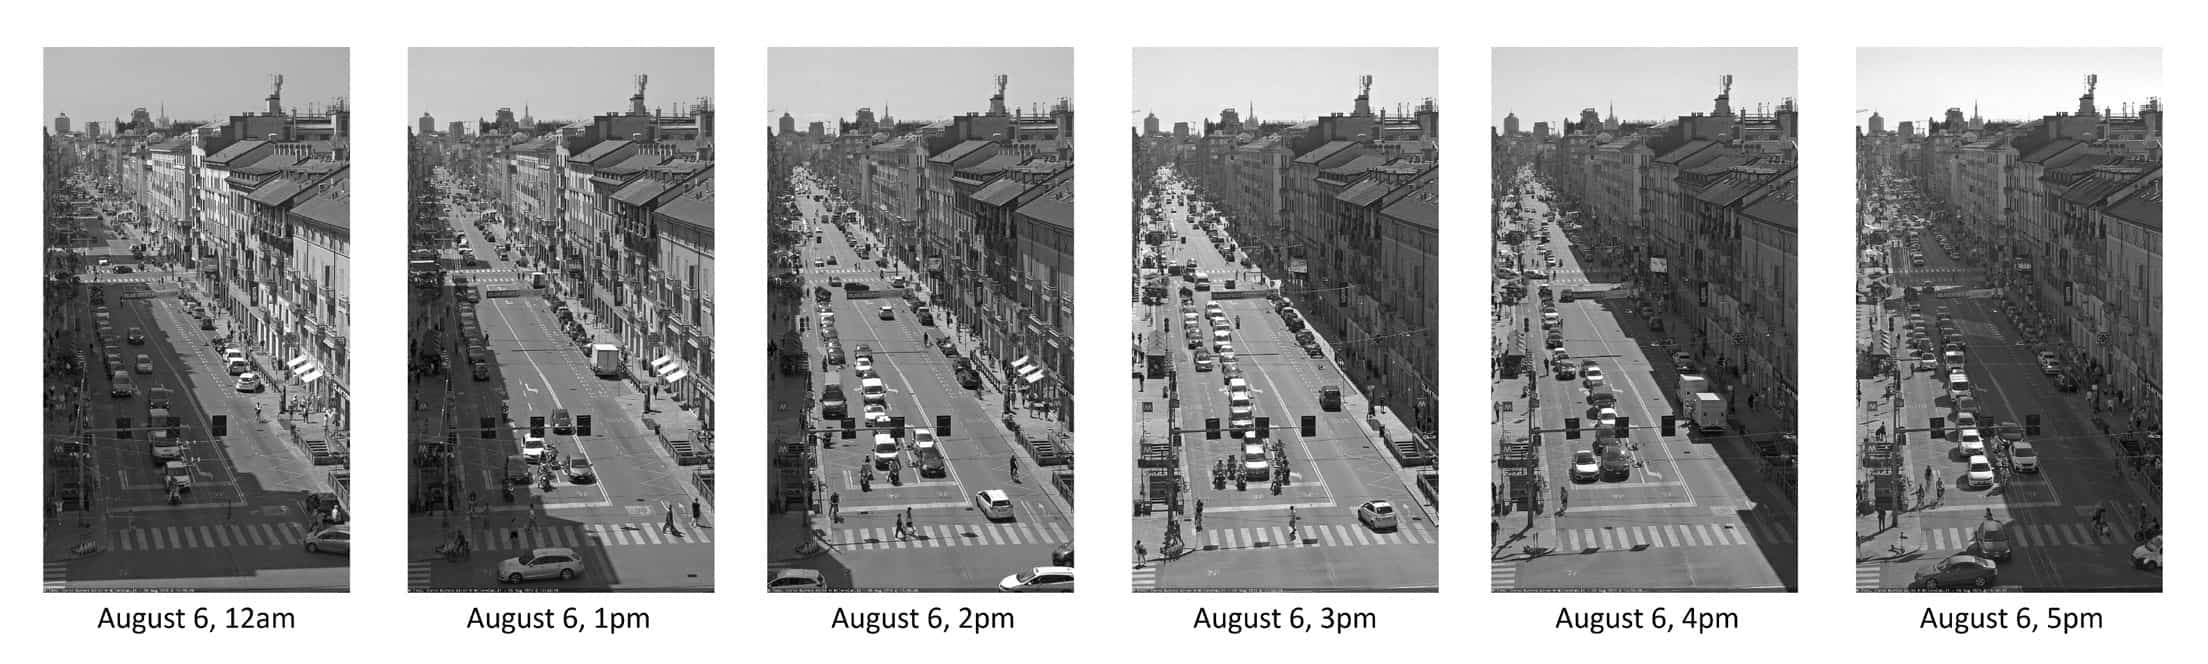
Images showing shading conditions in Corso Buenos Aires on August 6th, 2021
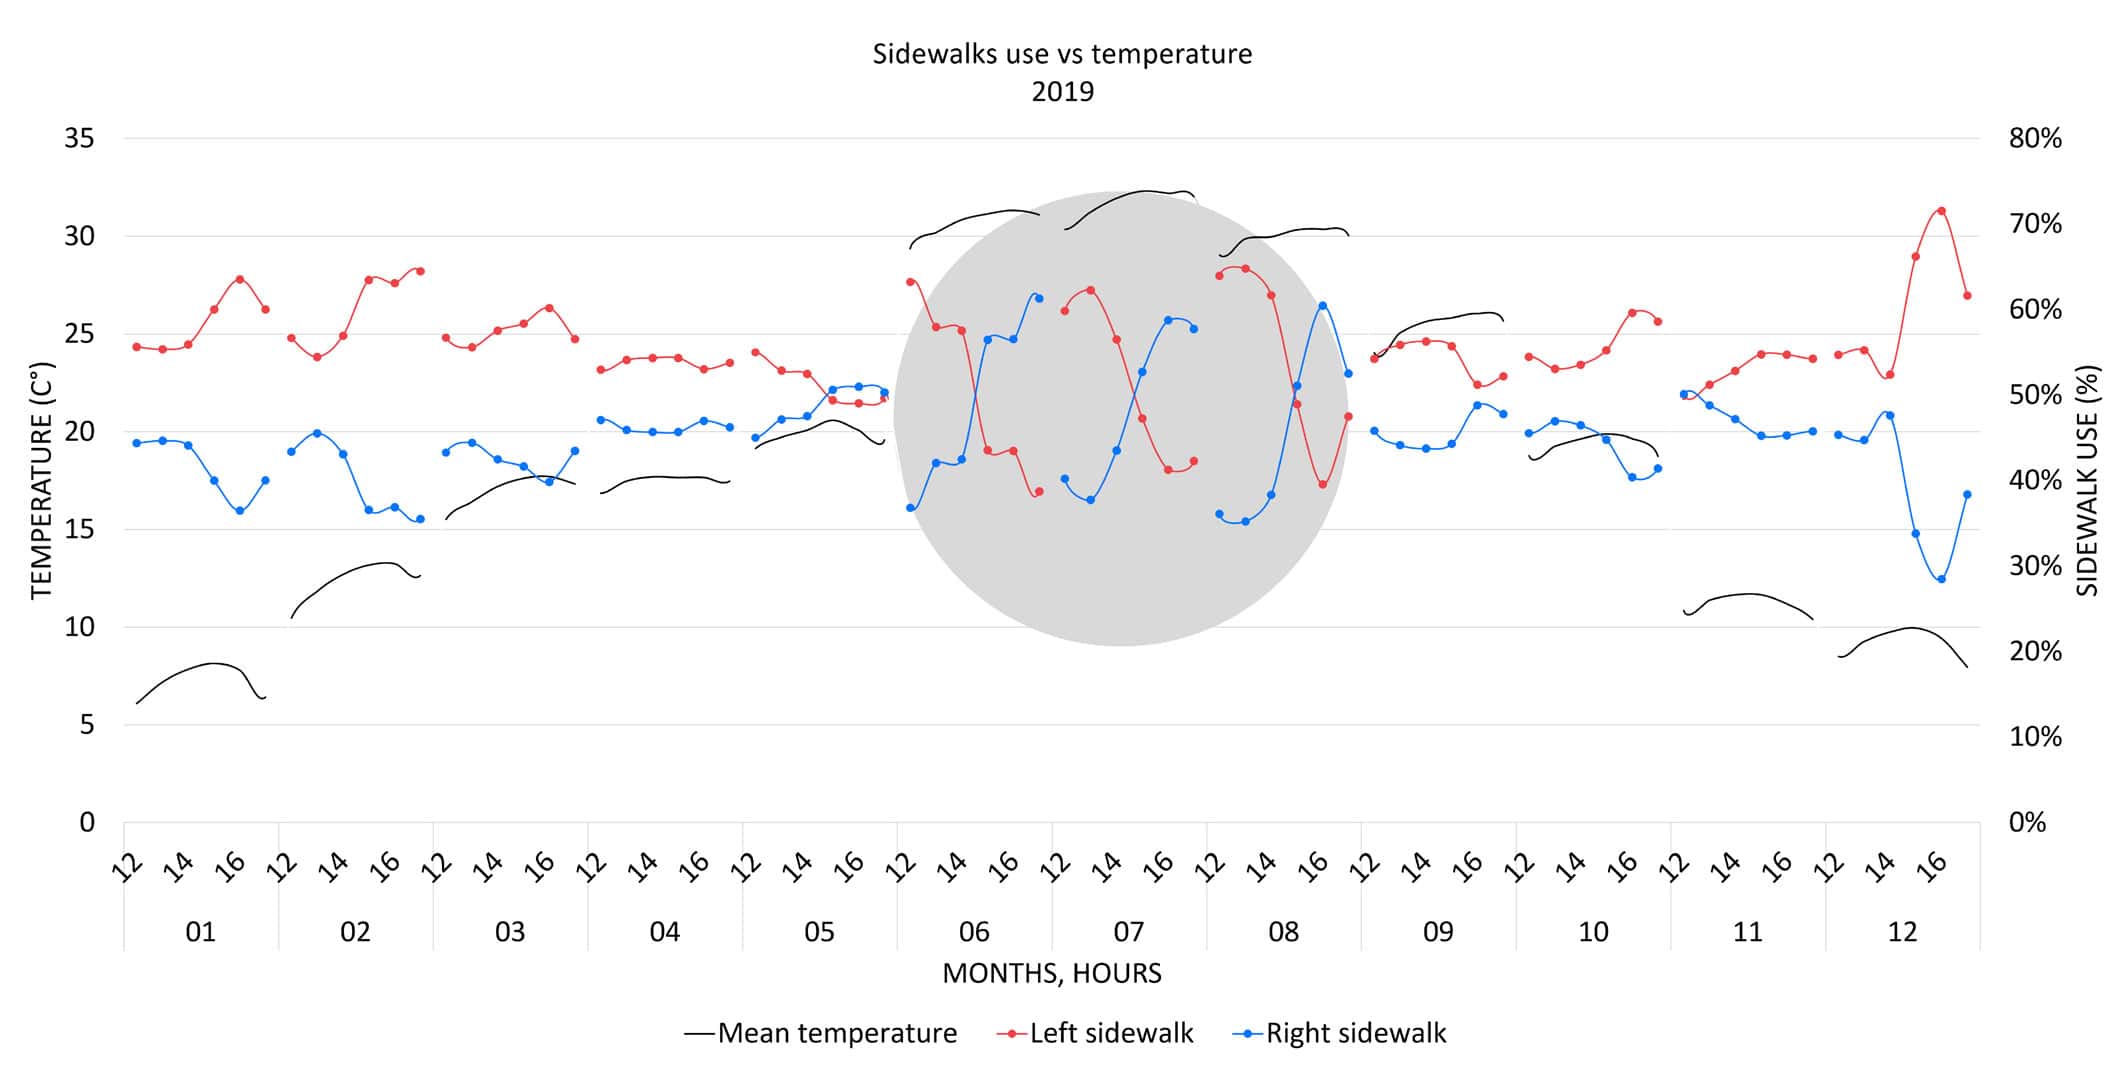
In this phase, images were masked to detect pedestrians on the sidewalk of interest. Then, the share of pedestrians for each sidewalk was computed to obtain a comparable metric. Figure 10 outlines trends in sidewalk choice in 2019, depicting the average monthly share of pedestrians per sidewalk and the mean detected temperature. While a general preference for the left sidewalk can be observed, curves abruptly change between 2 and 3 pm in summer months with temperatures above 30° Celsius. These patterns are consistent with 2020 ones, proving potential for further analyses (see Figure 11).
Analysis of shading conditions in Corso Buenos Aires on August 6th, 2021

Sidewalk patterns, Pedestrians, May – September, 2019 – 2020
Conclusions and Future Research
This research aims at studying different methods to identify and count objects in images. The goal is to understand the potential of each method with available pre-trained weights. Then, the purpose is to analyse the street use of Corso Buenos Aires by means of ongoing studies.
The evolution in results obtained between the first steps and phase three highlight possibilities in development of new applications and studies involving image datasets. In fact, while models that were trained on broad scope datasets, i.e., COCO (Lin et al., 2014) would lead to modest results for small instances (i.e., pedestrians and cyclists), results showed a great improvement using a model specifically trained on the classes of interest (i.e., vehicles, pedestrians, cyclists) and on images with similar orientation. Further improvements could be obtained through data augmentation, limiting the effects of meteorological factors on images quality, and by fine-tuning the open-source models.
In general, the methodology proves to be time and cost-efficient with respect to the level of accuracy and details inferred while guaranteeing the privacy of individuals (Bernas et al., 2018). The use of an extensive dataset led to statistically significant results on aggregated temporal periods, overcoming the uncertainties of a single image. Furthermore, it gives the possibility to detect meaningful moments to be further analyzed by means of video analytics.
Future works include the growing integration of modelling outputs with real data, the replication and forecast of complex pedestrian patterns at both urban district and city levels, integrating multiple datasets and deepening the study on pedestrian comfort in different environmental conditions. An example is represented by the usage of this information and other data from different sources (wi-fi hot spots, mobile and telco data, etc.) to implement innovative predictive models able to replicate and forecast complex pedestrian flow patterns at both urban district and city levels, as implemented in the city of Melbourne (City of Melbourne, 2021) and in the city of Liverpool, Australia (Barthélemy et al., 2019).
Acknowledgments
The analyzed data were treated according to the GDPR-General Data Protection Regulation (EU, 2016/679). This research received no specific grant from any funding agency in the public, commercial, or not-for-profit sectors.
References and Online Sources
Barthélemy, J., Verstaevel, N., Forehead, H., & Perez, P. (2019). Edge-Computing Video Analytics for Real-Time Traffic Monitoring in a Smart City. Sensors, 19(9), 2048. https://doi.org/10.3390/s19092048
Bernas, M., Płaczek, B., Korski, W., Loska, P., Smyła, J., & Szymała, P. (2018). A Survey and Comparison of Low-Cost Sensing Technologies for Road Traffic Monitoring. Sensors, 18(10), 3243. https://doi.org/10.3390/s18103243
City of Melbourne (2021). Pedestrian Counting System. Available at: https://www.melbourne.vic.gov.au/about-melbourne/research-and-statistics/city-population/Pages/pedestrian-counting-system.aspx
City of Montreal (2021). Annotated images taken from the video stream of traffic cameras. Information Technology Department. Available at: https://donnees.montreal.ca/ville-de-montreal/images-annotees-cameras-circulation
Espitia, E., Gorrini, A., Vacca, A., Deponte, D., Sarvi, M. (2022). How Covid-19 is Affecting Pedestrian Modelling and Simulation: The Case of Venice. Transportation Research Record. https://doi.org/10.1177/03611981221088224
Joint Research Centre (2019). The future of cities: opportunities, challenges and the way forward. European Commission Publications Office. https://data.europa.eu/doi/10.2760/375209
Geospatial Commission (2020). Unlocking the power of location. The UK’s Geospatial Strategy, 2020 to 2025. Cabinet Office. Available at: https://www.gov.uk/government/publications/unlocking-the-power-of-locationthe-uks-geospatial-strategy/unlocking-the-power-of-location-the-uks-geospatial-strategy-2020-to-2025
Gutta, S. (2021). Object Detection Algorithm — YOLO v5 Architecture. Medium. Available at: https://medium.com/analytics-vidhya/object-detection-algorithm-yolo-v5-architecture-89e0a35472ef
Jocher, G., Chaurasia, A., Stoken, A., et al. (2021). ultralytics/yolov5: v5.0 – YOLOv5-P6 1280 models, AWS, Supervise.ly and YouTube integrations (v5.0). Zenodo. https://doi.org/10.5281/zenodo.4679653
Lin, T., Maire, M., Belongie, S.J., Hays, J., Perona, P., Ramanan, D., Dollár, P., & Zitnick, C.L. (2014). Microsoft COCO: Common Objects in Context. ECCV. https://doi.org/10.48550/arXiv.1405.0312
Transform Transport (2018). Re-imagining Corso Buenos Aires. Systematica Srl. Available at: https://research.systematica.net/research/re-imagining-corso-buenos-aires/
Zhao, Z., Zheng, P., Xu, S., & Wu, X. (2019). Object Detection With Deep Learning: A Review. IEEE Transactions on Neural Networks and Learning Systems, 30, 3212-3232. https://doi.org/10.48550/arXiv.1807.05511