
This article presents a research project conducted by Transform Transport in collaboration with Laboratorio Roma050, focusing on sustainable mobility metrics in the Metropolitan City of Roma Capitale. The project leverages advanced methodologies to collect and analyze open urban mobility data and services data. Three core metrics were computed: the 15-Minute City Score (15m CS) for pedestrian accessibility to local services, the Public Transport Opportunity Level (PTOL) for pedestrian accessibility to transit stops, and the Bicycle Level of Traffic Stress (LTS) for evaluating cyclist stress based on cycling infrastructure. Results allowed to: (i) assess multimodal accessibility through GIS mapping; (ii) identify high-priority areas for walking, cycling, and public transport interventions; and (iii) develop an analytical framework to support mobility planning and monitoring.
Introduction
From August 2024 to February 2025 Transform Transport and Laboratorio Roma050 conducted a study on sustainable mobility in the Metropolitan City of Roma Capitale. Starting from the principles highlighted in the metropolitan SUMP-Sustainable Urban Mobility Plan approved in December 2024, the goal of this research project was to quantify urban mobility options and opportunities, supporting the development of a more accessible and inclusive city.
The coordinator of the research project, Laboratorio Roma050, aims to envision and shape the future of Rome by addressing key challenges such as ecological transition and social inequalities, proximity urbanism and housing issues, digital transformation, including AI-driven urban solutions, as well as social, demographic, economic, and environmental changes. This vision is rooted in the diverse characteristics of Rome’s neighborhoods, considering their social dynamics, historical heritage, and geographic specificities.
The development of a more accessible and inclusive city was supported by analyzing sustainable mobility options under three lenses: walkability, public transport accessibility and cyclability. Walkability in terms of neighborhood services proximity has been assessed in many cities by examining the distribution of the accessibility to essential services (Hall & Ram, 2018). In particular, the concept of the 15 minute city (Moreno et al., 2021) defines a timeframe of 15 minutes of walking or cycling to access the essential services (Abdelfattah et al., 2022; Abdelfattah et al., 2025).
Accessibility to public transport options, as part of the broader definition of Transport Poverty (Cludius et al., 2024), has been brought up consistently in relation to policies aimed at obtaining a fair transition towards climate neutrality, as systemic challenges such as car dependence and insufficient public transport infrastructure disproportionately affect marginalized populations (EuroCities, 2024). Therefore, measuring public transport accessibility is essential for ensuring equitable mobility solutions.
Cycling is one of the main forms of sustainable and active transportation that provides health, environmental, and socio-economic benefits (Adriazola-Steil et al., 2021; Yanocha and Mawdsley, 2022). Assessing the potential stress experienced by cyclists is essential to empowering citizens to make informed choices about this mode of transport.
Within this context, three key metrics were calculated:
- 15-Minute City Score (15m CS): Assesses pedestrian accessibility to essential proximity services within a 15 minutes walk, based on the pedestrian street network;
- Public Transport Opportunity Level (PTOL): Evaluates accessibility to public transport stops by measuring the network’s coverage and density;
- Bicycle Level of Traffic Stress (LTS): Estimates the level of stress experienced by cyclists based on the quality and safety of cycling infrastructure.
These metrics are calculated using the H3 hexagonal grid, a hierarchical geospatial indexing system developed by Uber, enabling precise urban mobility analysis and mapping.
The three metrics enable the quantification and precise localization of accessibility and mobility gaps across the territory of the City of Rome, providing Laboratorio Roma050 with a robust, data-driven methodology to inform its 2050 vision plan. Results allowed to support the activities of Laboratorio Roma050 by: (i) assess multimodal accessibility through GIS mapping; (ii) identify high-priority areas for walking, cycling, and public transport interventions; and (iii) develop an analytical framework to support mobility planning and monitoring.
Enabling Data and Methodology
This section outlines the input data and methodological approach used to compute three key metrics: the 15-Minute City Score (15m CS), the Public Transport Opportunity Level (PTOL), and the Bicycle Level of Traffic Stress (LTS). The three metrics rely on open-source methodologies and data, supporting transparency and reproducibility. OpenStreetMap (OSM), a collaborative and freely available map database, serves as the main source for pedestrian and cycling networks and amenity locations. However, the use of open-source data also presents certain limitations, particularly in terms of coverage consistency and data accuracy across different areas.
All three metrics were calculated or aggregated using an H3 hexagonal grid at resolution level 10. The study area, the Metropolitan City of Rome, is divided into 332,813 hexagonal cells, each with a side length of 75.86 meters and an average area of 0.015 km². This spatial unit provides a consistent framework for comparing accessibility, public transport availability, and cycling conditions across the city.
15-Minute City Score
The 15-Minute City Score (15m CS) is based on a hexagonal grid covering the study area, with each hexagon representing a unit for accessibility analysis (Albashir et al., 2024). Using the 15-Minute City Score Toolkit developed by Transform Transport (Albashir et al., 2024), service location data is extracted from OpenStreetMap (OSM) and classified into the following eight macro categories: (i) Neighborhood Services; (ii) Healthcare; (iii) Local Shops; (iv) Education; (v) Sports; (vi) Entertainment; (vii) Leisure; and (viii) Mobility.
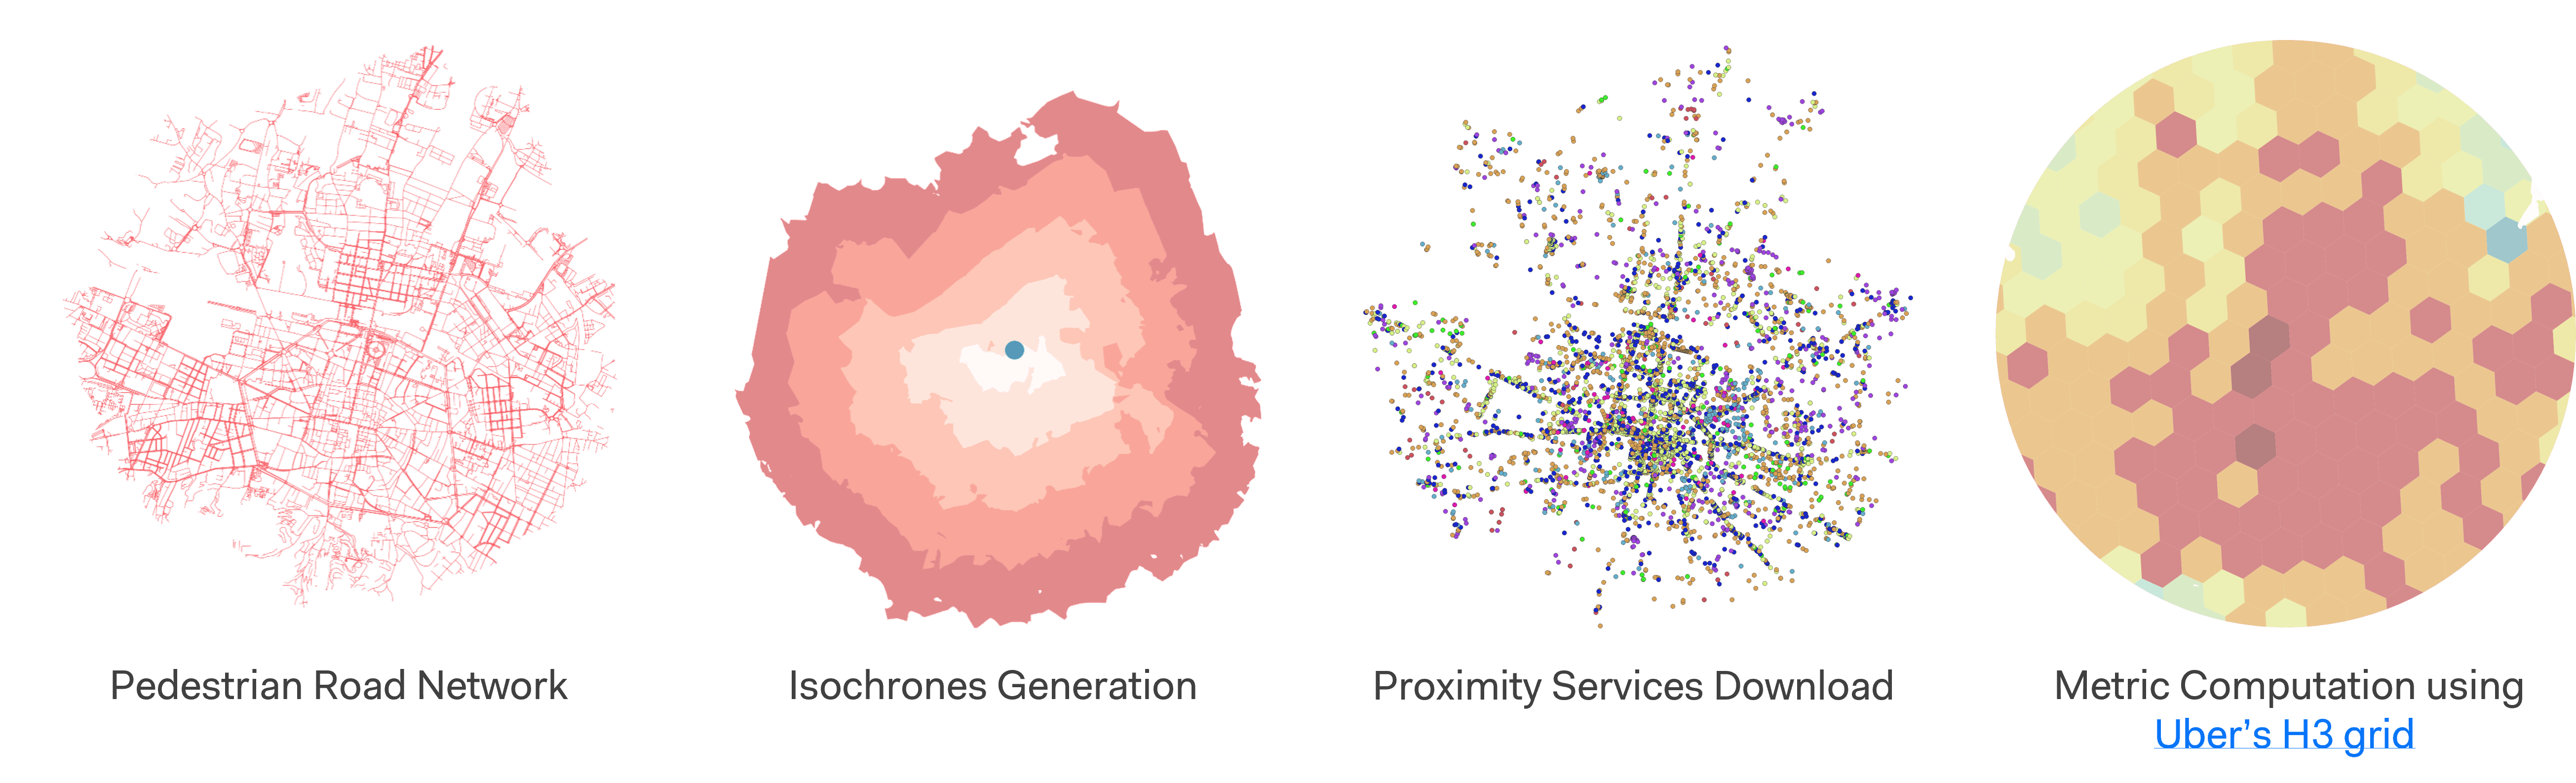
To assess the accessibility of proximity services within a 15 minute walking radius, the following methodology is applied (see Figure 1):
- Pedestrian Network Extraction: The pedestrian network is derived from OpenStreetMap to estimate walking times to nearby services;
- Generation of a 15 minute Walking Isochrone: A 15 minute pedestrian isochrone is generated from the centroid of each hexagonal grid cell;
- Extraction and Categorization of Points of Interest: Points of interest (POIs) are extracted from OpenStreetMap and classified into eight macro categories;
- Service Location Identification and Weight Assignment: The nearest service within each macro category is identified. Weights are assigned to each category based on the walking distance from the centroid of the hexagonal cell;
- Calculation of the 15-Minute City Score: The weights of all eight service categories are summed within each hexagonal cell, producing the final 15-Minute City Score.
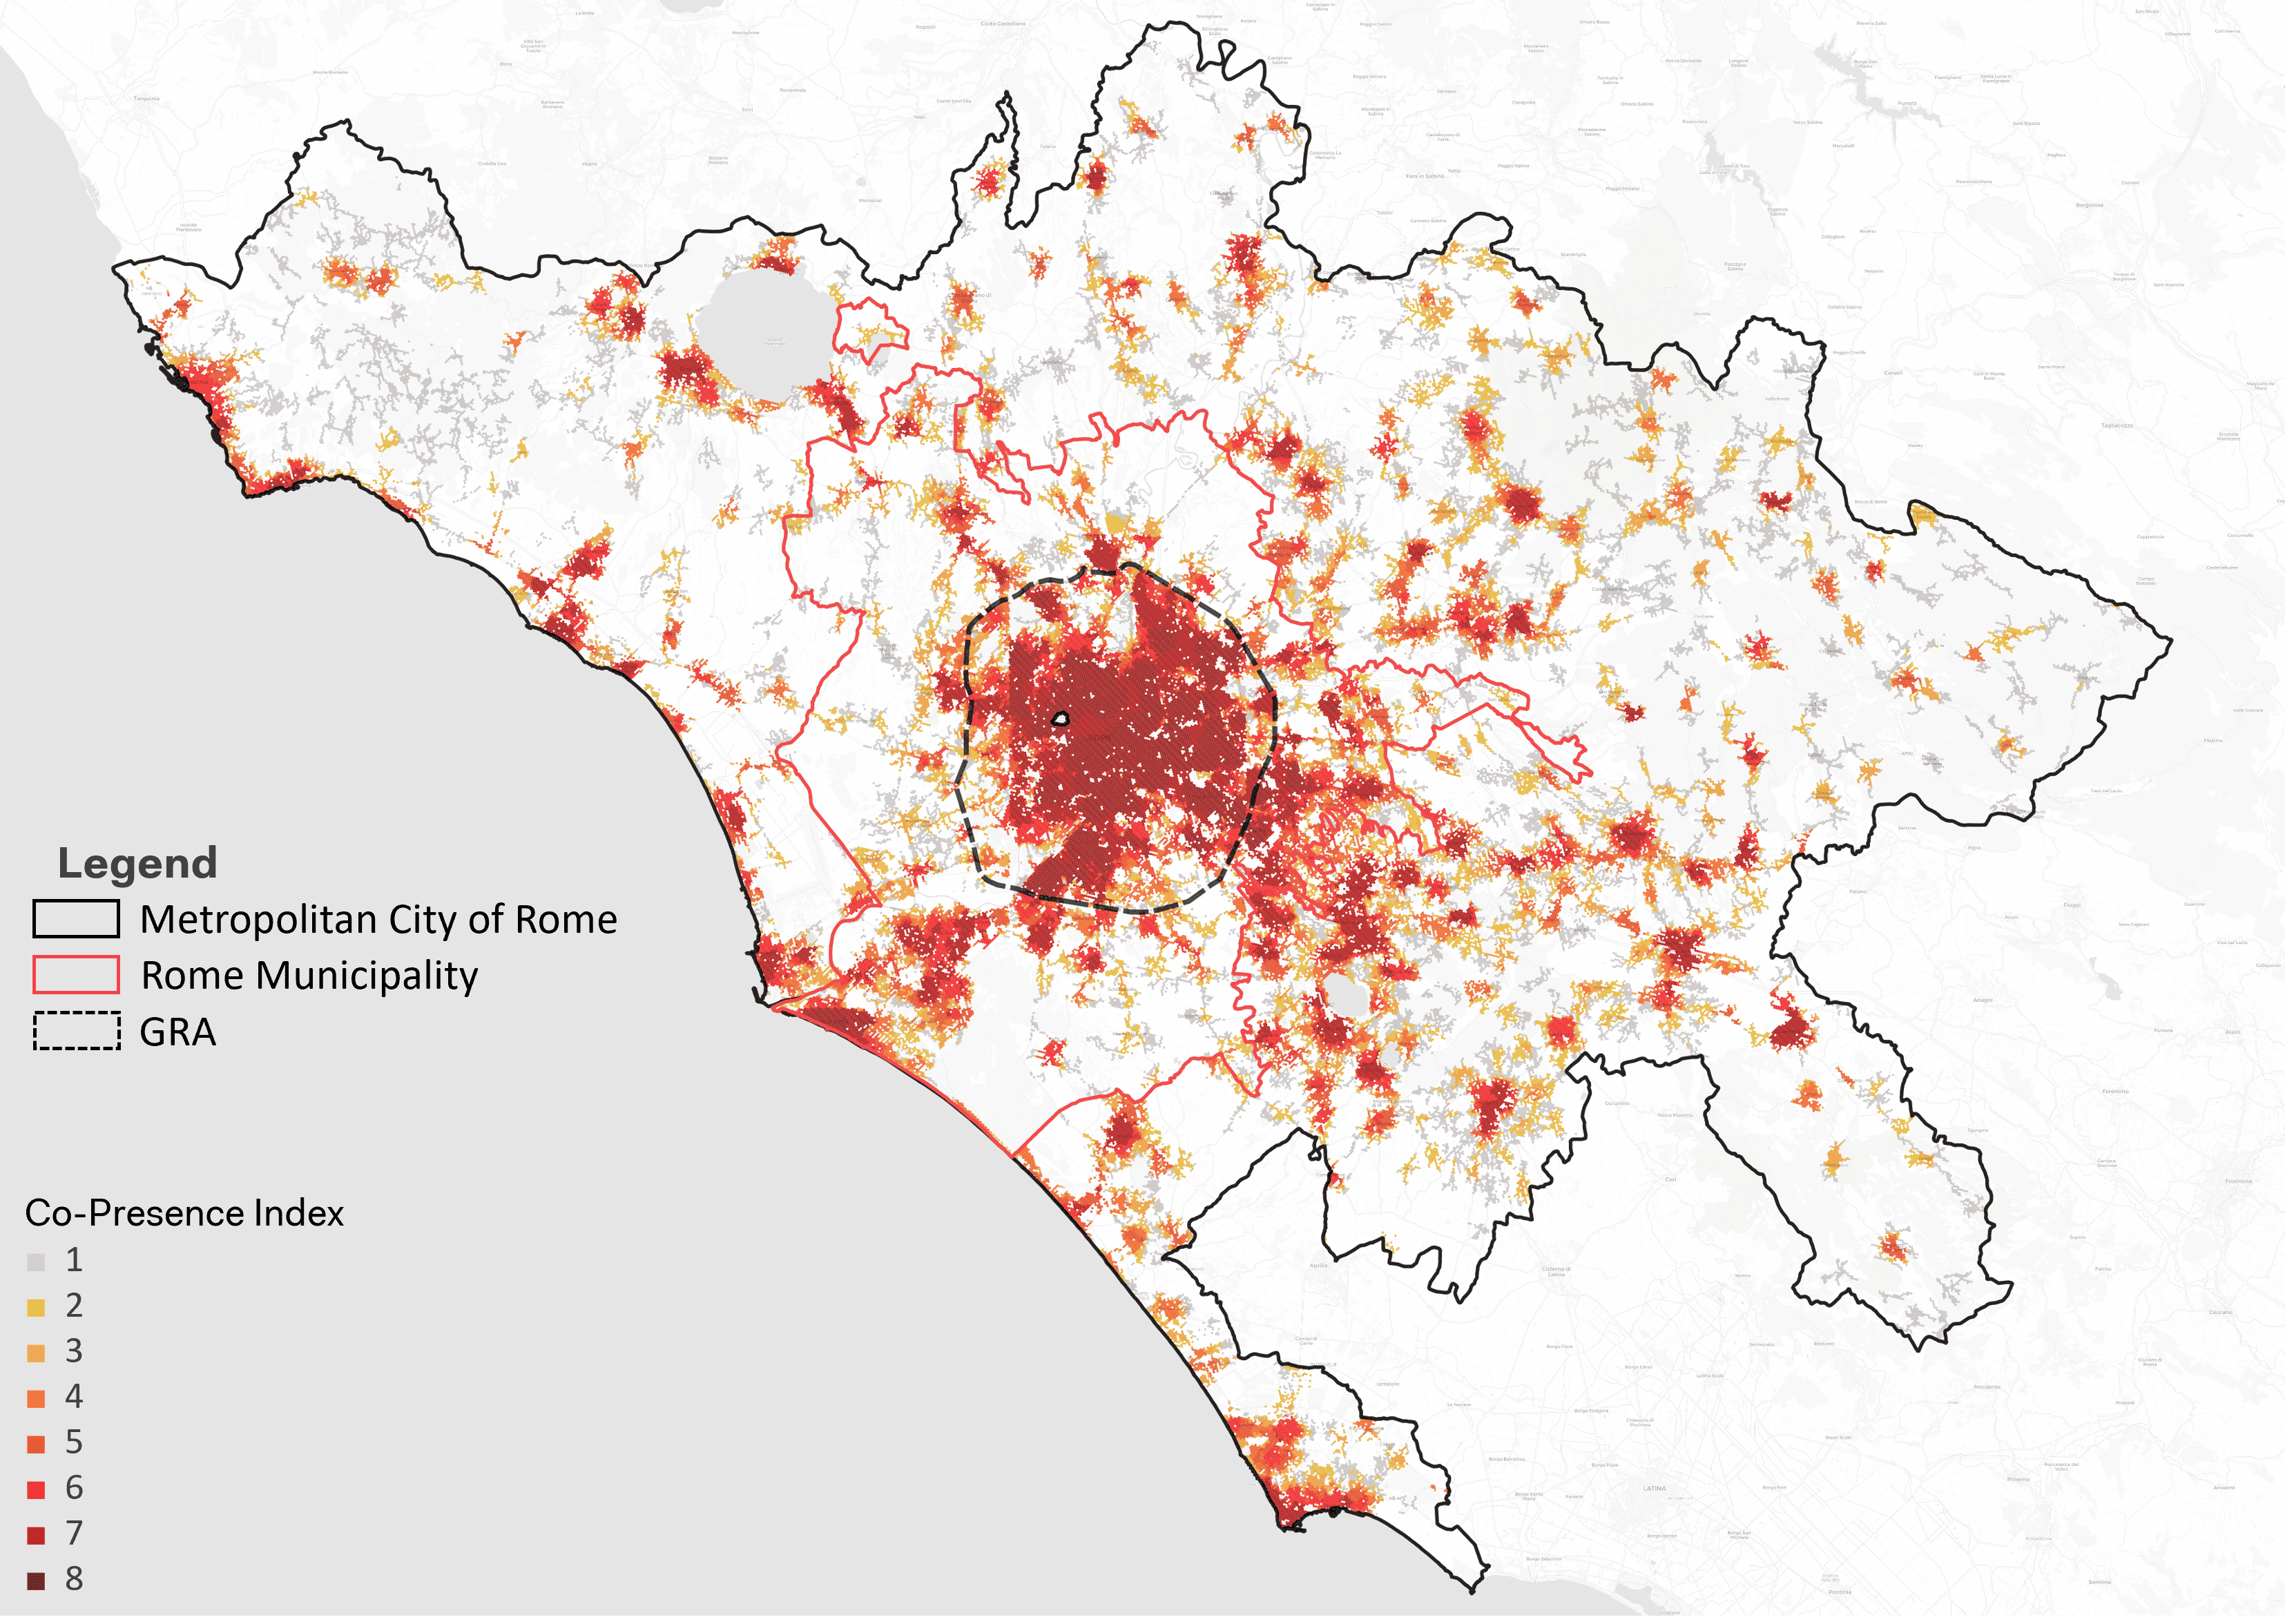
This methodology also enables the calculation of the Co-Presence Index, which ranges from 0 (i.e., no proximity services accessible within a 15 minute walk) to 8 (i.e., at least one service from each macro category accessible within 15 minutes on foot).
By accurately capturing the accessibility of essential services within a walkable distance, this approach provides a valuable measure of urban convenience and livability across different areas of the city.
Public Transport Opportunity Level
Public Transport Opportunity Level (PTOL) uses data from OpenStreetMap (OSM) for the pedestrian network and public transport stops, including buses, trams, metro stations, and railway stations. The spatial distribution of stops and the estimated pedestrian travel times to reach them are key components in the analysis. The metric is based on the Public Transport Accessibility Level (PTAL), originally developed in London in 1992 (TfL – Transport for London, 2010). However, unlike PTAL, the PTOL metric considers only pedestrian accessibility to public transport stops, omitting transport frequencies derived from GTFS data. This methodological choice allows for the rapid calculation of pedestrian accessibility to public transport stops, even in larger study areas or where GTFS data is unavailable. However, it does not account for service frequency, limiting the results to the possibility of reaching a stop rather than evaluating the quality or convenience of the service.
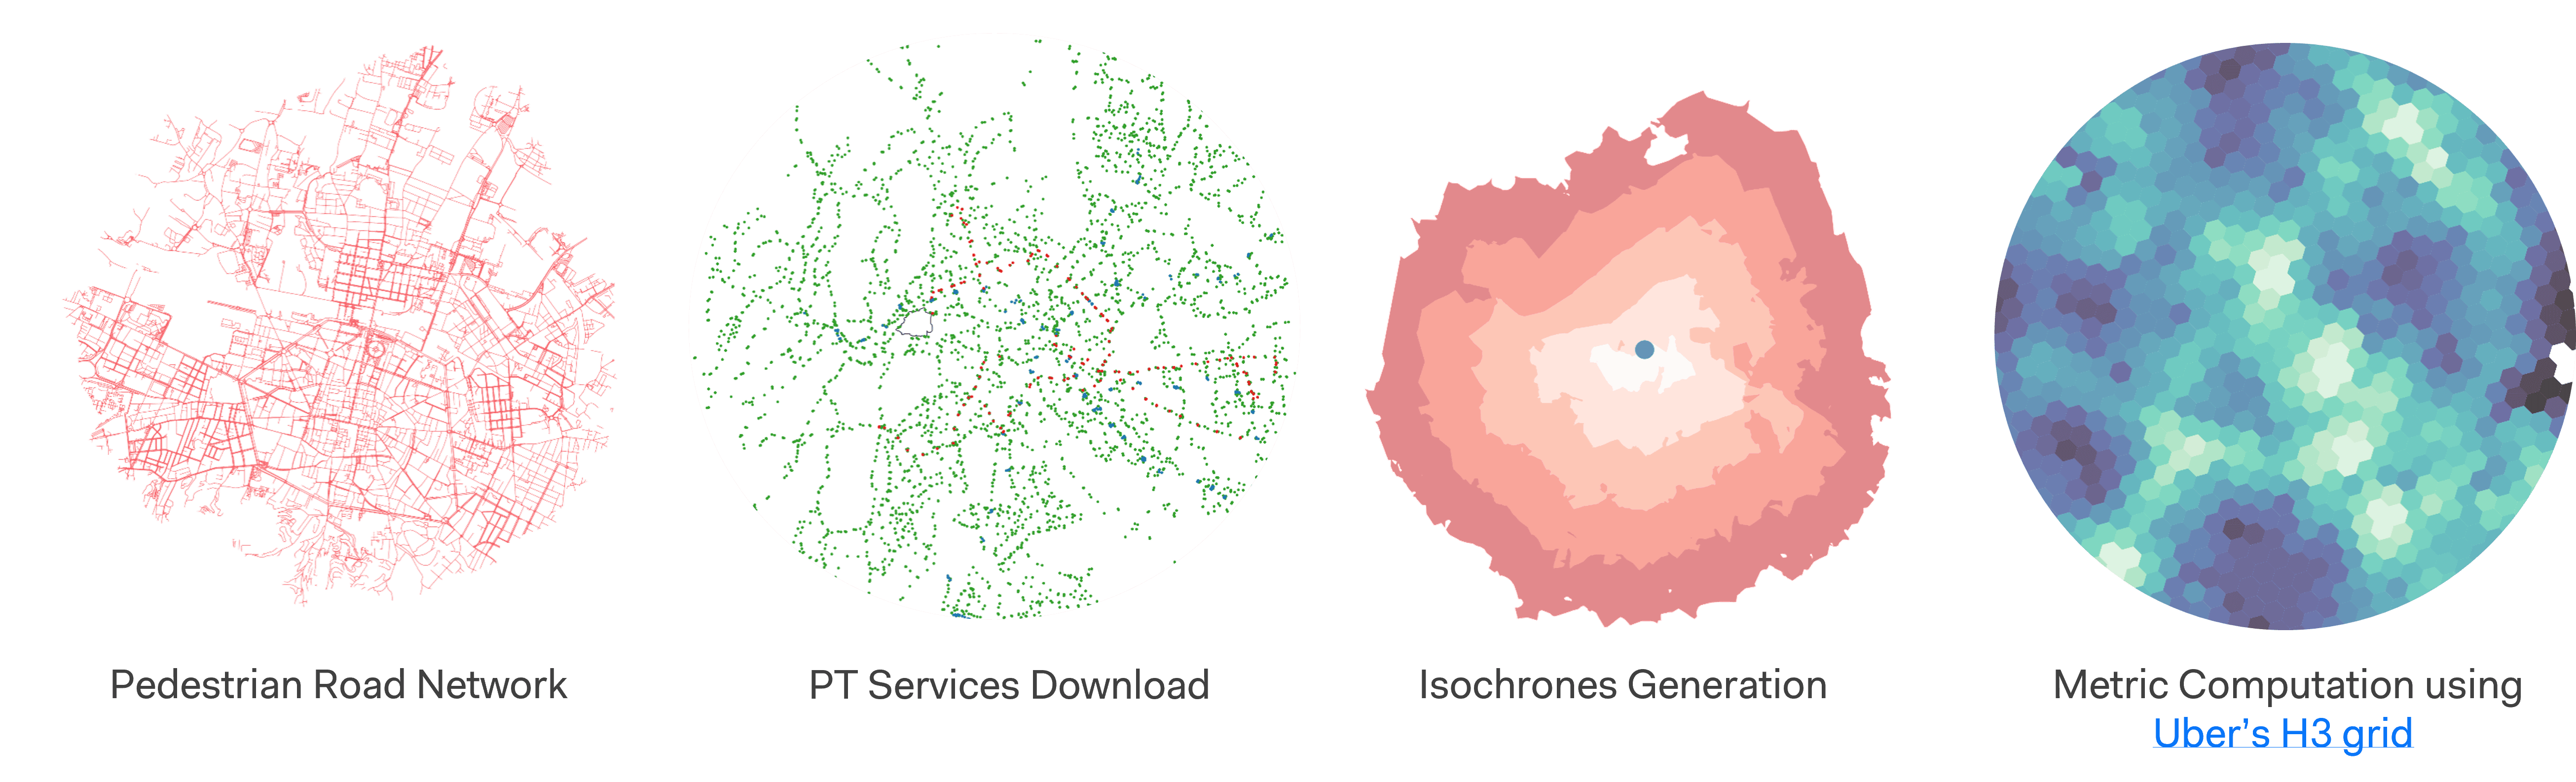
The PTOL calculation follows a five-step process (see Figure 2):
- Pedestrian Network Extraction: The pedestrian network is derived from OSM to estimate walking times to public transport stops;
- Public Transport Stop Extraction: Stops for various transport modes (bus, tram, metro, and railway) are obtained from OSM;
- Catchment Area Definition: Catchment areas are defined based on the PTAL methodology, using an 8-minute walking threshold for buses and trams and a 12-minute threshold for metro and railway stations;
- Intersection with Hexagonal Grid: The generated isochrones intersect with H3-level 10 hexagonal cells to assign accessibility levels to each area. Accessibility is determined based on the minimum walking time required to reach a transport stop for each mode of transport;
- Final PTOL Calculation: The PTOL value is computed as the sum of accessibility levels for different types of public transport within each hexagonal cell.
Bicycle Level of Traffic Stress
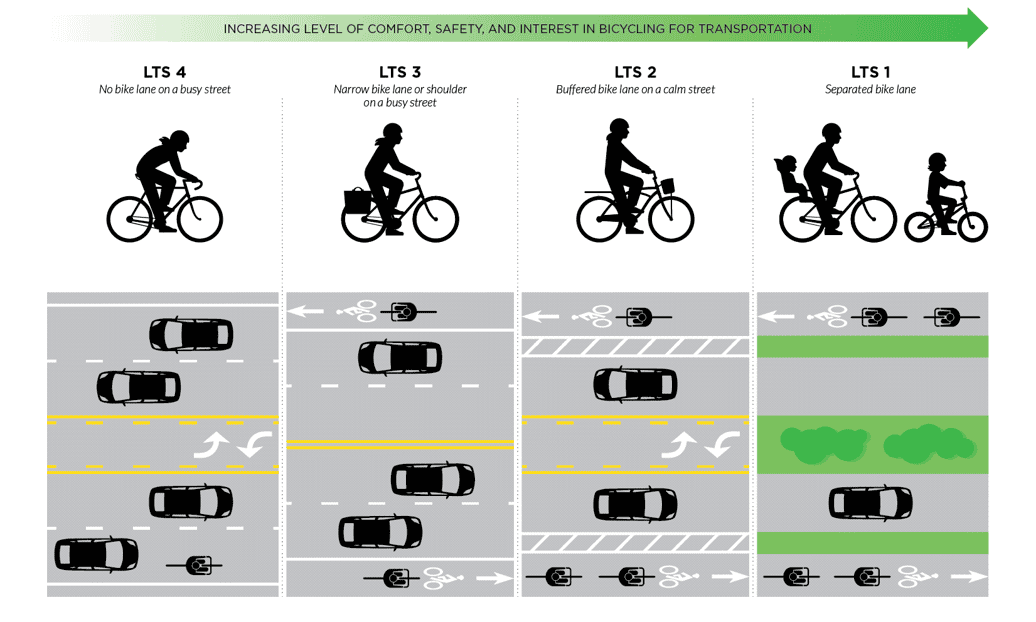
The Bicycle Level of Traffic Stress (LTS), developed by The Institute of Mineta (Furth et al., 2016), relies on OpenStreetMap (OSM) road data, which includes information on street types, number of lanes, presence of bicycle infrastructure, speed limits, intersection complexity, and parking availability. These factors contribute to the overall stress level experienced by cyclists, ranked from lowest (i.e., LTS1) to highest (i.e., LTS4) (see Figure 3) (Transform Transport, 2024). The overall metric accuracy heavily depends on the accuracy of the data source and varies locally.
The LTS assessment follows a structured four-step evaluation process:
- Separation from motor vehicles: If a cycling route is physically separated from motor vehicles, it is assigned to the lowest stress level (LTS 1). Otherwise, the assessment proceeds to the next step;
- Presence of parking and bike lanes: If there is no on-street parking and bike lanes are absent, the assessment moves to step 4. If both parking and bike lanes are present, their width and safety are evaluated to determine the LTS level;
- Bike lanes without parking: If bike lanes exist but parking is absent, their width and safety are analyzed to assign an appropriate LTS rating;
- Mixed traffic conditions: For streets without dedicated cycling infrastructure, the number of lanes and traffic speed are assessed to determine the stress level for cyclists.
Traffic stress levels are calculated for each road segment and aggregated across H3-level 10 hexagonal cells. The aggregation follows the Weighted Average Level (WAL) formula:

The WAL method accounts for the LTS values of road segments, weighted by their length and scaled according to the total street length within each hexagon. The resulting value represents the average LTS assigned to the hexagon.
This methodological approach ensures a comprehensive analysis of accessibility, public transport availability, and cycling conditions within the study area, providing an integrated perspective on urban mobility.
Results
This section presents the results of the three key metrics, 15-Minute City Score and Co-Presence Index, Public Transport Opportunity Level, and Bicycle Level of Traffic Stress, for the Metropolitan City of Roma Capitale.
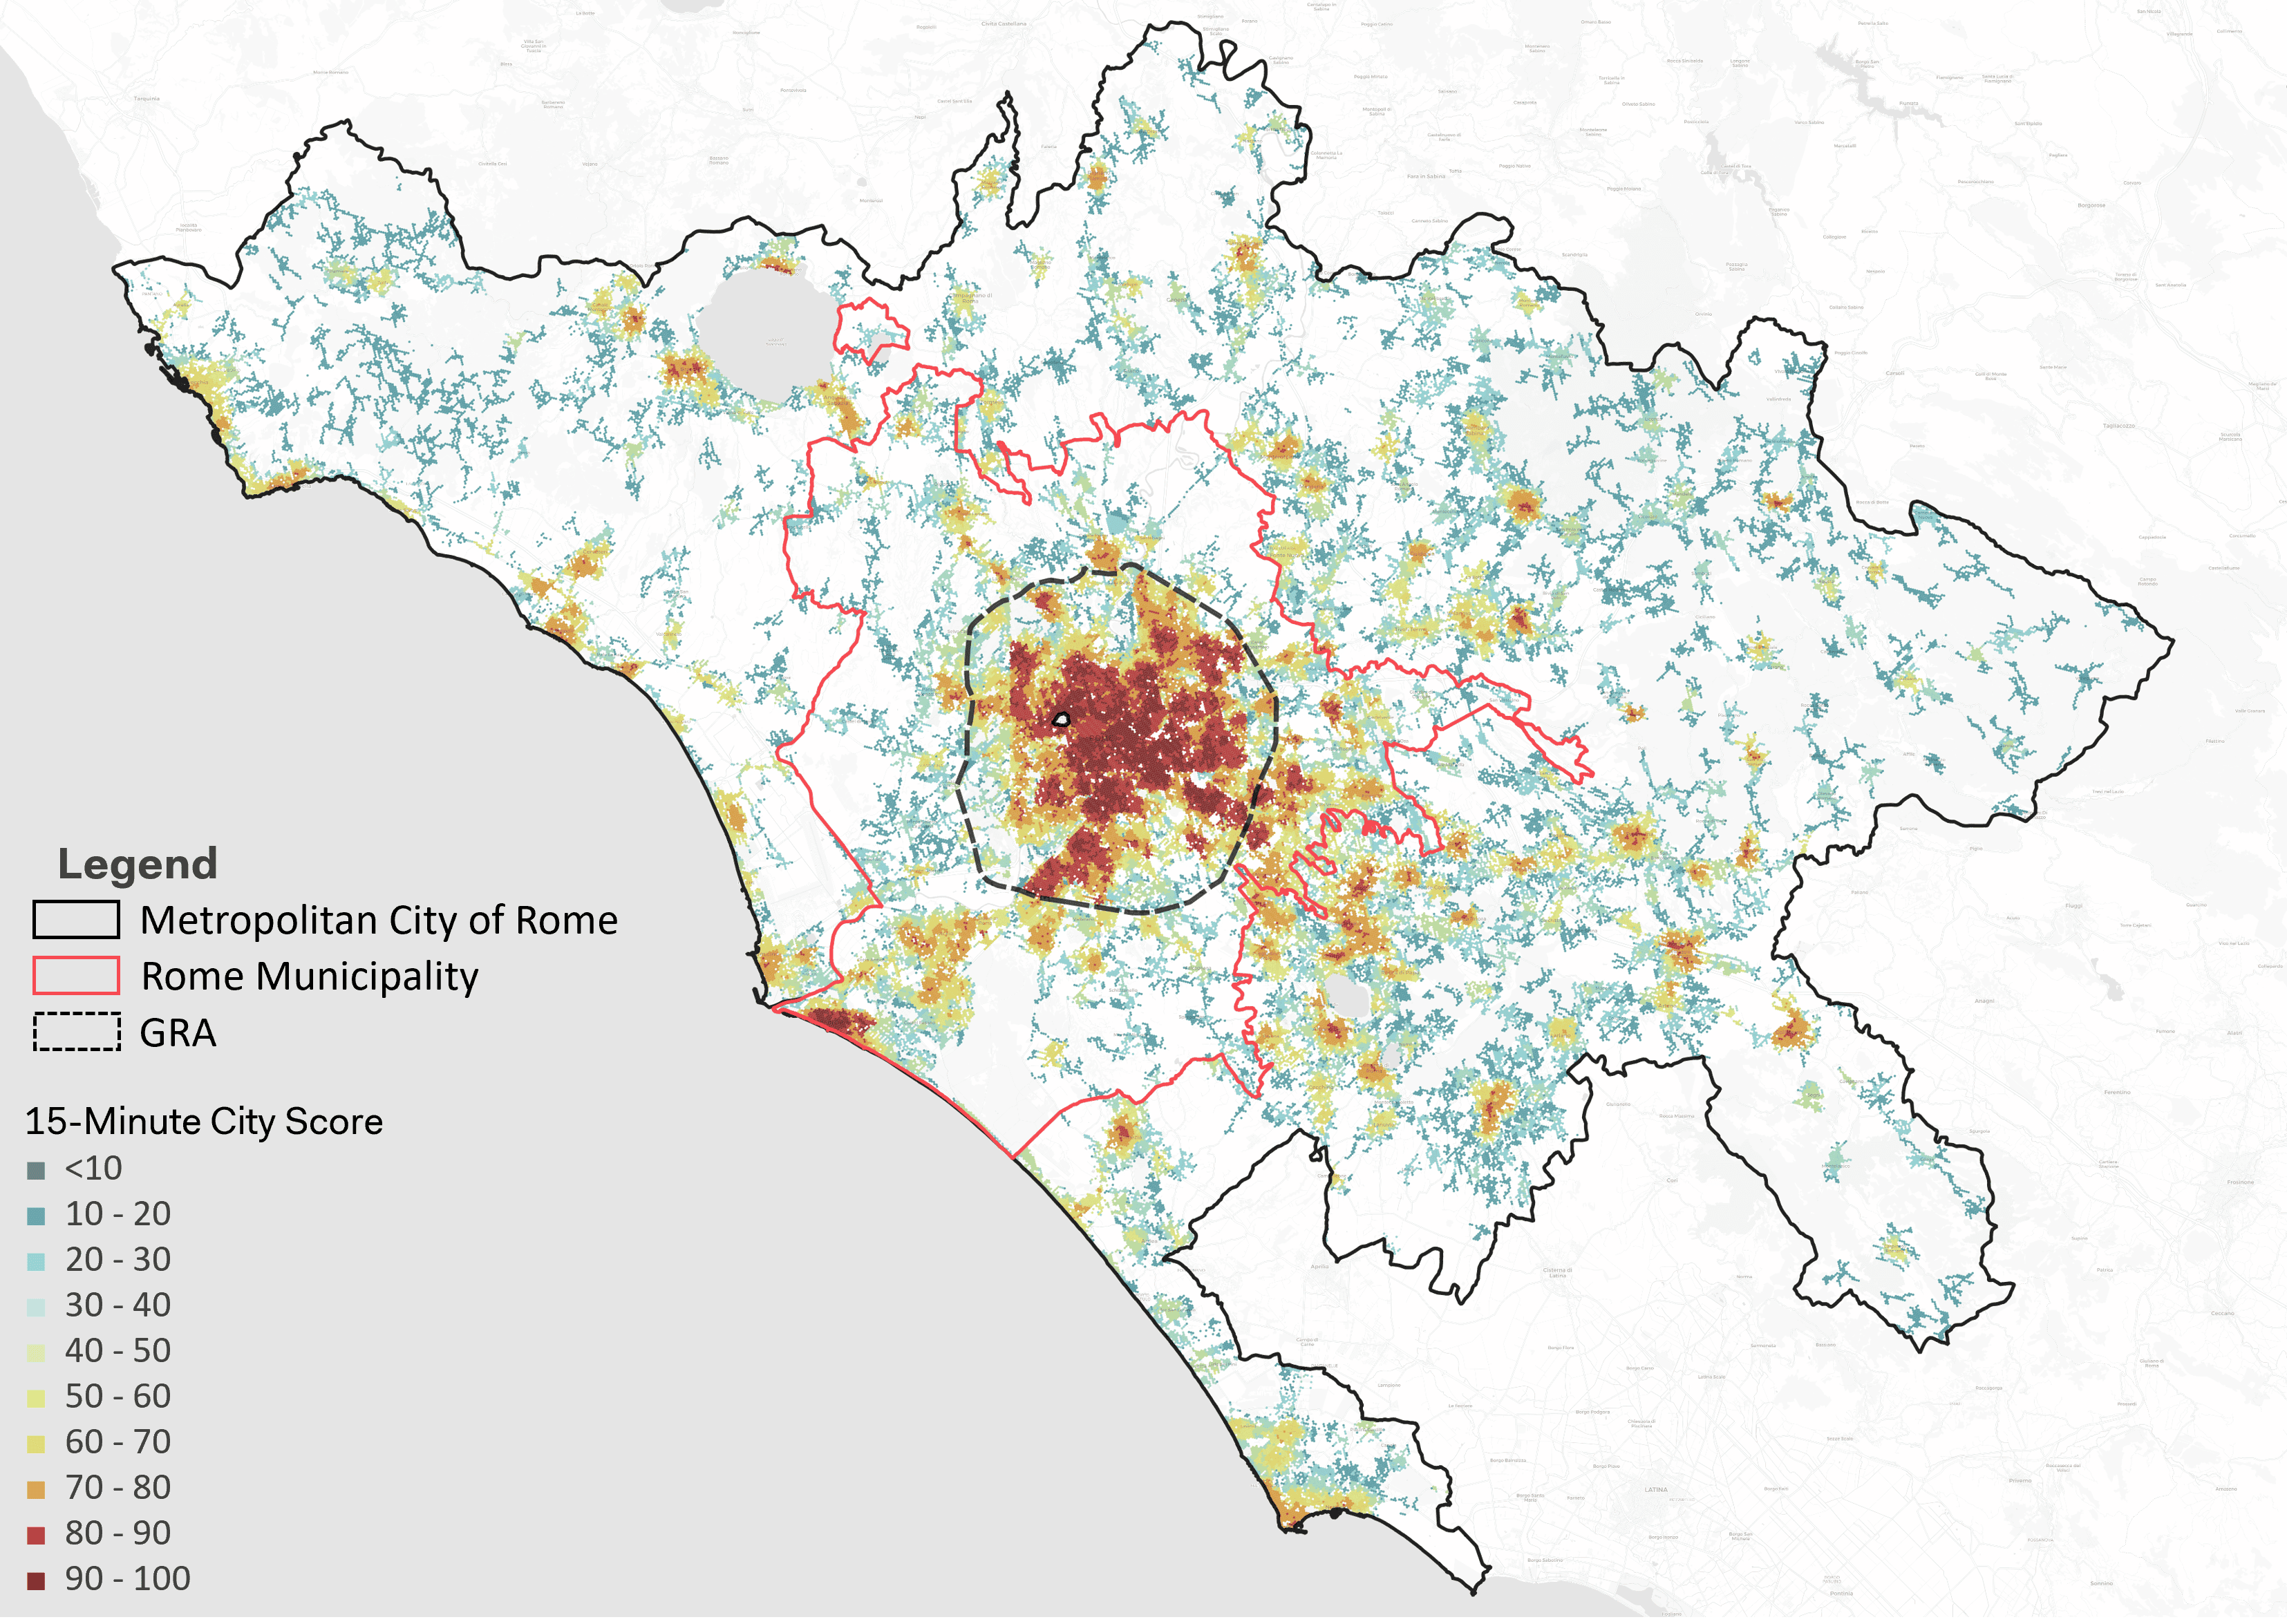
The Co-Presence Index measures the accessibility of multiple service categories within a 15 minute walk. Results range from 0 (i.e., no proximity services accessible) to 8 (i.e., at least one service from each macro category accessible). Fully serviced areas are concentrated mainly within the Grande Raccordo Anulare (i.e., GRA) and in some urban zones of the Metropolitan City of Roma (see Figure 4). The findings indicate that only 2% of the hexagonal grid cells provide access to all eight macro categories of services within 15 minutes on foot. Approximately 8% of the hexagonal grid cells provide access to just one service category.
The 15-Minute City Score (15m CS) itself ranges from 0 (i.e., no services accessible within 15 minutes) to 100 (i.e., at least one service from each macro category accessible). The analysis shows that 70% of the hexagonal grid cells are inaccessible via the pedestrian network, primarily in suburban and peripheral areas. 8% of the grid cells have a score above 70, indicating high accessibility, while 12% have a score below 30, highlighting limited access to essential services (see Figure 5). These results should be interpreted with caution, as they reflect the entire territory without accounting for population or infrastructure distribution. As such, they do not fully capture the actual demand for pedestrian accessibility to services.
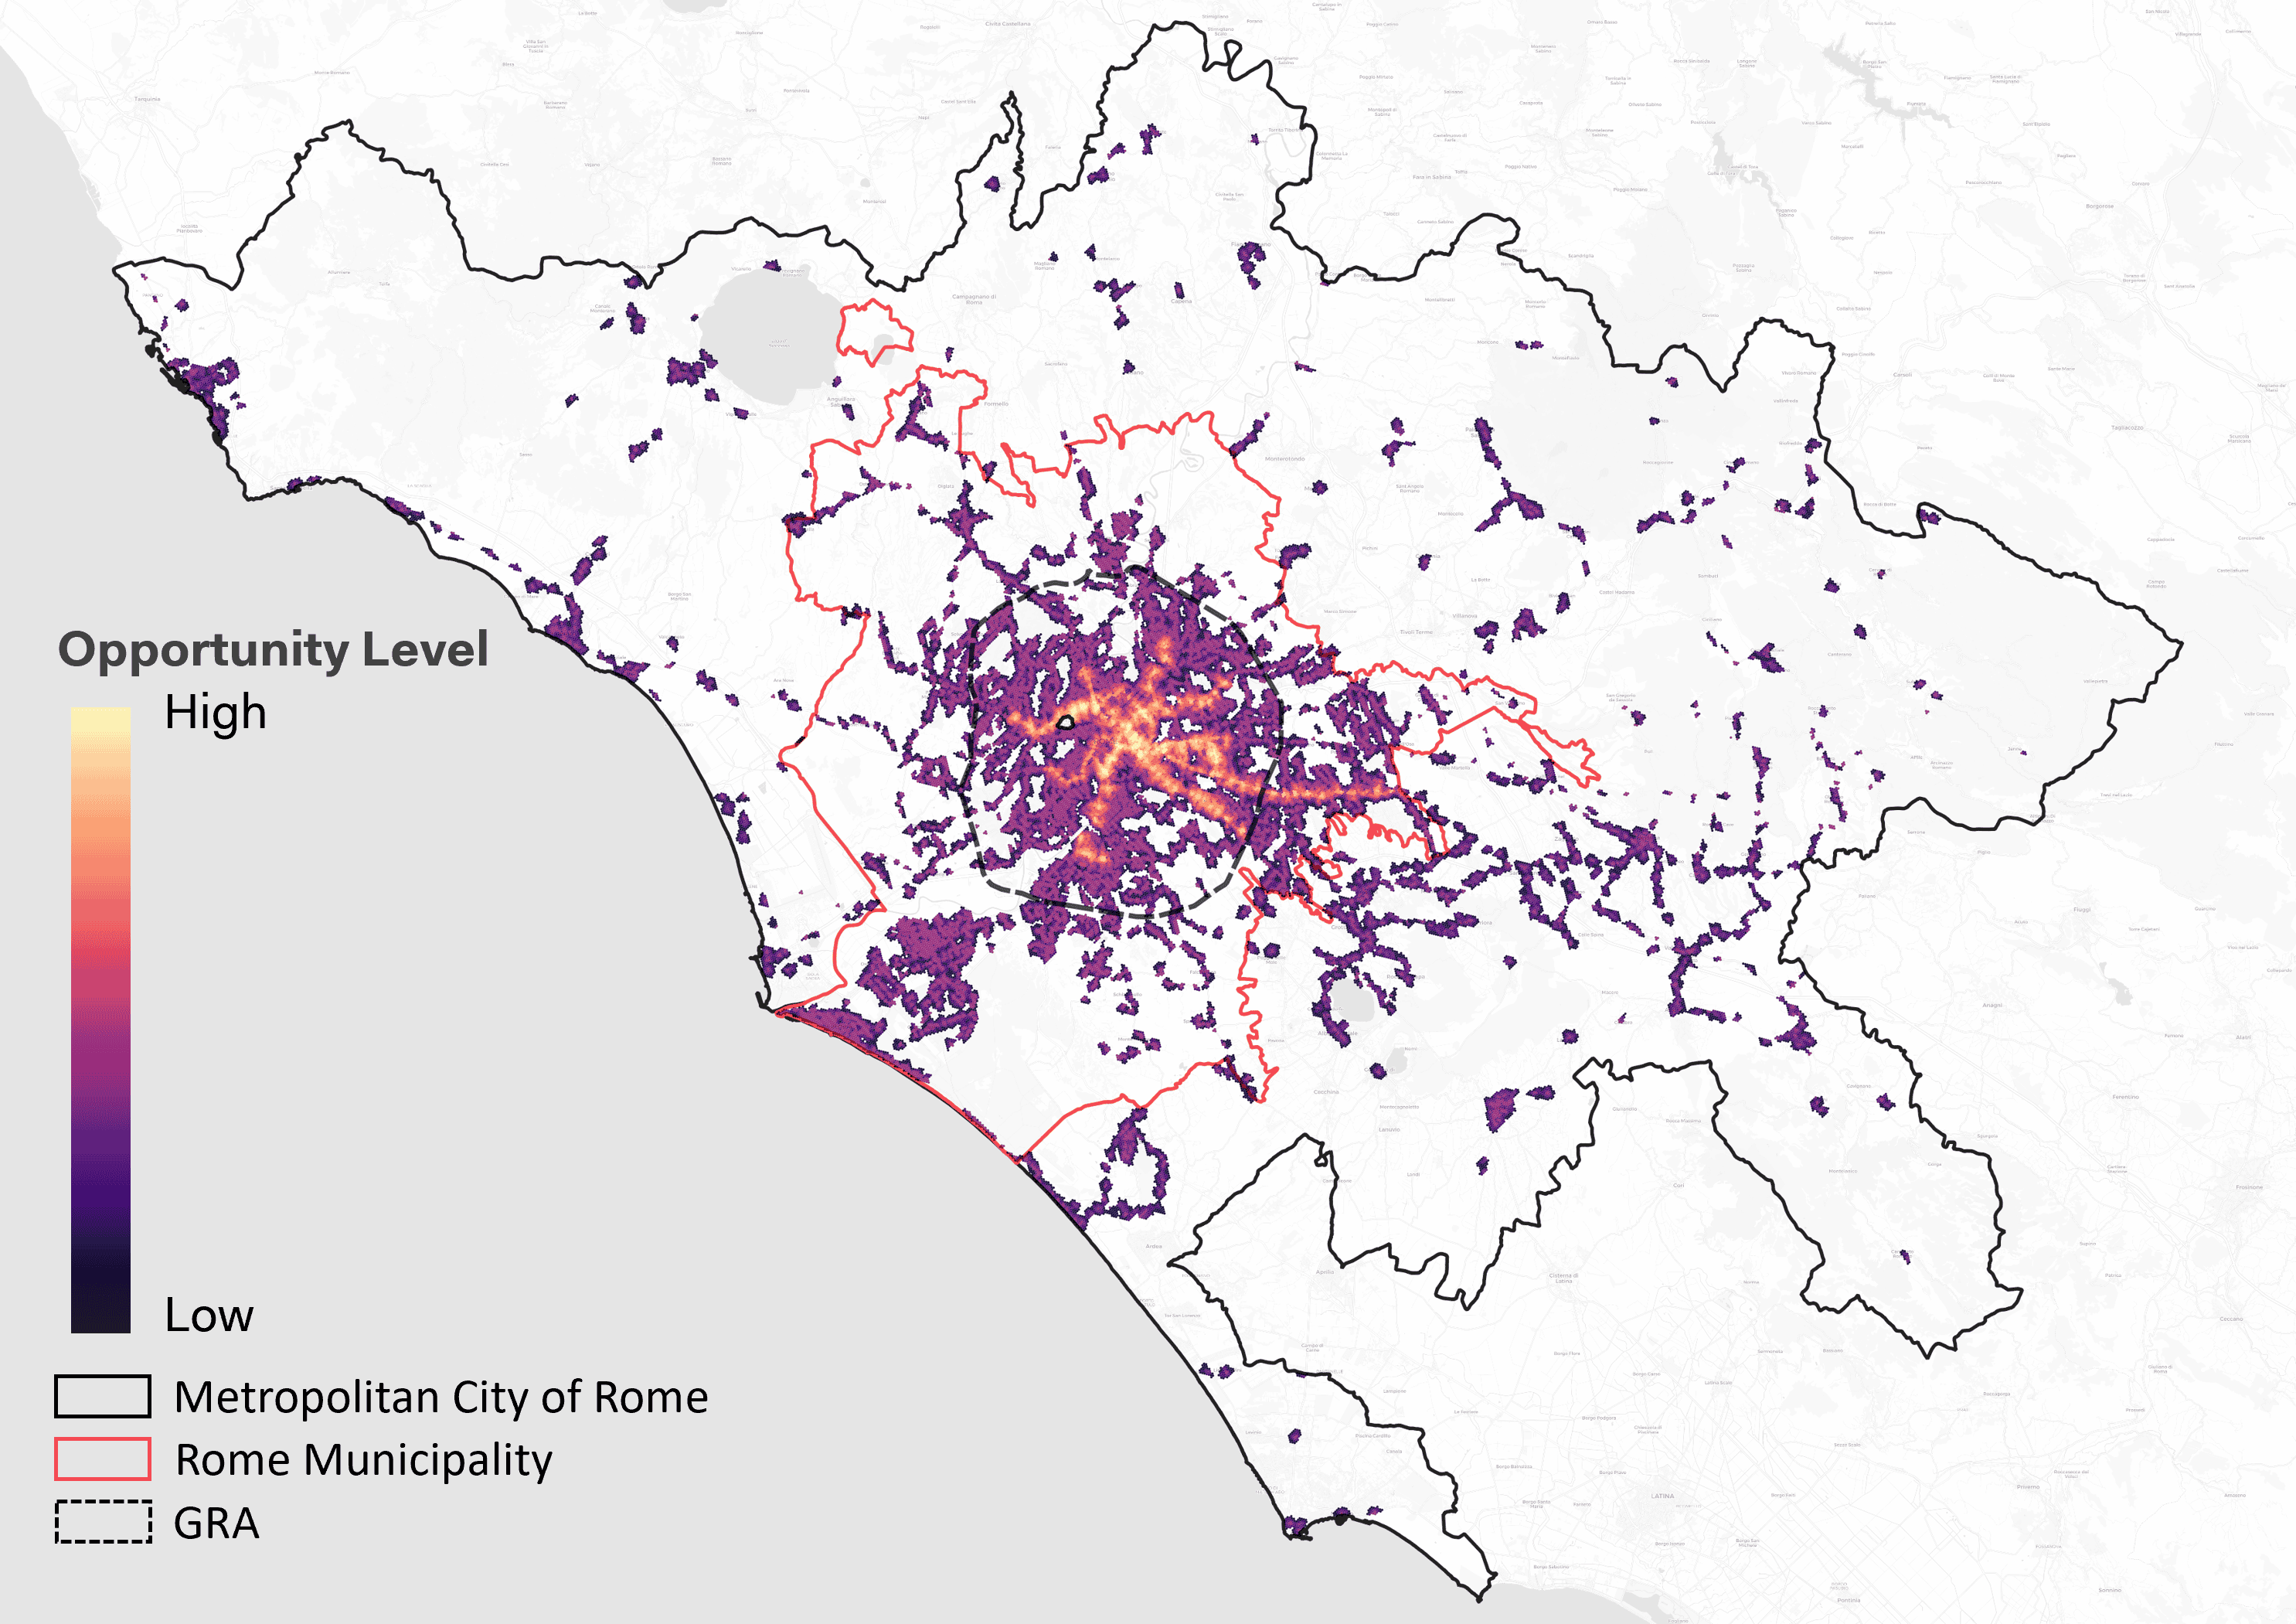
The PTOL metric evaluates accessibility to public transport stops within walking distance. Results indicate that 15% of the Metropolitan City has access to at least one public transport mode within 12 minutes on foot. 11.3% of the area has access to one mode, 2.6% to two modes, less than 1% to three modes, and only 0.2% to four modes (see Figure 6). When disaggregated by transport mode:
- The metro system serves only 6% of Rome and 1.5% of the Metropolitan City;
- The tram network serves less than 1% of the Metropolitan City and 2.5% of Rome;
- The bus network covers 13.6% of the Metropolitan City and 40% of Rome;
- The rail network serves 3.6% of the Metropolitan City and 9% of Rome.
When intersected with population distribution and urban development forecasts, these results can support strategic decisions for future transit network development. This integration allows planners to better align accessibility improvements with areas of growing demand, ensuring that mobility interventions are equitable.
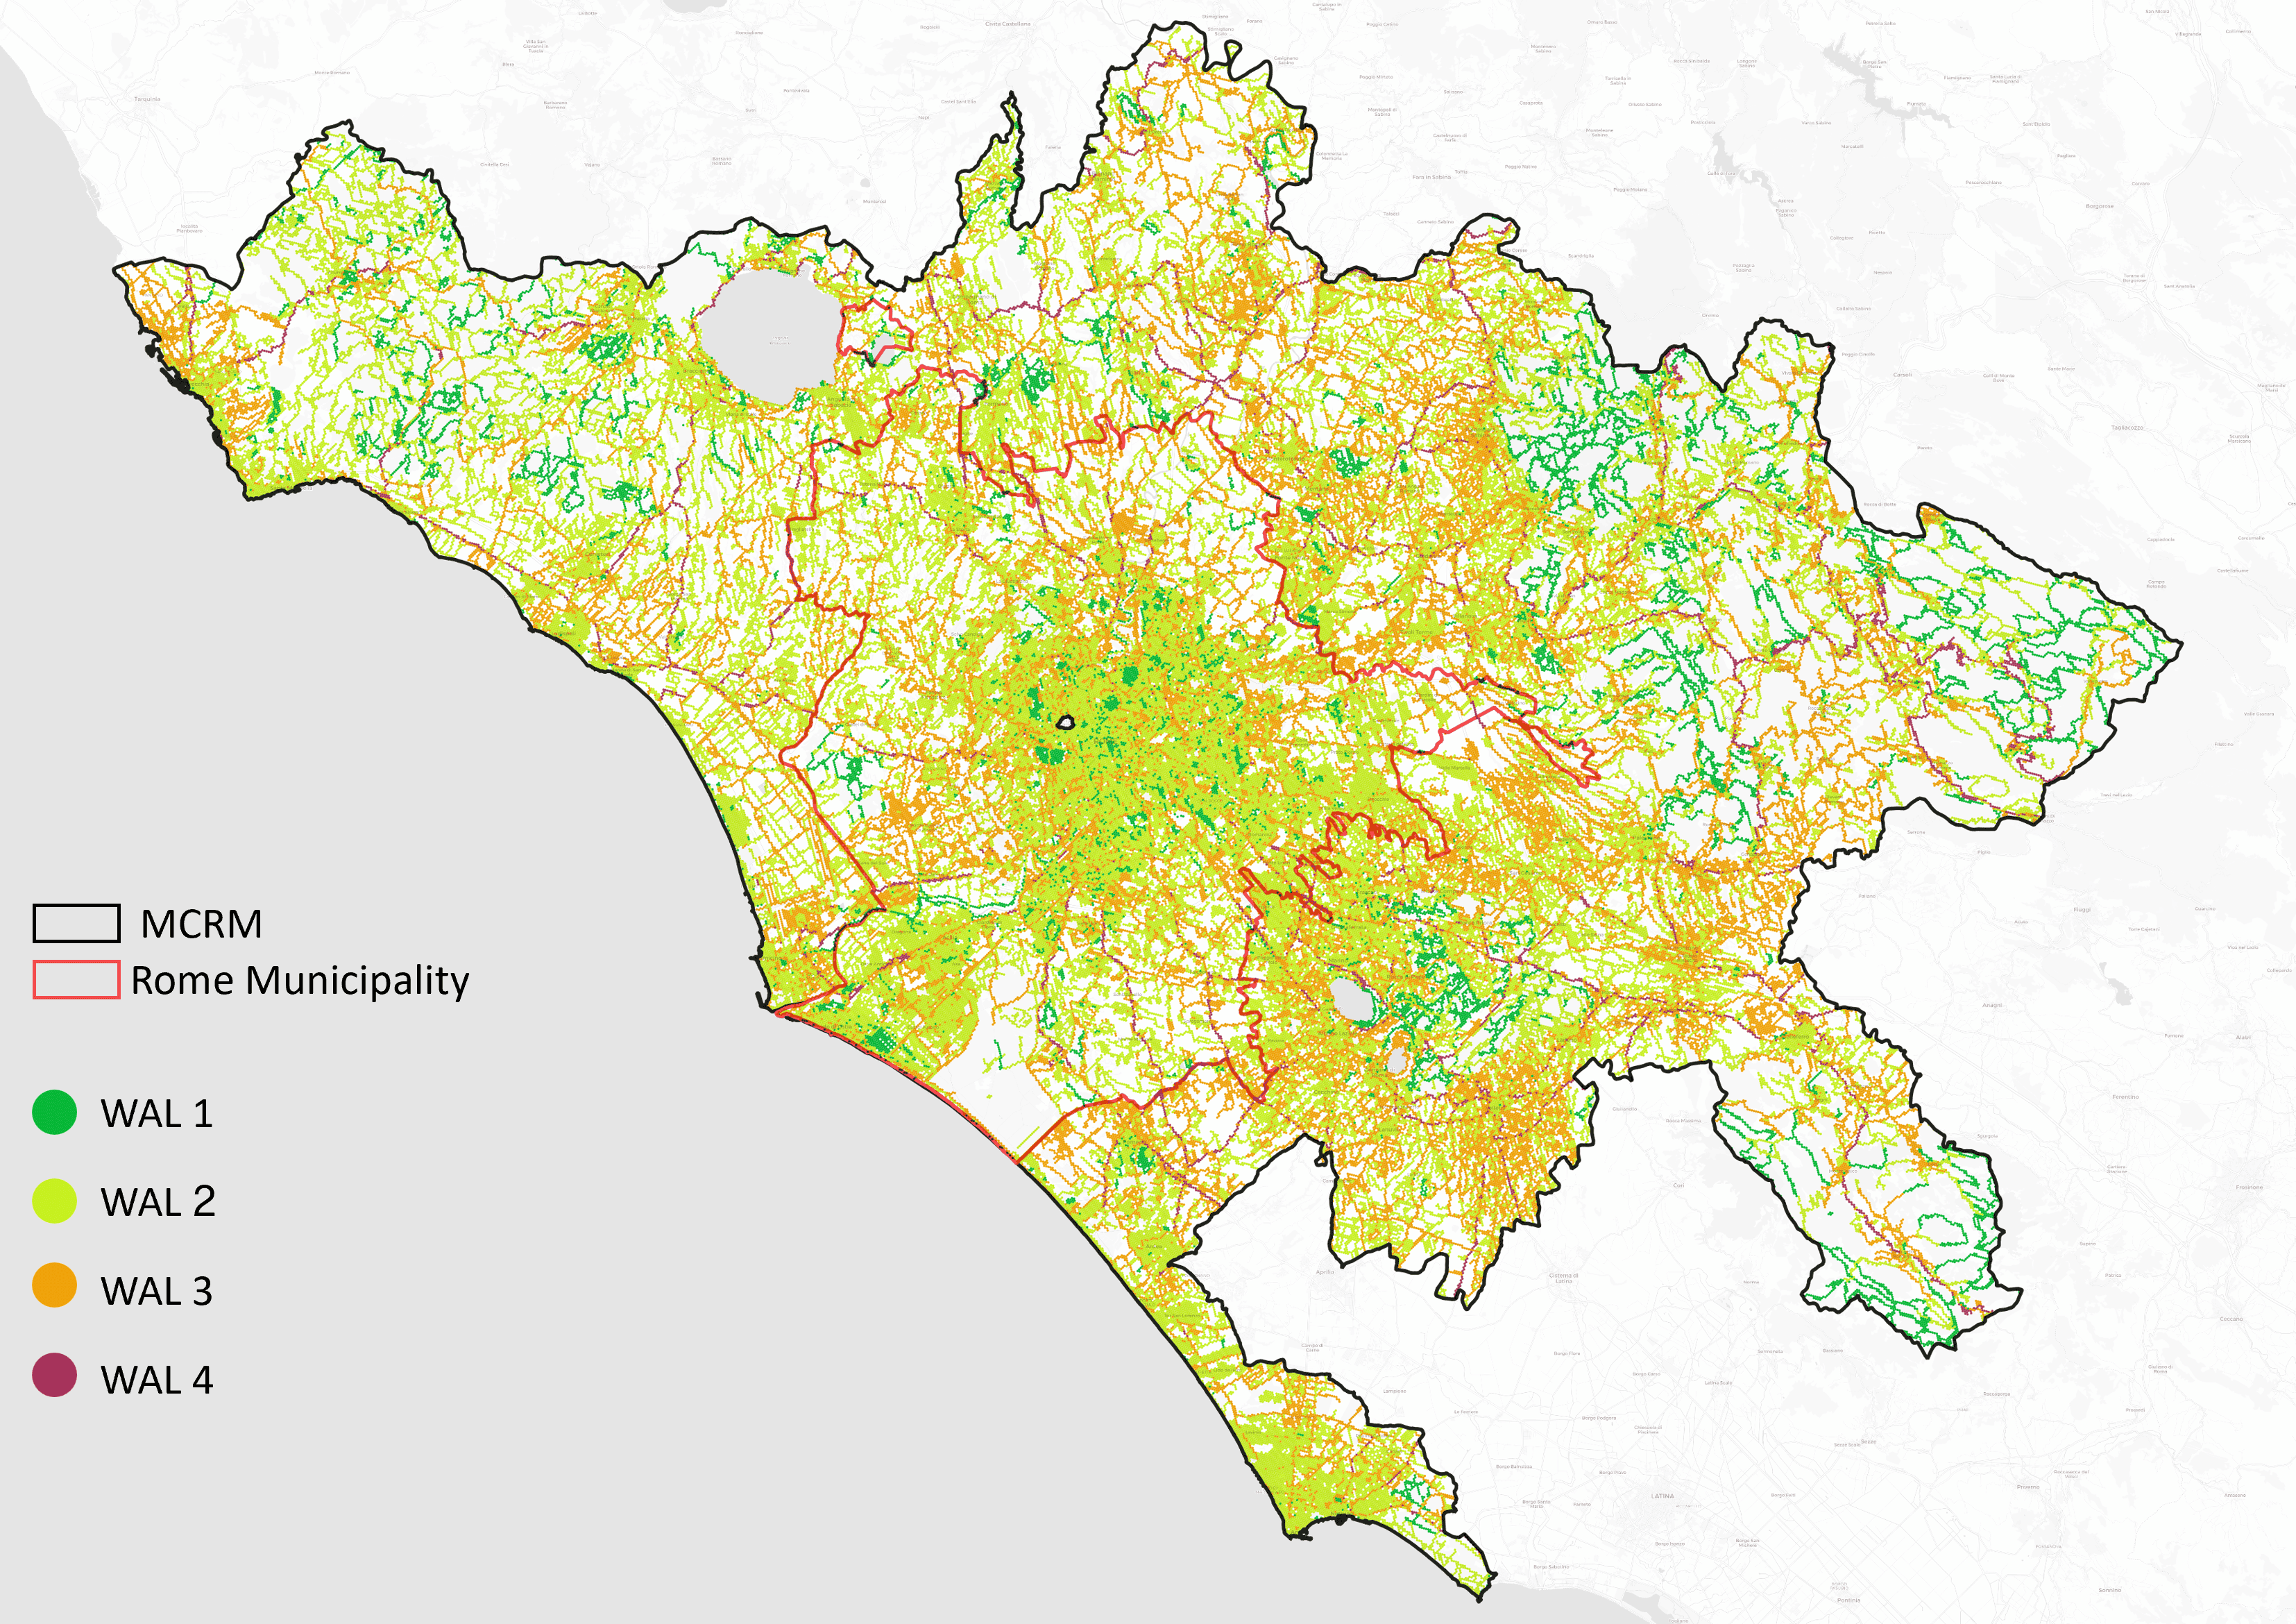
The weighted average LTS for hexagonal grid cells (H3 level 10) is distributed as follows:
- 5% of hexagonal cells are classified as LTS 1 (very low stress, suitable for all cyclists);
- 29% are classified as LTS 2 (moderate stress, comfortable for most cyclists);
- 17% are classified as LTS 3 (high stress, suitable mainly for experienced cyclists);
- Less than 1.5% are classified as LTS 4 (very high stress, unsafe for most cyclists).
Approximately 48% of hexagonal cells in the Metropolitan City of Roma Capitale were excluded from the LTS analysis because they do not intersect the road network.
In summary, the results highlight significant disparities in sustainable mobility across the Metropolitan City of Roma Capitale. While central areas within the GRA benefit from greater accessibility to services and public transport, peripheral and suburban zones remain largely underserved. The PTOL metric reveals a heavy reliance on buses, with metro and tram coverage being minimal. The LTS analysis shows that while some areas provide low stress cycling environments, a significant portion of the city still lacks dedicated cycling infrastructure. These findings emphasize the need for targeted interventions to enhance walkability, expand public transport options, and improve cycling infrastructure to create a more inclusive and sustainable urban mobility system.
Conclusions and Future Work
This research aimed at developing a study on sustainable mobility in the Metropolitan City of Roma Capitale, assessing multimodal accessibility through GIS mapping, identifying high-priority areas for walking, cycling, and public transport interventions, and developing an analytical framework to support mobility planning and monitoring. To reach these objectives, three metrics were computed, the 15-Minute City Score, for pedestrian accessibility to proximity services, the Public Transport Opportunity Level, for pedestrian accessibility to public transport stops, and the Bicycle Level of traffic Stress, for cyclists’ stress levels definition.
Results highlight significant disparities in sustainable mobility across the Metropolitan City of Roma Capitale. While central areas within the Grande Raccordo Anulare (GRA) benefit from greater accessibility to services and public transport, peripheral and suburban zones remain largely underserved. The PTOL metric reveals heavy reliance on buses, with metro and tram coverage being minimal, while the LTS analysis indicates that a significant portion of the city still lacks dedicated cycling infrastructure.
These findings provide critical insights for urban planners and policymakers aiming to foster sustainable mobility in the Metropolitan City of Roma Capitale. The clear disparities in multimodal accessibility underscore the need for a more balanced and equitable mobility strategy. By integrating the 15-Minute City Score, PTOL, and LTS metrics into planning processes, authorities can prioritize interventions where they are most needed, focusing on underserved neighborhoods. This data-driven approach can support targeted investments in walkability, public transport expansion, and safe cycling networks, ultimately contributing to a more inclusive, connected, and sustainable urban environment.
Building on these insights, future research will refine and expand the current analysis by further investigating urban service accessibility and educational facility access across the metropolitan area. This work will focus on urban services accessibility and educational services accessibility. For the former, future studies will assess access to healthcare, education, cultural institutions, transportation hubs, and recreational facilities using advanced spatial analysis techniques. Service catchment areas will be defined, and accessibility levels across different urban zones will be quantified. Additionally, integrating demographic data will help estimate the population benefiting from these services. For the latter, future research will explore accessibility to schools and universities, considering different travel time thresholds based on service type. This analysis will identify gaps in educational accessibility and evaluate how proximity to these services varies across different population groups.
A more detailed focus on these services will allow for the identification of those most essential to different age groups, reflecting the varying needs of children, working-age adults, and the elderly. By targeting healthcare, education, cultural institutions, transportation hubs, and recreational facilities, the analysis prioritizes services that are fundamental to daily life and social inclusion. This approach ensures that planning efforts are aligned with the specific needs of diverse demographic segments, supporting more inclusive and responsive urban mobility and accessibility strategies.
Acknowledgments
We thank Laboratorio Roma050 for the fruitful contribution and collaboration to this research. The data analyzed were treated according to the GDPR-General Data Protection Regulation (EU, 2016/679). This research received no specific grant from any funding agency in the public, commercial, or not-for-profit sectors. All datasets and methodologies used in this research are open source. Additional information is available upon request.
Reference
Abdelfattah, L., Albashir, A., Ceccarelli, G., Gorrini, A., Messa, F., & Presicce, D. (2025). The Right to the Night City: Exploring the Temporal Variability of the 15-min City in Milan and Its Implications for Nocturnal Communities. Computers, 14(1), 22. https://doi.org/10.3390/computers14010022
Abdelfattah, L., Deponte, D., Fossa, G. (2022). 15-Minute City: Interpreting the Model to Bring Out Urban Resiliencies. Transportation Research Procedia, 60, 330-337. https://doi.org/10.1016/j.trpro.2021.12.043
Adriazola-Steil, C., Ohlund, H., El-Samra, S., Targa, F., & Zayas, G. (2021). Investing for Momentum in Active Mobility. In Transportation Decarbonization Investment Series (Issue October). https://doi.org/10.1596/36617
Albashir, A., Messa, F., Presicce, D., Pedrazzoli, A., & Gorrini, A. (2024). 15min City Score Toolkit – Urban Walkability Analytics. In Transform Transport Working Papers Collection. Zenodo. https://doi.org/10.5281/zenodo.14231533
Albashir, A., Messa, F., Presicce, D., Pedrazzoli, A., & Gorrini, A. (2024). 15min City Score Toolkit – QGIS Script. In Transform Transport Working Papers Collection. Zenodo. https://doi.org/10.5281/zenodo.14231353
Cludius et al., 2024. Transport poverty: definitions, indicators, determinants, and mitigation strategies – Final Report, European Commission. Available at: https://ec.europa.eu/social/main.jsp?catId=738&langId=en&pubId=8651&furtherPubs=yes
EuroCities, European Declaration for Sustainable and Attractive Public Transport in Cities (2024). Available at: https://councilmeetings.dublincity.ie/documents/s46657/Final-version-Public-Transport-Declaration-Barcelona-FINAL-002.pdf
Furth, P. G., Mekuria, M. C., & Nixon, H. (2016). Network Connectivity for Low-Stress Bicycling. Transportation Research Record, 2587(1), 41–49. https://doi.org/10.3141/2587-06
Hall, C. M., & Ram, Y. (2018). Walk score® and its potential contribution to the study of active transport and walkability: A critical and systematic review. Transportation Research Part D: Transport and Environment, 61, 310-324. https://www.mdpi.com/2624-6511/4/1/6
TfL – Transport for London (2010). Measuring Public Transport Accessibility Levels PTALs. Accessible at: https://s3-eu-west-1.amazonaws.com/londondatastore-upload/PTAL-methodology.pdf
Moreno, C., Allam, Z., Chabaud D., Gall C., & Pratlong, F. (2021). Introducing the “15-Minute City”: Sustainability, Resilience and Place Identity in Future Post-Pandemic Cities. Smart Cities. 2021; 4(1):93-111. https://doi.org/10.3390/smartcities4010006
Transform Transport (2024). The Right to Cycle Part 2 – The Role of Cycling Infrastructure. Accessed February 18, 2025, from https://transformtransport.org/research/the-right-to-cycle-part-2-the-role-of-cycling-infrastructure/
Yanocha, D. and Mawdsley, S. (2022). Making the Economic Case for Cycling. Institute for Transportation & Development Policy. https://www.itdp.org/wp-content/uploads/2022/06/Making-the-Economic-Case-for-Cycling_6-13-22.pdf