
The recent developments of ICT tools for collecting traffic data in the urban environment have allowed a tremendous increase in the quality and amount of easily accessible data. This enables transport planners and decision makers to analyze, explain, and estimate complex mobility patterns. Thanks to the collaboration with Blimp.ai, the research is based on the analysis of proprietary data on pedestrian counts collected in Milan from the beginning of November 2020 to the end of July 2021 through a network of sensors. Data is used to assess the impact of the Covid-19 restrictions on pedestrian dynamics with a time series analysis. This is further analysed through an extended GIS-based analysis of potential attractors of city users (e.g., land mixed-use, POIs, Public Transport, etc.), to assess the interplay between pedestrian traffic, city characteristics and restrictions.
Urban Informatics for Transport Planning
The growth of urban data produced by sensors scattered across our cities allows better management and optimization of transport services in real time (Li et al., 2020). Within the Urban Informatics approach (Foth et al., 2011), the aim is to assess the operational conditions of mobility services, detecting anomalies, and avoiding service disruptions. The more powerful ICT solutions for analysis of travel patterns can be enabled by several different types of location detection systems. This study uses sensors-based analysis-acquisition systems (Buch et al., 2011), in which data is processed by an Artificial Intelligence to count pedestrians.
In this context, the Covid-19 pandemic has revealed a crucial application of traffic data monitoring: to examine the effects of the pandemic on urban mobility and to measure the effectiveness of the cities’ responses to the crisis (European Platform on Sustainable Urban Mobility Plans, 2020; Comune di Milano and AMAT, 2020).
This research proposes a combined spatial and temporal analysis of pedestrian count data in the City of Milan to assess the impact of Covid-19 lockdown restriction measures on pedestrian traffic and the interplay with city attractors. By analogy with a methodology presented by Transport Transport for the analysis of Wi-Fi data, pedestrian counts data is used to estimate hidden mobility patterns in the City of Milan, focusing on the latter waves of the pandemic (from the beginning of November 2020 to the end of July 2021).
Enabling Data and Methodology
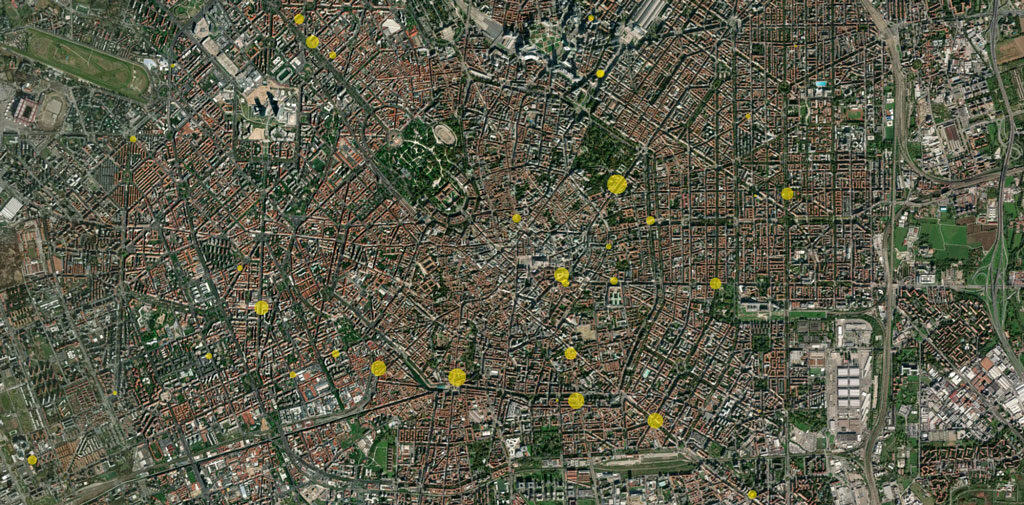
Blimp.ai developed a sensor (aided by an A.I.) which collects disaggregated traffic data (e.g., vehicular traffic, pedestrian and bicycle flows). Thanks to the collaboration with them, Transform Transport analyzed pedestrian activity data collected through a network of sensors installed in advertising billboards. Sensors are located next to newspaper stands, typically on larger sidewalks or plazas, and they count passersby in a cone shape.
A few values were missing throughout the data collection period, likely due to malfunctioning of sensors. Moreover, some values were inexplicably high or low relative to others, therefore, a data validation process was necessary to find and remove outliers. Those values were removed and replaced by null values. However, some other strange values were scattered over the study period highlighting the need for a more systematic way to detect outliers. Being a robust and easy technique (Schwertman et. al., 2004), the interquartile range method was chosen. Values detected as being outliers were then replaced by null values. Moreover, sensors that had too high a frequency of removed or missing values were excluded from the study, as they would likely be unreliable. This process led to a final selection of 47 sensors.
Results of Temporal analysis
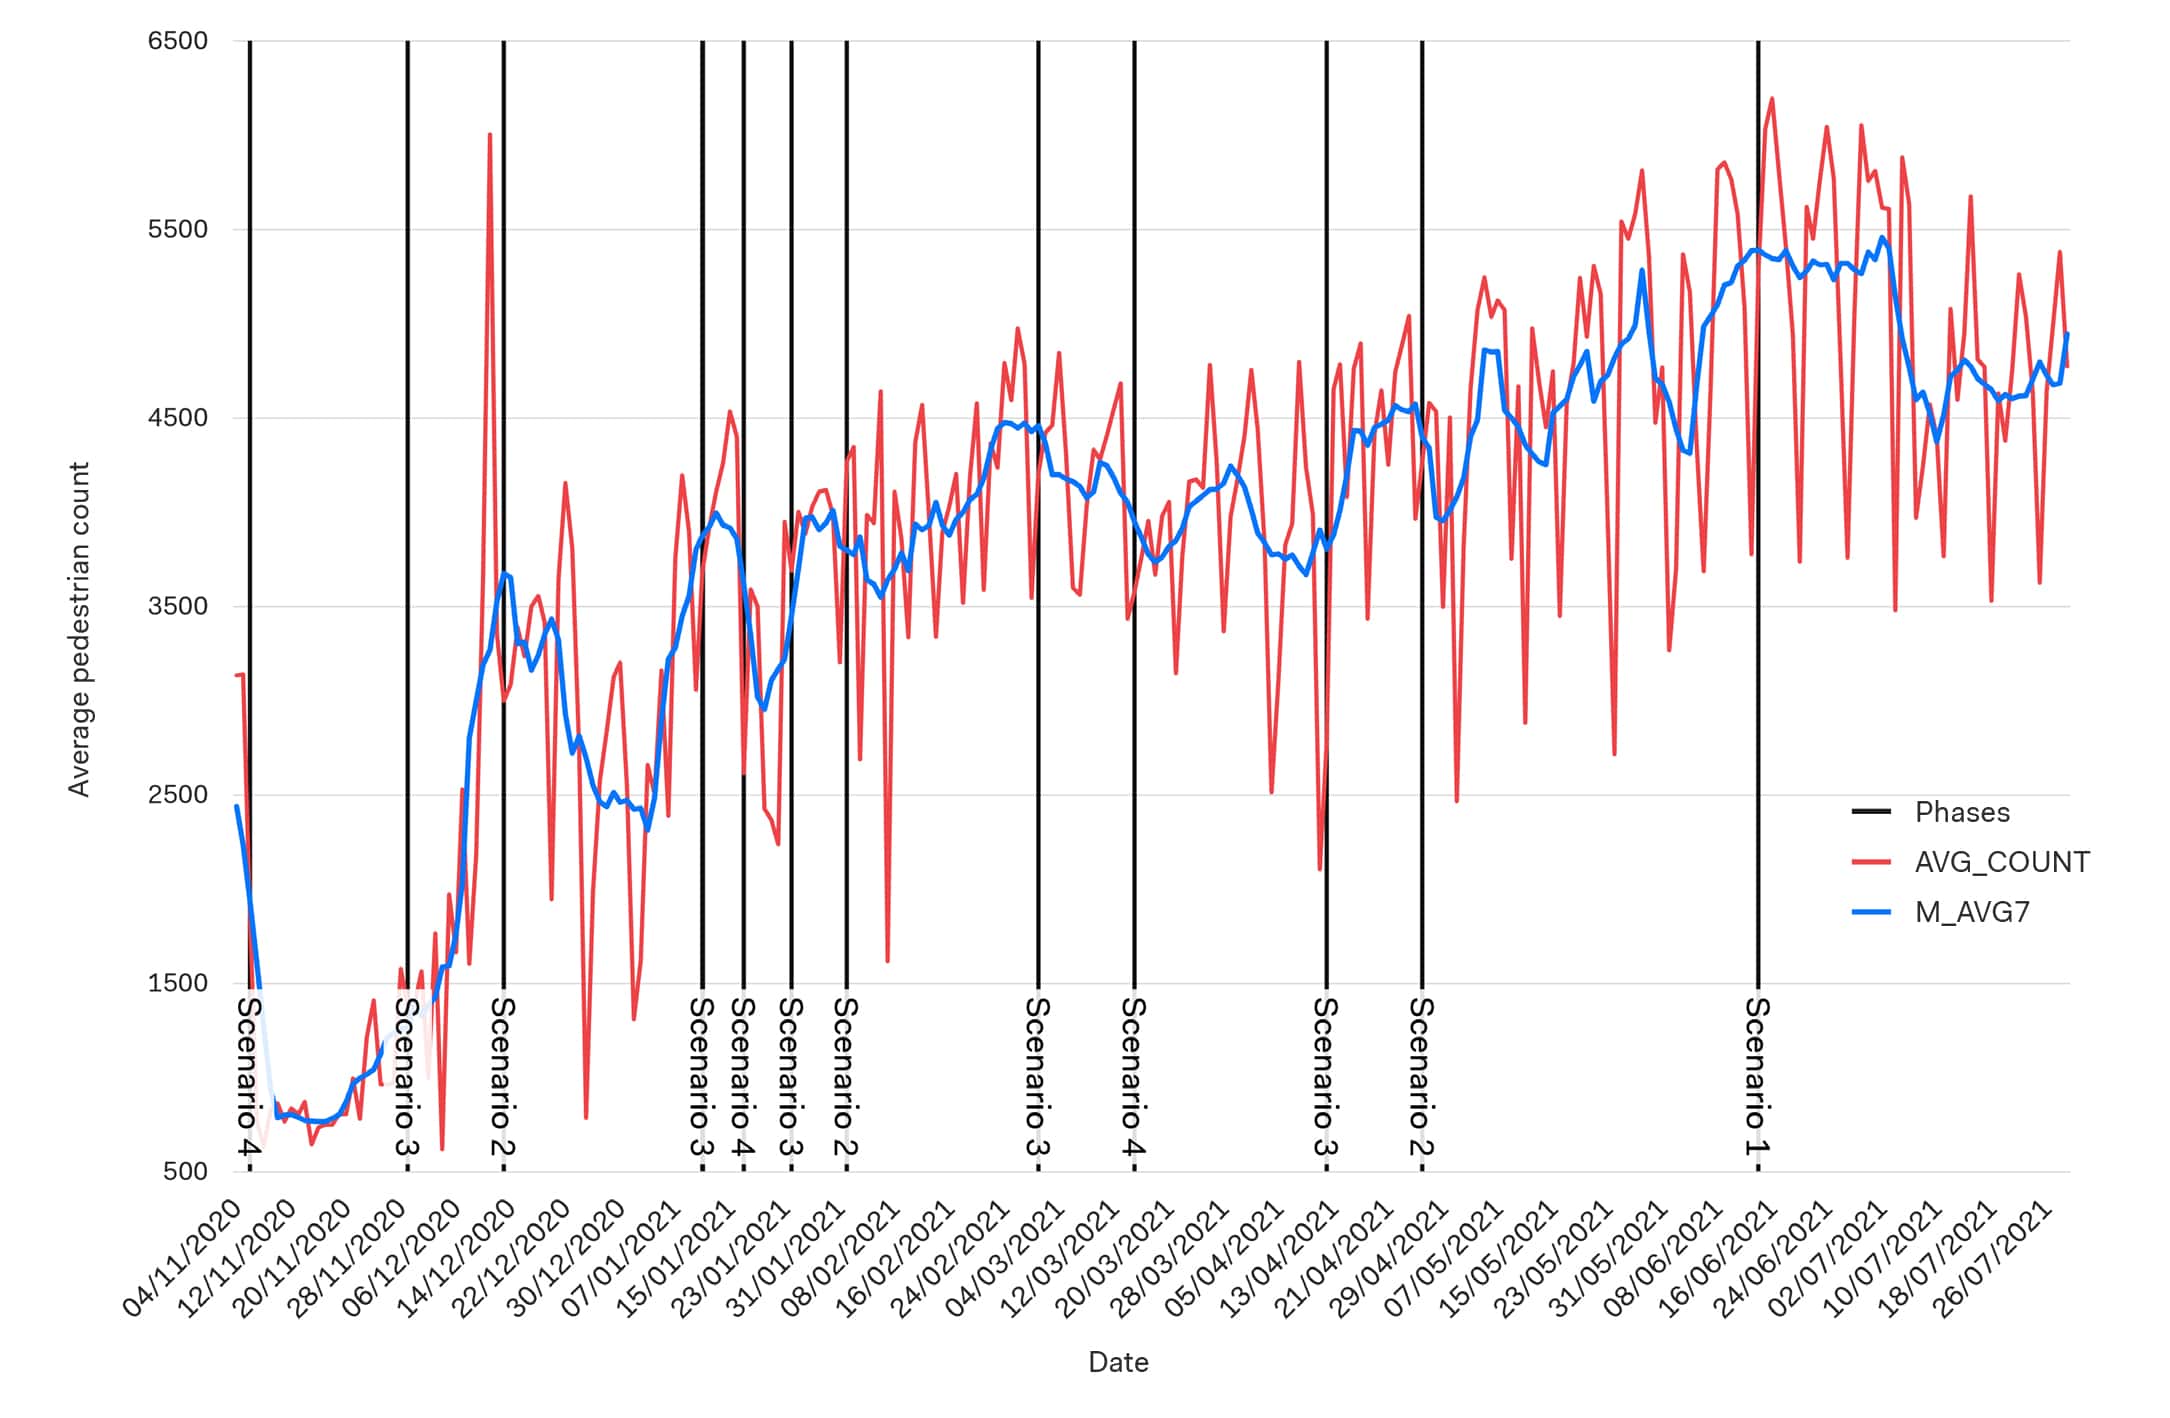
The chart (see Figure 1) presents the result of the time series analysis of the average values per sensor from November 1st, 2020, to July 29th, 2021. The types of Covid-19 restrictions enacted under each scenario are highlighted in the chart, and described in Table 1 by ascending order of strictness:
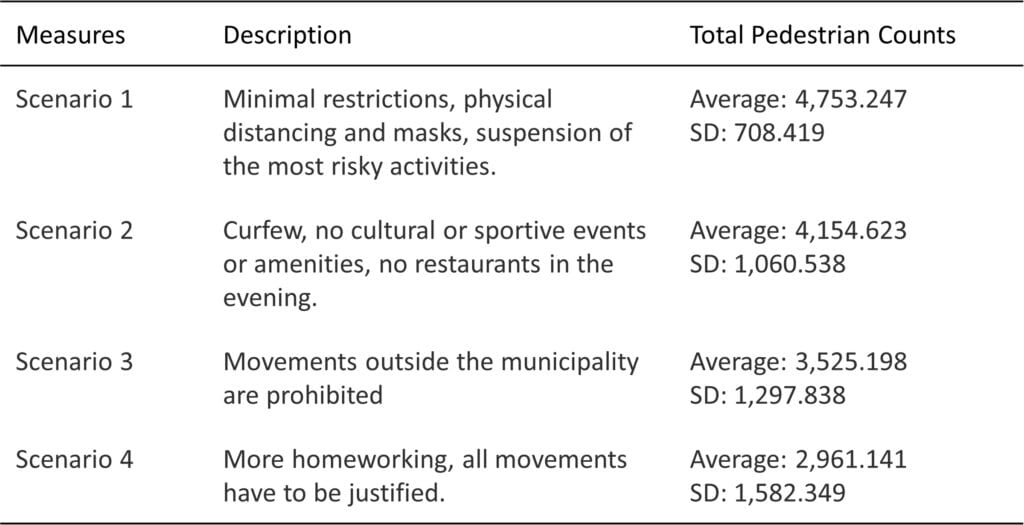
A 7-day moving average smoothes out short-term variations, showing longer-term trends. However, the rapid evolution of covid restrictions limits the potential to interpret the precise effect they had. For this purpose, a series of t-tests were conducted, resulting in a significant (p < 0.05) difference between the number of pedestrians detected on a daily average during all scenarios. Therefore, it can be deduced that the Covid-19 restrictions had a sizable effect on pedestrian activity.
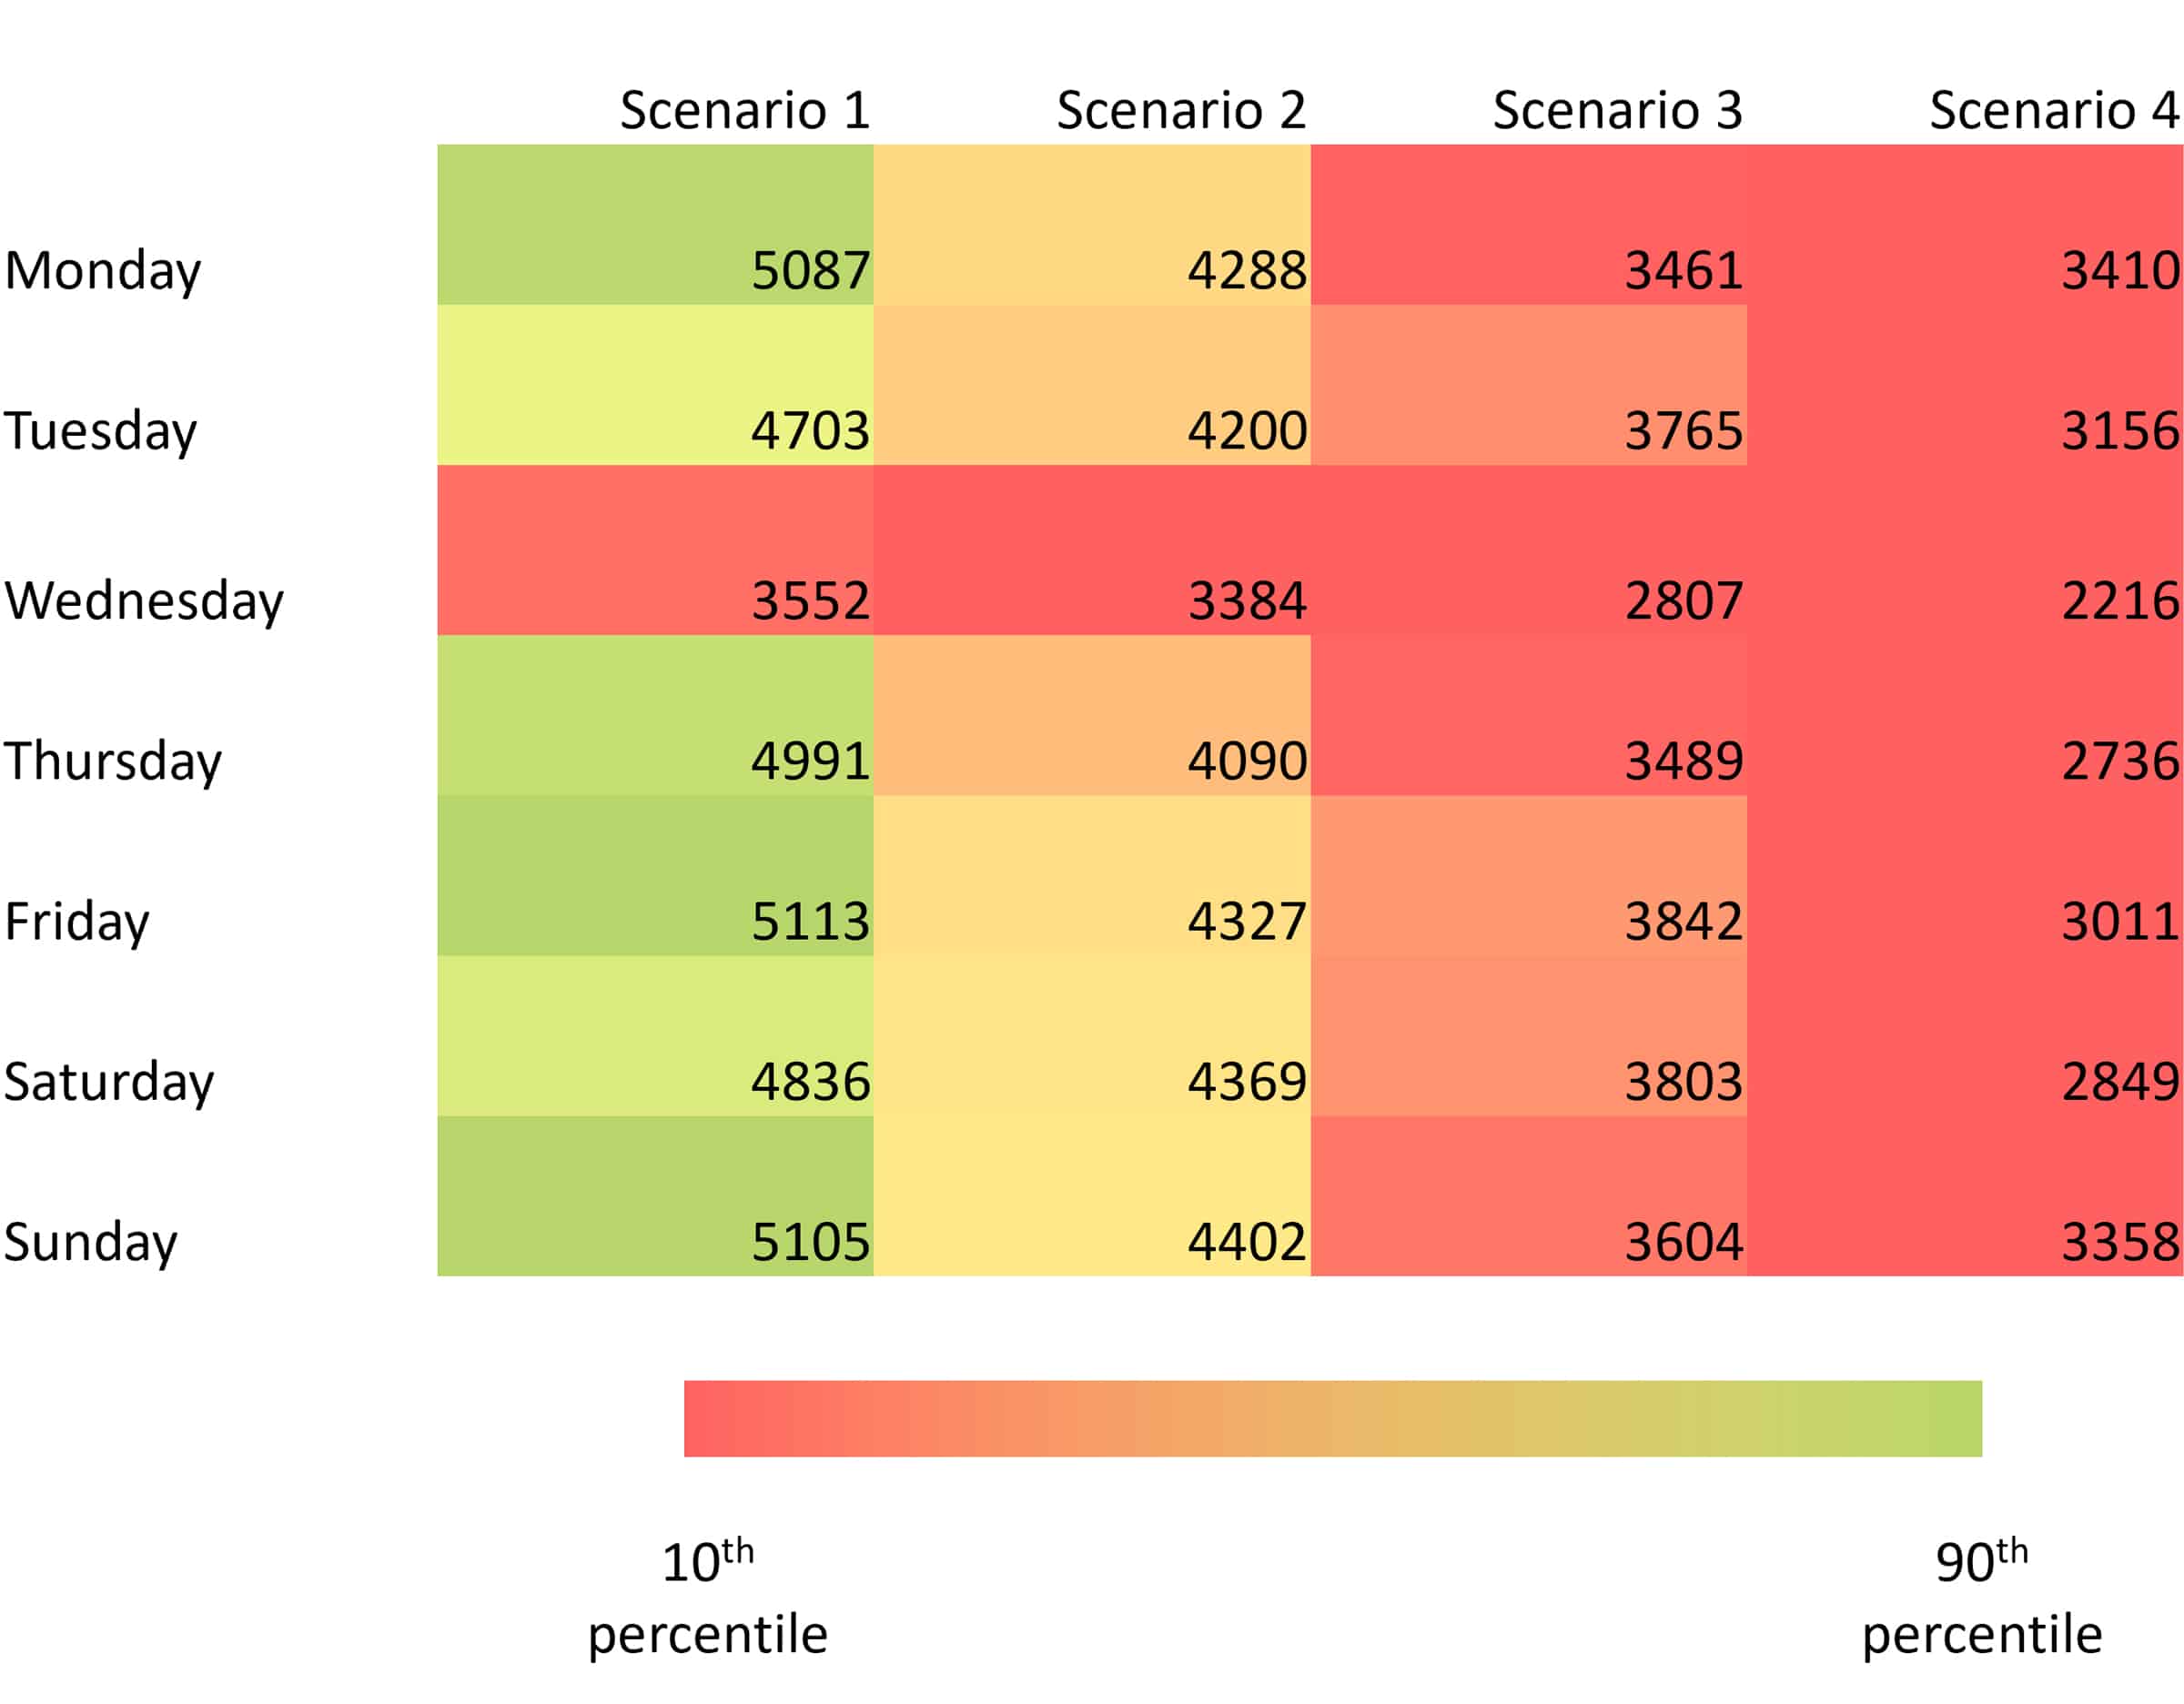
Figure 2 shows the average count of pedestrians per day of the week, for the various phases. Values are more homogeneous the stricter the Covid-19 measures get, but Wednesday remains the least active day of the week for all phases.
Results of Spatial Analysis
A series of geospatial data about land use, urban amenities and services was collected thanks to open data from local authorities (i.e. Geoportal of the City of Milan, Geoportal of Lombardy Region, Italian National Institute of Statistics), and from OpenStreetMap. These are listed in Table 2.
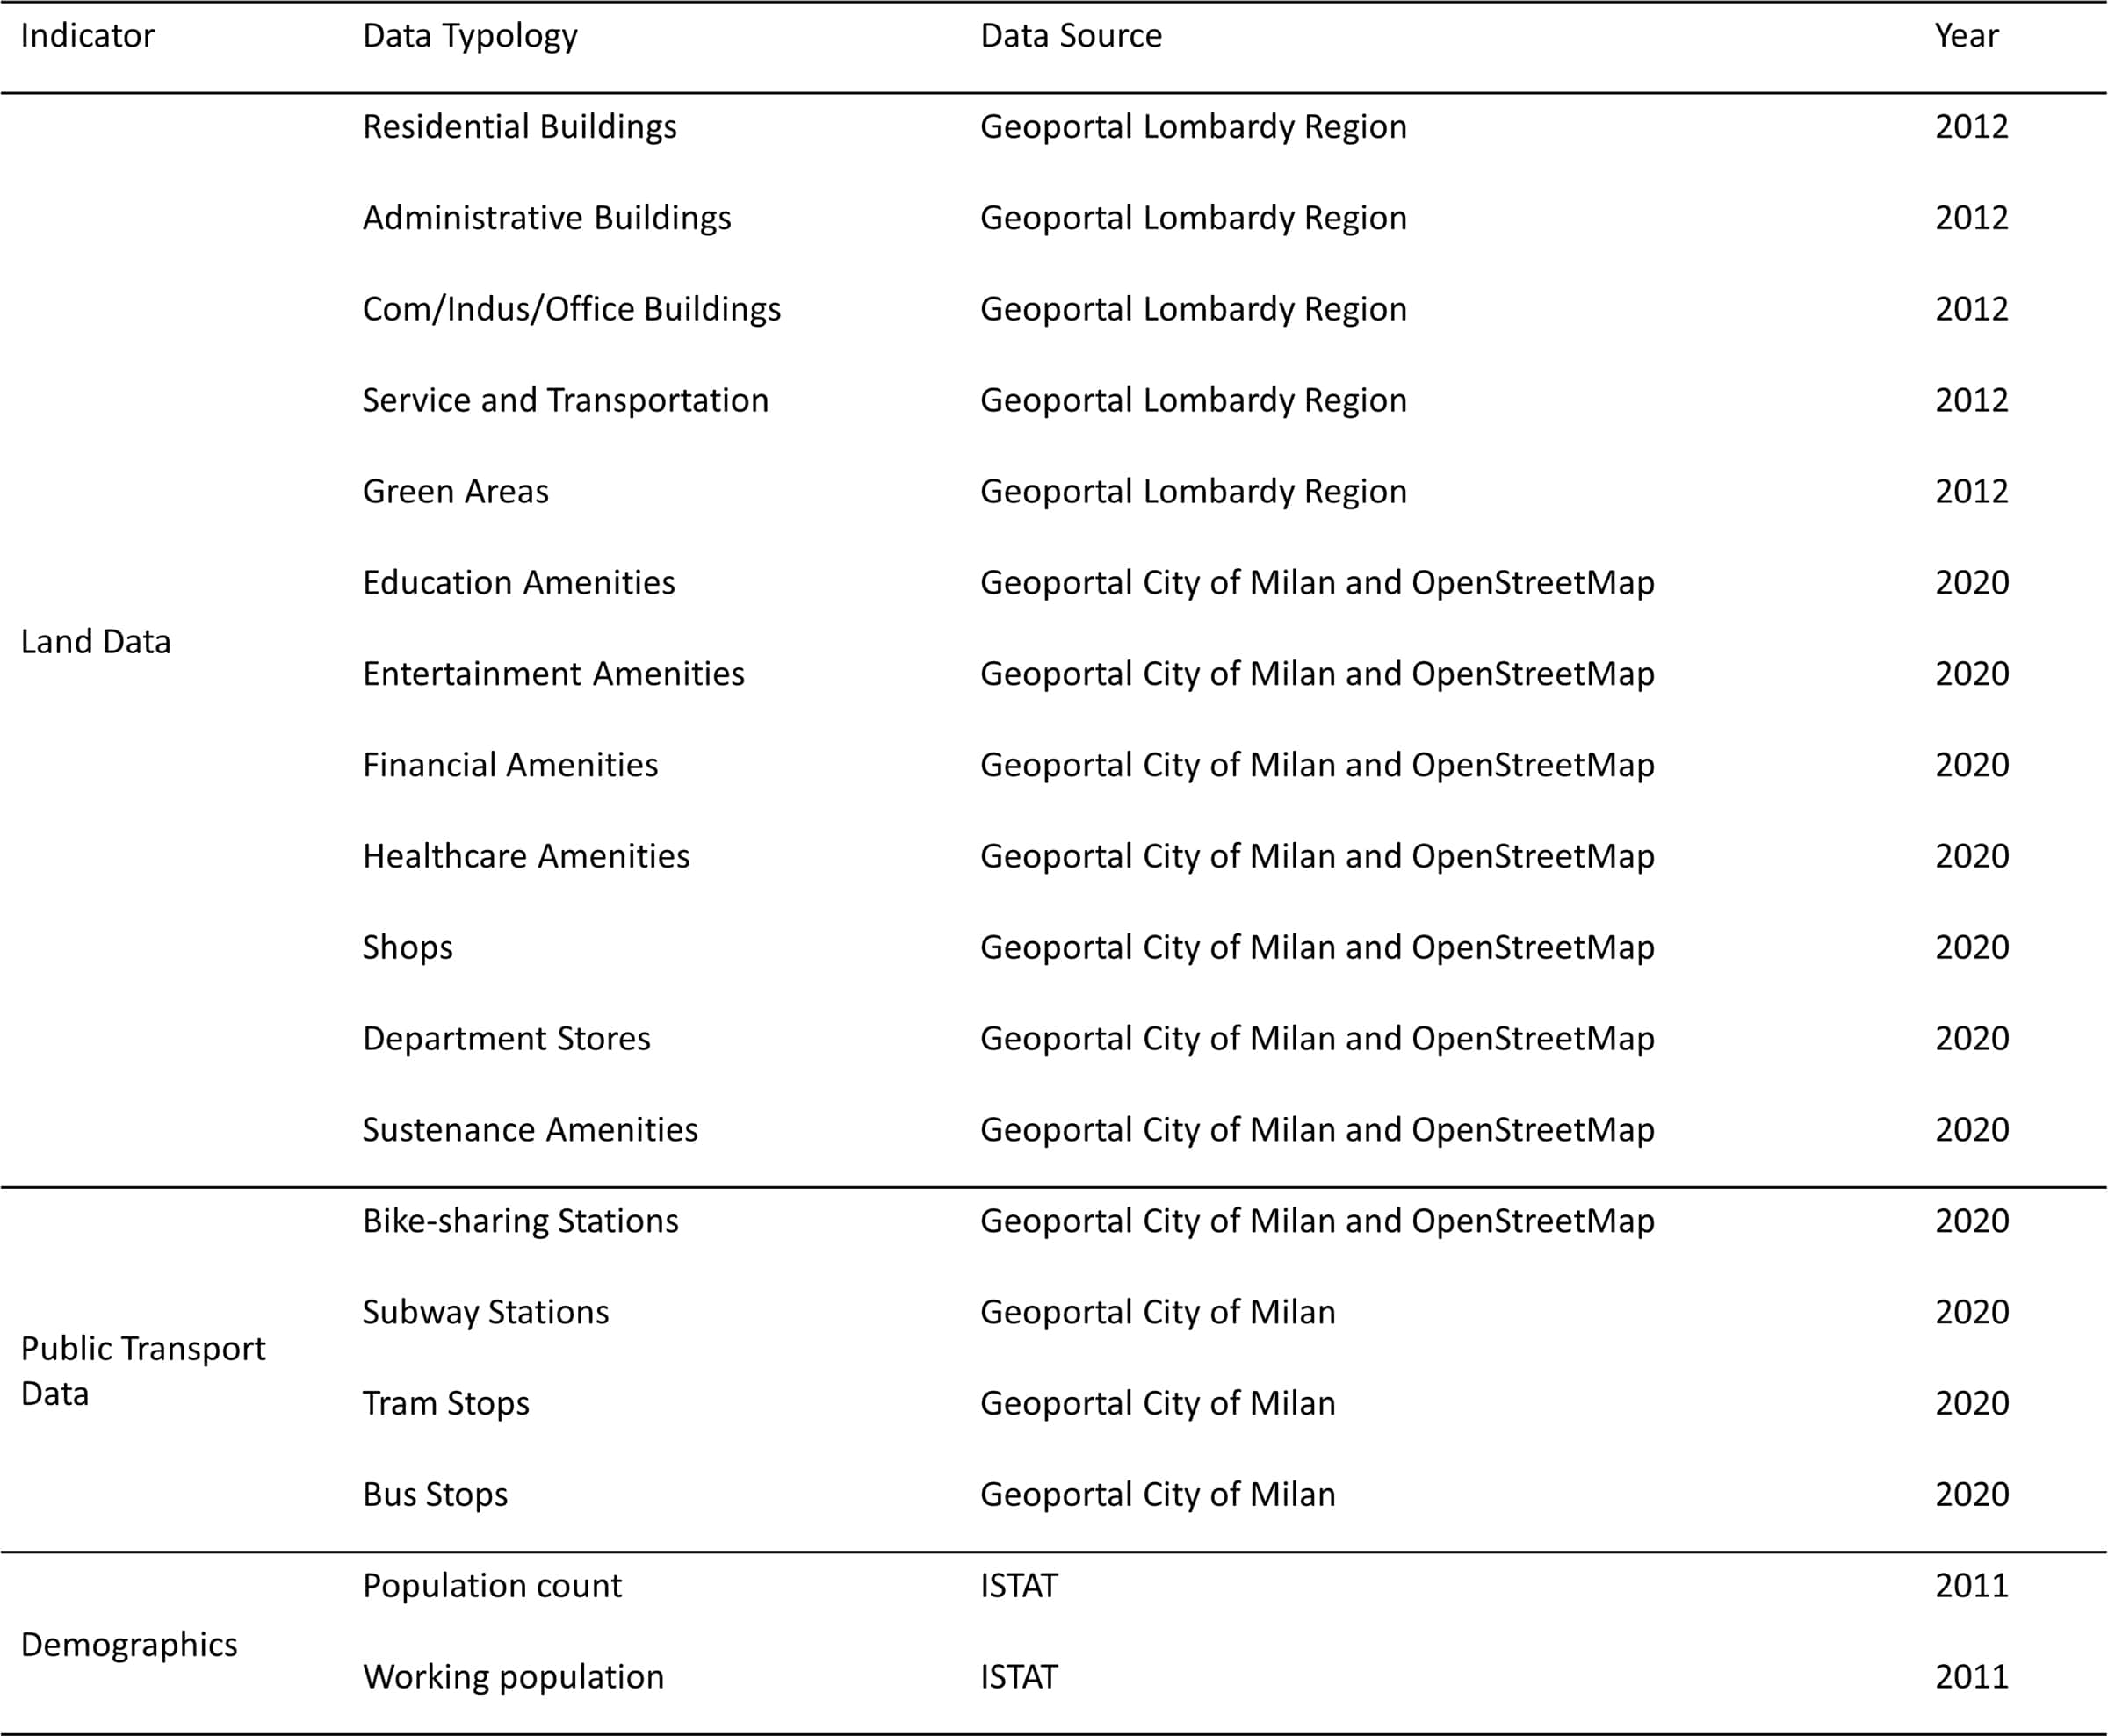
Table 2 Correlation analysis, explanatory factors selected
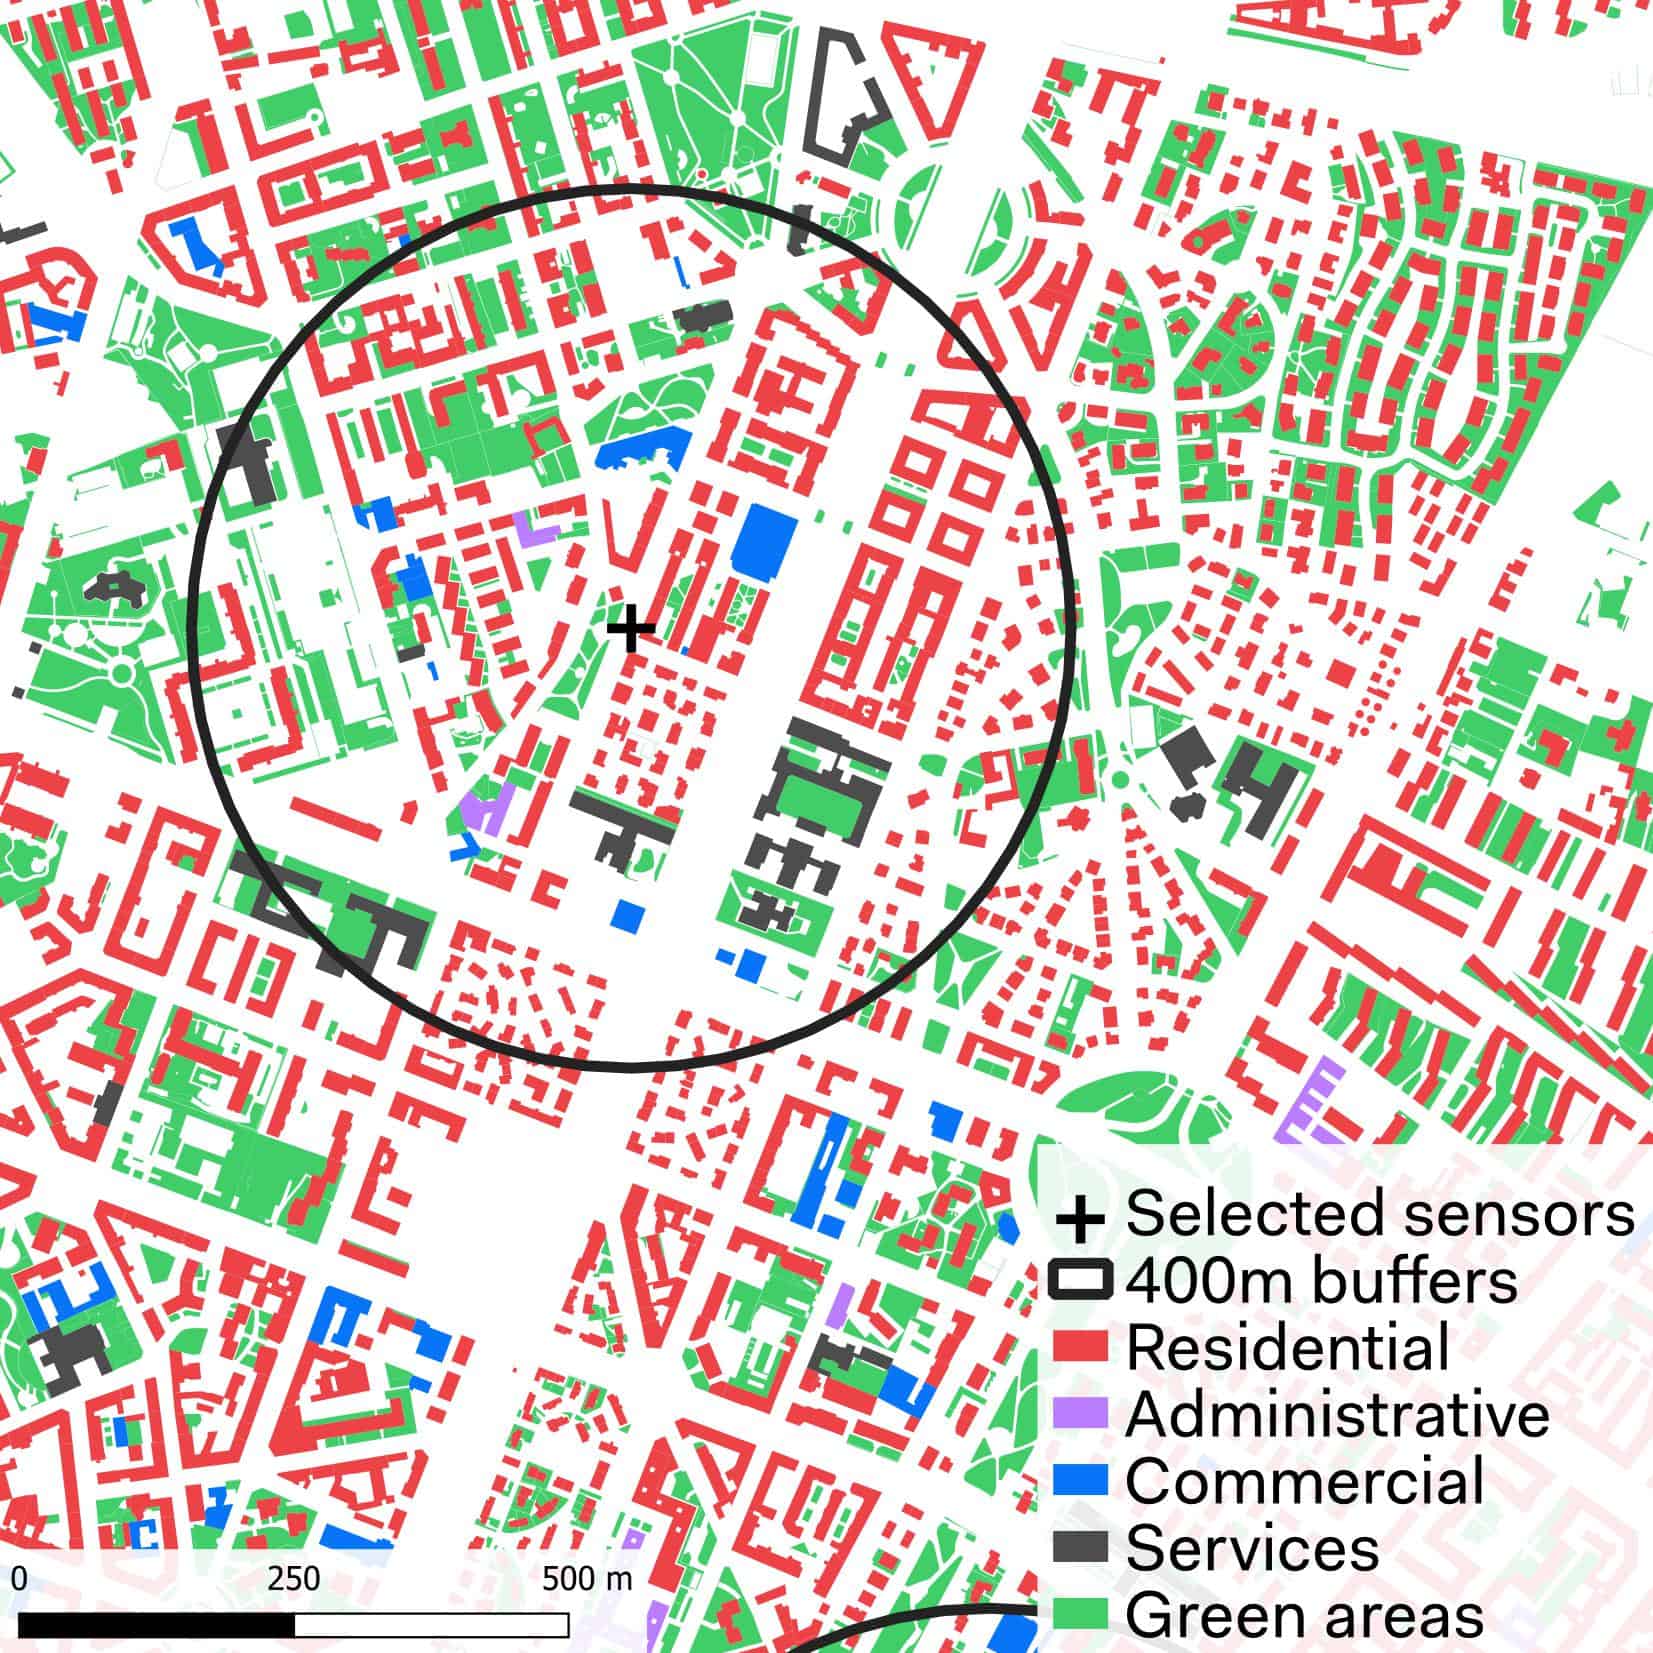
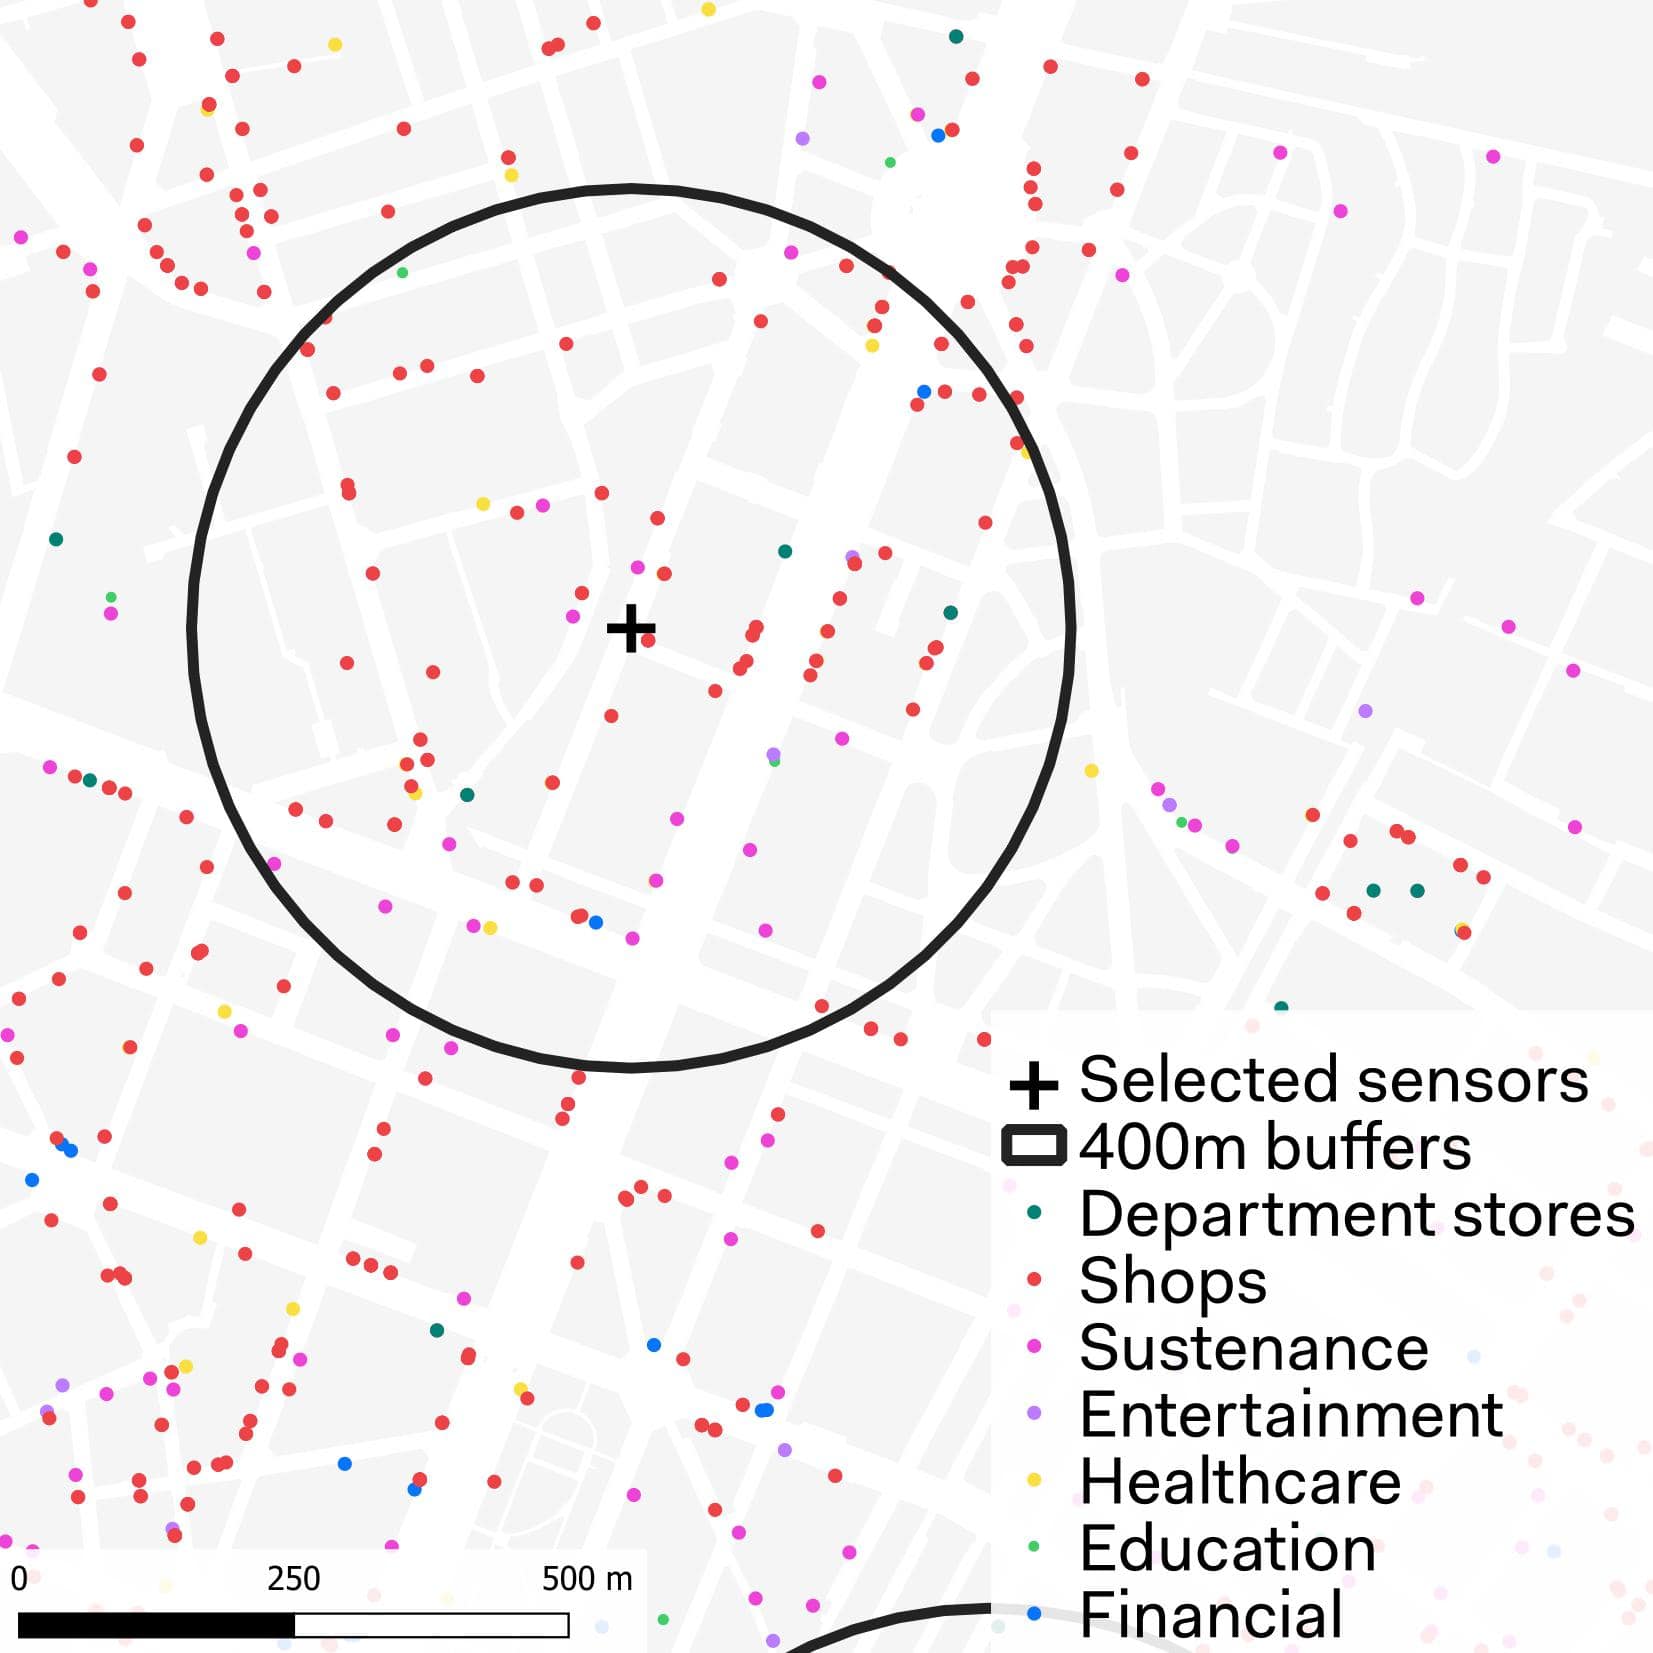
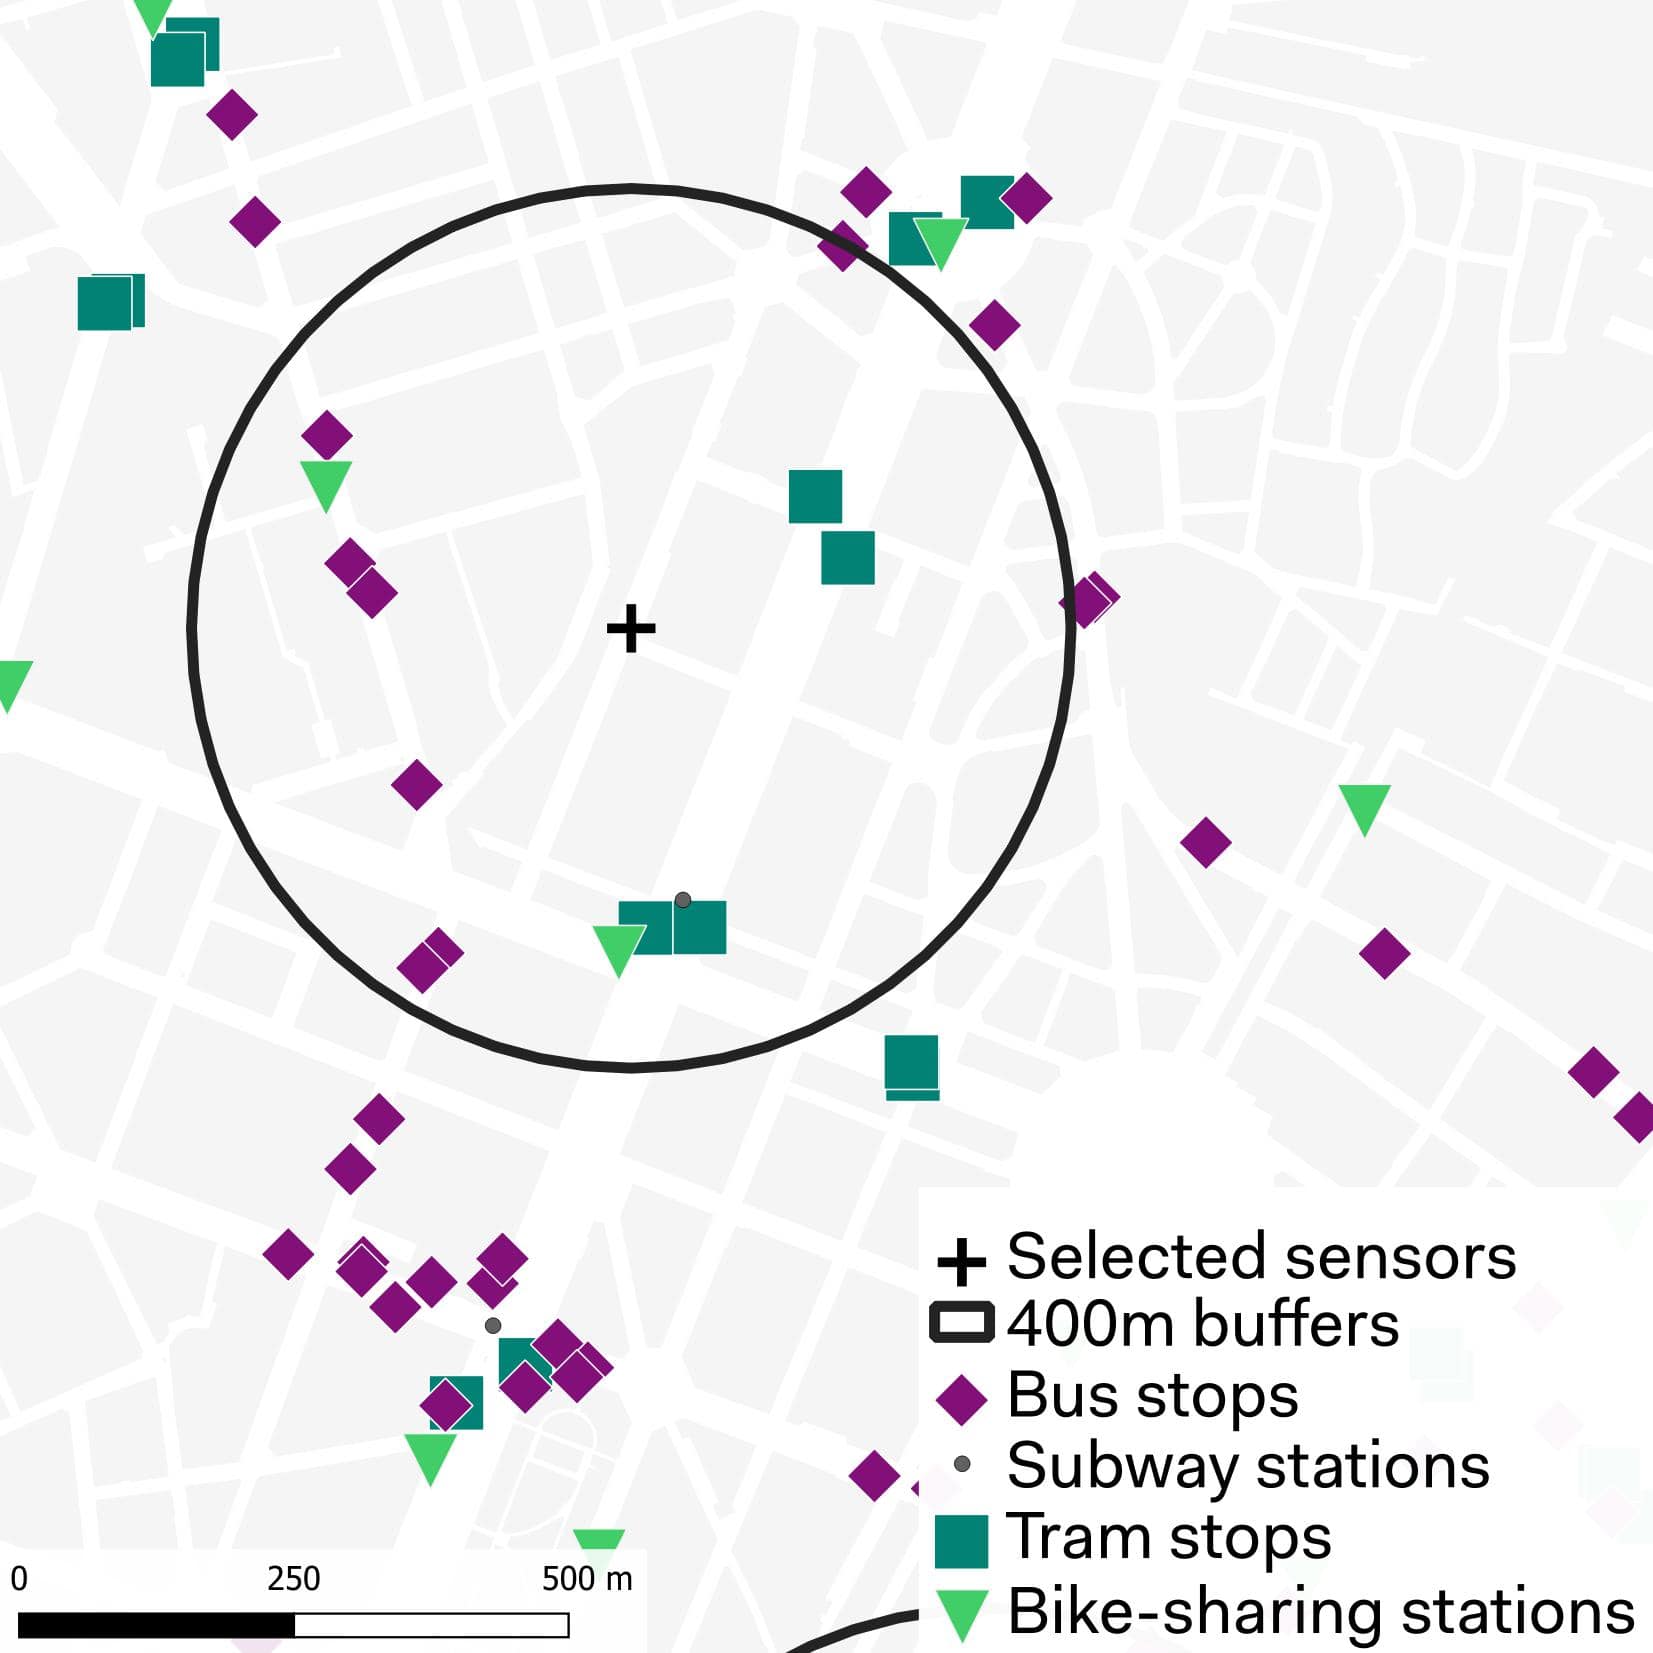
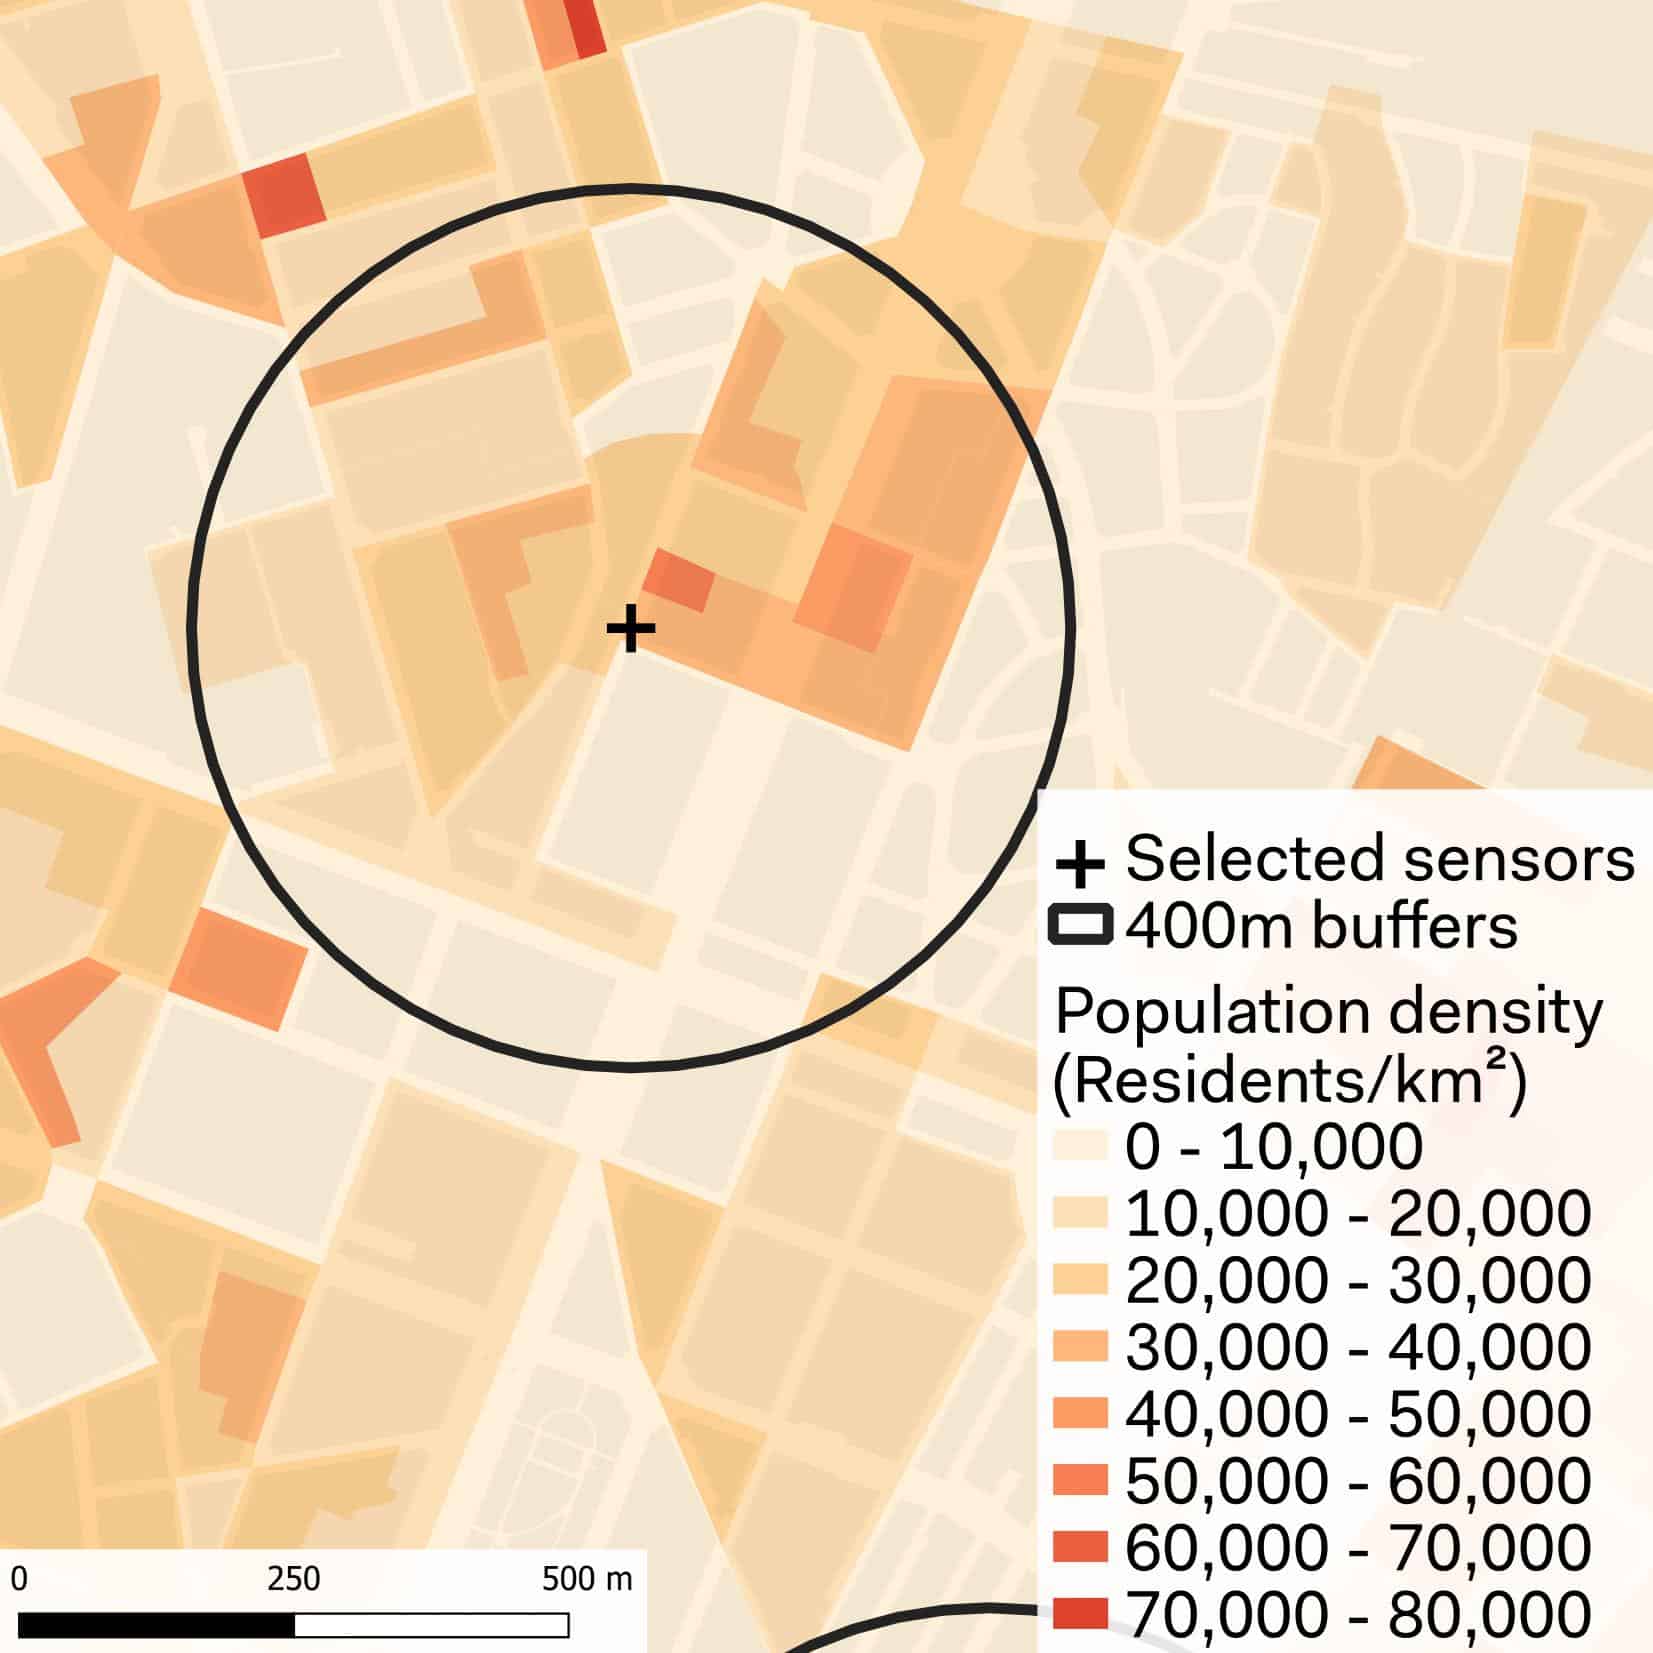
The count or area of these factors were measured in a 400m radius around each sensor (namely 5 minutes walking distance).
A series of correlation analyses (Pearson’s Correlation Coefficient) revealed a positive correlation between pedestrian counts and attractors, summarized in the table below. Moreover, results show that public transport services are often the most important factors for pedestrian flows, with particular reference to tram stops and bike-sharing docking stations.
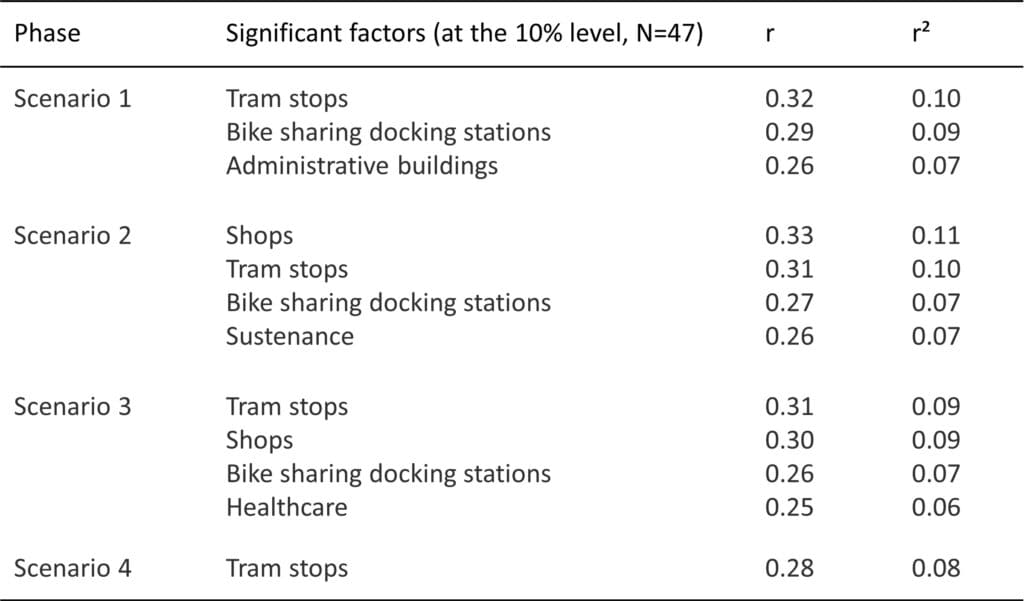
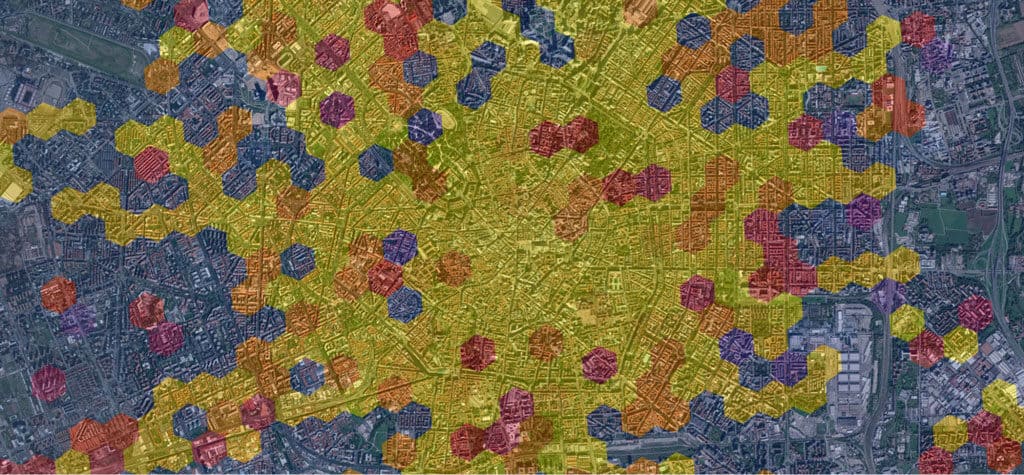
To assess and forecast potential pedestrian activity patterns a Suitability Analysis Index was constructed from the r values of Scenario 1, the one that likely resembles the medium-term future of Covid-19 restrictions.

The Z values are obtained by evaluating the amount of selected amenities (i.e., tram stops, bikesharing docking stations and administrative buildings), normalized on a 0-1 scale using a normal cumulative probability distribution function. The formula aboved is then used with i standing for every cell, resulting in the map below of the potentialities for relevant pedestrian activities around newspaper stands.
Conclusions and Future Work
Sensors-based techniques have been shown to be very effective for collecting traffic data of different users in urban areas, with decreasing costs and great progress being made on the A.I. powering those tools (Buch et al., 2011). However, their compliance with the General Data Protection Regulation (National Centre IOT and Privacy, 2020) is crucial for privacy and acceptability of this technology.
This research work was conducted with a large proprietary dataset of pedestrian counts, spanning a 9-month period (from November 2020 to the end of July 2021), collected by Blimp.ai through 47 sensors across Milan. Statistical analysis showed the sizable impact of the Covid-19 restriction measures on pedestrian activity. This method could be applied in real time to assess the effectiveness of those kinds of policies in the future.
A spatial statistical analysis showed that sensors close to tram stops, bikesharing stations and administrative buildings had higher pedestrian activities. Given that this spatial data is easily collectable for major cities, this study can be replicated in different contexts across the world. Future research could make use of more sensors and advanced analytical tools to accurately estimate the expected pedestrian activity in a city.
Acknowledgement
The analyzed data were treated according to the General Data Protection Regulation (EU, 2016/679). Systematica thanked the team of Blimp.ai (an e-Novia company) for their fruitful collaboration and for sharing data. This research received no specific grant from any funding agency in the public, commercial, or not-for-profit sectors.
References and Online Sources
Buch, N., Velastin, S.A. and Orwell, J. (2011). A review of computer vision techniques for the analysis of urban traffic. IEEE Transactions on Intelligent Transportation Systems, 12 (3), 920–939. https://doi.org/10.1109/TITS.2011.2119372
Comune di Milano and Agenzia Mobilità Ambiente Territorio (2020). Milan 2020. Adaptation Strategy. Comune di Milano, Milan (Italy). Available at: https://www.comune.milano.it/documents/20126/7117896/Open+streets.pdf/d9be0547-1eb0-5abf-410b-a8ca97945136?t=1589195741171
European Platform on Sustainable Urban Mobility Plans (2020). COVID-19 SUMP Practitioner Briefing. CIVITAS SATELLITE CSA. Available at: https://www.polisnetwork.eu/wp-content/uploads/2020/07/COVID-19-SUMPPractitionersBriefing_Final.pdf
Gorrini, A., Messa, F., Ceccarelli, G. & Choubassi, R. (2021). Covid-19 pandemic and activity patterns in Milan. Wi-Fi sensors and location-based data. TeMA – Journal of Land Use, Mobility and Environment, 14 (2), 211-226. https://doi.org/10.6093/1970-9870/7886
Foth, M., Choi, J.H.j., Satchell, C. (2011). Urban informatics. In: Proceedings of the ACM 2011 Conference on Computer Supported Cooperative Work, pp. 1–8. https://doi.org/10.1145/1958824.1958826
Li, W., Batty, M. and Goodchild, M.F. (2020). Real-time gis for smart cities. International Journal of Geographical Information Science, 34 (2), 311-324. https://doi.org/10.1080/13658816.2019.1673397
National Centre IOT and Privacy (2020). Physical Audience Measuring Technologies and Privacy Concerns. White Paper, v.01/2020. Available at: https://iotprivacy.it/wp-content/uploads/2020/06/Whitepaper-Physical-Audience-Measuring-Technologies-and-Privacy-Concerns-ENG.pdf
Schwertman, N. C., Owens, M. A., & Adnan, R. (2004). A simple more general boxplot method for identifying outliers. Computational statistics & data analysis, 47(1), 165-174. https://doi.org/10.1016/j.csda.2003.10.012
Systematica (2021). Shifting Paradigm: the impact of Covid-19 on transport planning. Systematica Srl. Available at :https://issuu.com/systematica/docs/covid19_sys_issuu