This article is based on the results of the study Milan sidewalks, in which the width of all the sidewalks of Milan has been mapped and narrow sidewalks were classified as inadequate to guarantee the correct social distancing measures necessary in this emergency situation to contain the COVID-19 virus.
As a preliminary step, the study identified that sidewalks that do not correspond to ensure correct social distancing requirements are approximately 1,400 km in length (45% of all sidewalks in Milan), which are too many to be able to intervene in a timely manner.
This article proposes a useful methodology for identifying the most at-risk areas of the city, where interventions to adapt the pedestrian infrastructure must become a priority.
The factors considered to determine the risk level of a specific area are undoubtedly multi-faceted. The methodology proposed in this study is intentionally simplified in order to identify more clearly the groups of users to whom we ought to focus our attention in a pandemic phase. More complex factors can undoubtedly be part of further developments of the methodology and are worth more in-depth studies.
Methodology
Of all the elements that contribute to determining the level of risk for a given area, two main factors were considered in this study:
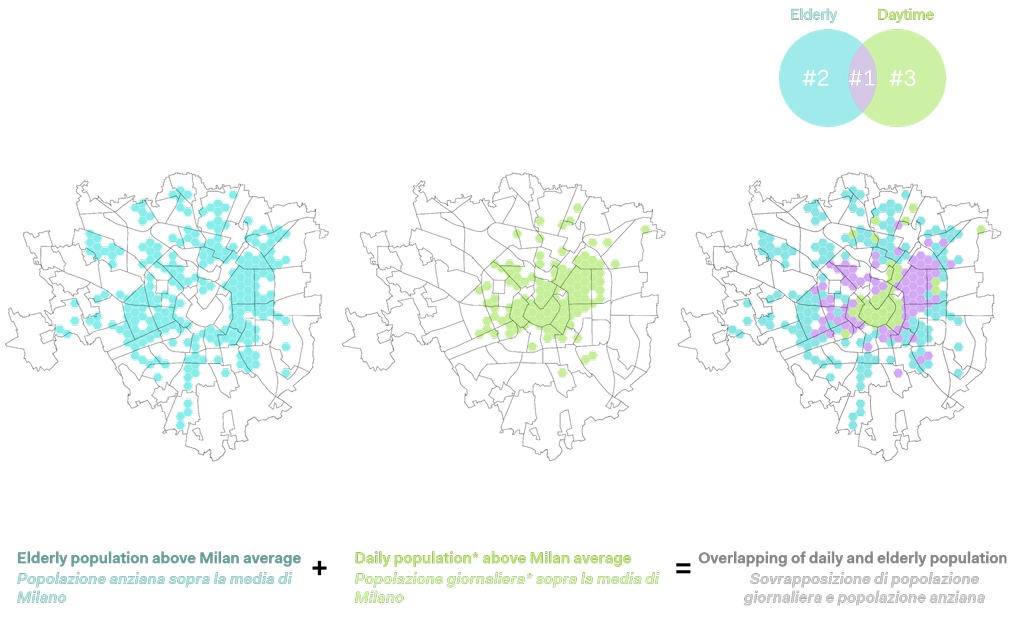
1)Elderly population: the density of the elderly population over the age of 70. This is in fact the slice of the population most at risk: 89% of the patients who died and were positive for COVID-19 fell under the age group of Over 70 (source: the National Institute of Health – Istituto Superiore della Sanità).
2)Daily population: this figure indicates the daily active population for the different areas in terms of residents who stay at home, students and employees who travel to the workplace. This information essentially identifies the densest and most crowded areas during the day.
The areas in which priority interventions are indentified will therefore be those with a greater Over 70 population density, areas with greater density of daily populations, or both.
*residenti a casa + addetti + studenti
Population and unsafe sidewalks
The graph is the result of the intersection of three pieces of information: the distribution of unsuitable pavements, the elderly population over 70 and the daily population for each neighbourhood. This overlap allows us to observe that 65% of the unsuitable pavements that are narrower than 2.4 meters, are concentrated where the majority of the population lives and works (to be exact, where 80% of the elderly population of over 70 and 80% of the daily population live).

Identification of key districts

Priority of interventions
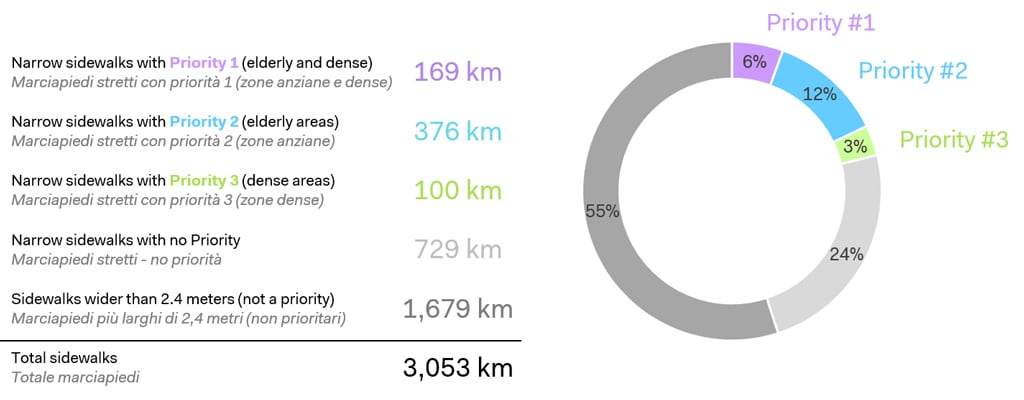
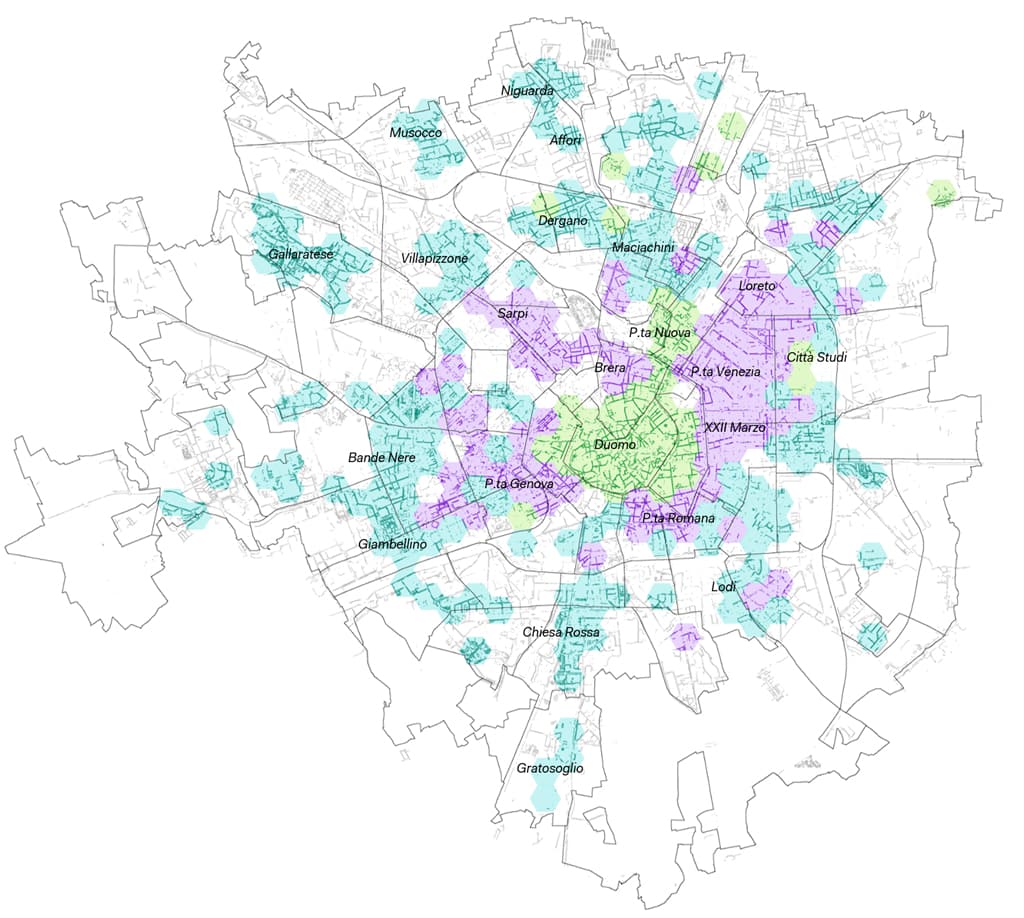
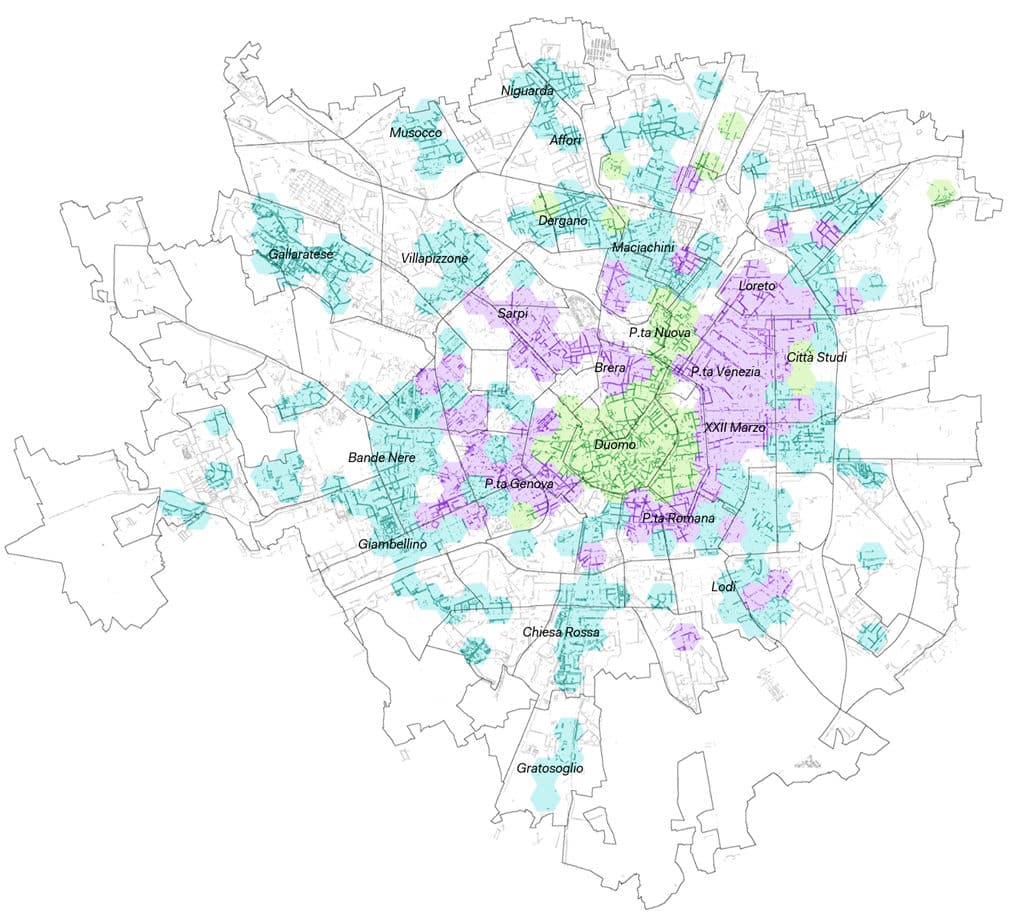
By overlapping very dense areas (in terms of both active population and the elderly), a map of the intervention priorities was obtained for those pavements classified as unsuitable (with a width of less than 2.4 meters). Three priority levels are thereby identified:
1) Priority 1: pavements located in very dense areas where there is a high number of both the elderly and daily populations. Among these areas, the districts between the first and second ring roads stand out, such as Loreto, Porta Venezia, XXII Marzo, Porta Romana, Porta Genova, Sarpi.
2) Priority 2: sidewalks in areas where there is a high density of older populations than the city average. These include some historic and mainly residential neighborhoods such as: Gallaratese, Villapizzone, Musocco, Niguarda / Affori, Maciachini, Lodi, Gratosoglio, Chiesa Rossa, Giambellino and Bande Nere.
3) Priority 3: sidewalks in areas where there is a high presence of daily populations. Among these areas, areas that are particularly active during the day stand out, such as: Duomo, Città Studi and Porta Nuova.