As global temperatures continue to rise, urban populations, surrounded by heat-retaining surfaces and limited natural cooling, are increasingly exposed to thermal discomfort and health risks. Thermally comfortable outdoor environments are essential for supporting walking, lingering, and everyday activity in cities. Yet the drivers of outdoor thermal comfort, such as vegetation, sky enclosure, shading, and material properties, interact in complex ways and are difficult to quantify or understand at scale. This study integrates microclimate modelling with street-level imagery and computer vision to (i) assess how street-level images can support estimating thermal comfort and (ii) identify how different urban design elements correlate with thermal conditions. Physiological Equivalent Temperature (PET) is estimated using UMEP and linked to visual and morphological features extracted from street-level images across Milan. By analyzing these relationships, the study provides evidence-based insights to guide climate-resilient urban design and planning.
Click here to explore the data through our interactive map.
Introduction
Rising urban temperatures and persistent heat-retaining surfaces expose residents to growing thermal discomfort and health risks (Oleson et al, 2015; Luber et al, 2006). As a result, outdoor thermal comfort (OTC) has become a central concern for urban design and planning, requiring cities to both mitigate overheating and adapt public spaces for year-round comfort and inclusivity.
Understanding how urban form influences OTC is a challenging task, shaped by numerous interrelated environmental, material, and morphological factors (Aghamolaei et al, 2023). Conventional methods, such as remote sensing, field measurements, or simulation models, have provided valuable insights but tend to rely on a multitude of data that are often not available or easy to collect.
Meanwhile, vast repositories of street-level imagery have become increasingly available, offering a detailed, pedestrian-level view of urban environments (Biljecki and Ito, 2021). These images contain a wealth of visual information on features that may influence thermal comfort, including vegetation, shading, materials, sky view, and signs of human presence (Urban et al., 2022). When combined with computer vision methods, they can offer a scalable, cost-effective means of capturing fine-grained indicators of the built environment and its climatic qualities.
Building on this potential, the study introduces a three-step analytical pipeline to examine how urban features relate to outdoor thermal comfort (OTC). First, thermal conditions are assessed by estimating Physiological Equivalent Temperature (PET) for selected locations in Milan on 25 August 2019, capturing the average physiological response to local microclimates. PET is computed using the open-source Urban Multi-scale Environmental Predictor (UMEP), which incorporates the SOLWEIG radiation model to estimate spatially varying three-dimensional radiative fluxes and mean radiant temperature (Lindberg et al, 2008; Ratti et al., 2006). Second, street-level imagery and pre-trained computer vision models are used through the open-source software ZenSVI (Ito et al., 2025), to detect and quantify diverse urban features, capturing the visual and morphological complexity of streets from a pedestrian perspective. Complementary dynamic variables, such as building shadows, solar geometry, and hourly radiation profiles, are also modelled to account for dynamic characteristics impacting thermal comfort that cannot be captured in static imagery. Finally, a series of two-tailed Welch’s t-tests, correlation analyses, and prediction models are employed to examine how these features relate to PET values and to evaluate how well feature-based predictions can approximate measured thermal conditions.
Applied in Milan, Italy, the approach demonstrates how object detection and image segmentation can capture visual proxies of thermal comfort and translate them into evidence-based strategies for climate-adaptive urban design and policy. Our analysis further reveals that specific spatial configurations and visual characteristics of the built environment are systematically associated with more favourable thermal conditions. These insights enable the formulation of practical, data-driven recommendations for urban planning, supporting decision-makers in advancing resilience and liveability at the street scale.
Enabling Data and Methodology
Thermal Comfort Analysis
Taking advantage of a previous analysis conducted by Transform Transport (2023), thermal comfort is estimated through the Physiological Equivalent Temperature (PET) using the UMEP tool. The PET values serve as the reference thermal comfort indicator in this study, given the wide adoption and validation of the UMEP framework in urban climate research. This step integrates multiple data categories: meteorological variables (i.e., temperature, solar radiation, humidity, precipitation, cloud cover, wind), spatial datasets (i.e., digital surface models, sky view factor, wall geometry), environmental parameters (surface materials, albedo, emissivity), and human-parameter settings required for PET computation. UMEP combines these climate, spatial, and biophysical inputs to estimate PET values for selected locations in Milan. The resulting PET values are then analyzed to assess how thermal conditions change throughout the day. In particular, we examine the distribution of PET values across locations and study how PET values at different hours relate to each other. While PET is a model-derived indicator rather than direct in-situ measurement of thermal perception, it provides a standardized and extensively validated proxy for assessing spatial variation in outdoor thermal stress.
Street-level Images Analysis
The second step of the analysis consists of three sub-parts: (i) collecting images from Google Street View representing different locations in Milan; (iii) applying deep learning computer vision models to extract urban features from these images; and (iii) synthesizing the extracted features at the location level.
To collect the images, we first obtained the pedestrian street network from OpenStreetMap for the study area in Milan. We then generated a set of locations along the street network at 20-meter intervals. For each location, four street-level images were retrieved from Google Street View, capturing the front, back, left, and right views and providing a consistent pedestrian-scale representation of the urban environment.
To extract location-based features from the street-level images, we employed three pre-trained deep learning models: Mask2Former for semantic segmentation (Cheng et al, 2022), Place Pulse for urban perception assessment (Salesses, 2012) , and a scene classification model trained on Places365 dataset (Zhou et al, 2017). All models were implemented using the ZenSVI Python package, which provides an integrated framework for large-scale street view image acquisition and analysis (Ito et al., 2025).
Running these models on our images yielded a diverse set of location-based features, including pixel-level semantic measures (e.g., proportions of vegetation, buildings, roads, sidewalks, and sky), scene-level classifications (e.g., residential streets, commercial areas, parks), and perception-based scores reflecting how safe, lively, or aesthetically pleasing a location is perceived to be. To consolidate these image-derived features at the location level, we aggregated the results using four summary statistics: maximum, minimum, mean, and sum.
Dynamic Street-level Features
To capture the dynamic nature of thermal comfort, we estimated additional time-varying variables related to building shadows, solar geometry, and hourly radiation profiles. Building shadows were derived using a 3D buildings dataset from the geoportal of the Lombardy Region and from 10:00 to 17:00. We developed an algorithm that accounts for the sun’s position at a given date and hour and casts a ray from the sun toward each sampled location. If the ray intersects a building, the location is classified as being in shadow at that time. Repeating this process at an hourly resolution, we estimate the fraction of each hour during which a location remains in the shadow. In parallel, we estimated the hourly solar geometry and radiation variables, the sun elevation, azimuth, cosine of the solar zenith angle, Global Horizontal Irradiance (GHI), Direct Normal Irradiance (DNI), Diffuse Horizontal Irradiance (DHI), and the diffuse radiation fraction. These variables complement the shadow estimates and enable a more detailed representation of the temporal variability.
Linking Urban Features with Thermal Comfort
Correlation analysis identifies which individual design elements are associated with higher or lower thermal comfort. Building on this, we cluster features across different PET ranges to uncover recurring combinations of urban characteristics that collectively correspond to thermally comfortable or uncomfortable environments.
We assign each image to a thermal comfort group (i.e., moderate stress: 29.1–35, strong stress: 35.1–41, extreme stress: > 41.1 °C) through spatial overlap with PET values. Using the previously derived semantic segmentation outputs, we then analyze the presence of urban features (i.e., road, sidewalk, building, vegetation, terrain, sky) by image viewing direction (i.e., front, back, left, right). We then apply two-tailed Welch’s t-tests to assess statistically significant differences in feature presence across PET groups, with Bonferroni correction applied across all 18 comparisons (i.e., adjusted α = .0028).
Finally, we train an XGBoost machine-learning model to assess the extent to which PET values can be approximated using our image-extracted and dynamic features. Given the number of statistical comparisons performed, significance levels should be interpreted cautiously. To reduce the likelihood of false positives, we focus primarily on associations that are both statistically significant and of at least moderate effect size (|r| > 0.30), rather than relying on p-values alone.
Results
Thermal Comfort Analysis
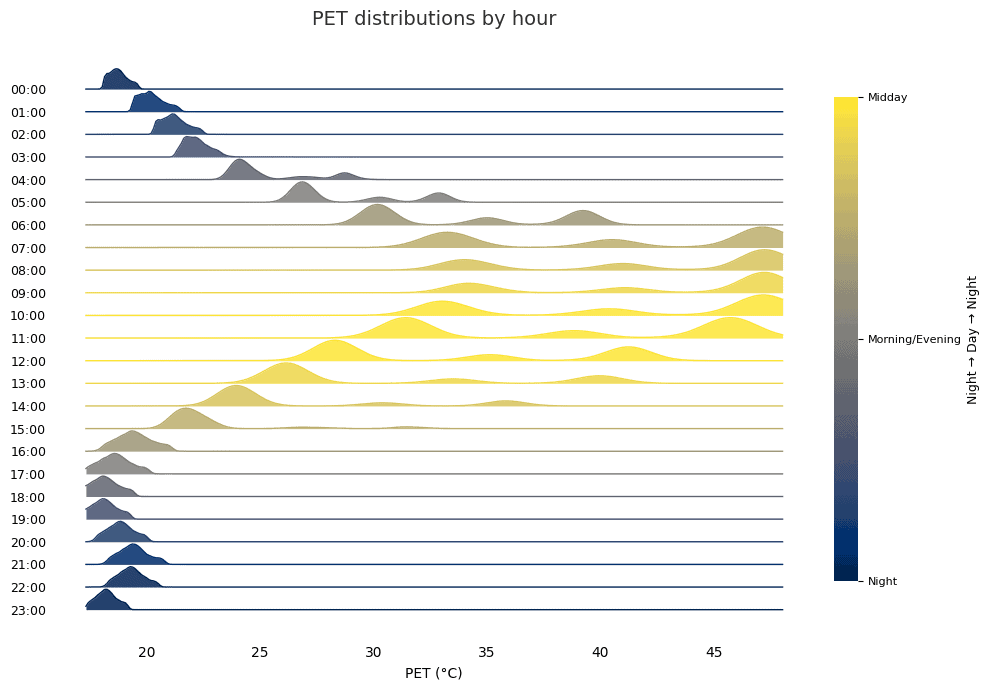
When we look at how thermal comfort varies across locations within our area of interest, we see clear differences between daytime and nighttime (see Figure 1). At night and in the early morning (20:00–07:00), most places in the city feel fairly similar, with temperatures clustering around a comfortable range (18–20 °C). Only a few locations feel noticeably warmer or cooler. During the day (08:00–19:00), however, conditions differ much more from place to place. Some streets become much hotter than others, creating three distinct groups of cooler and warmer locations across the city.
These differences also change quickly over time during the day (see Figure 2). A place that feels relatively hot at noon may not feel especially hot one or two hours later, because sunlight, shade, and shadows shift as the sun moves. At night, by contrast, conditions remain much more stable over time.
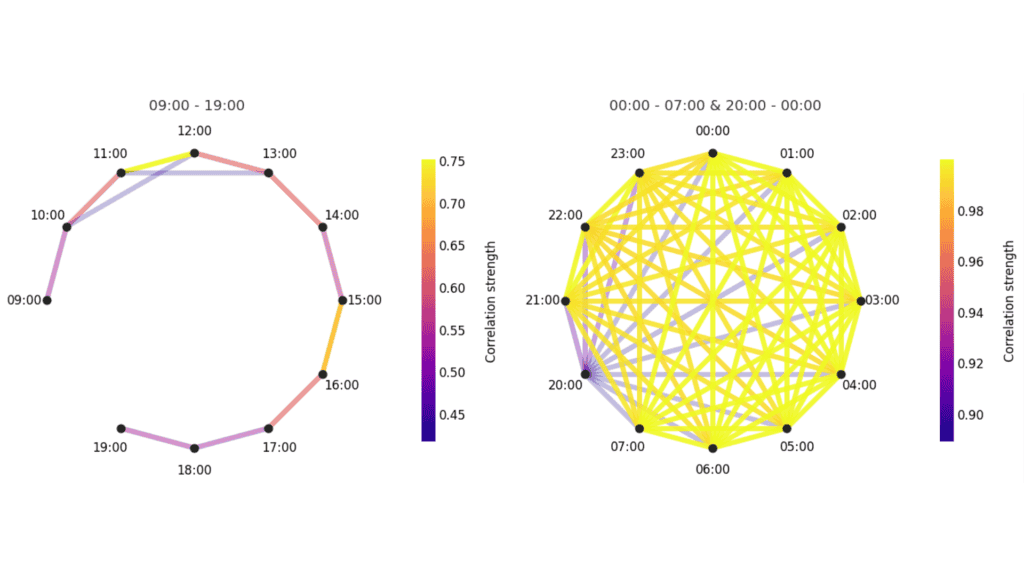
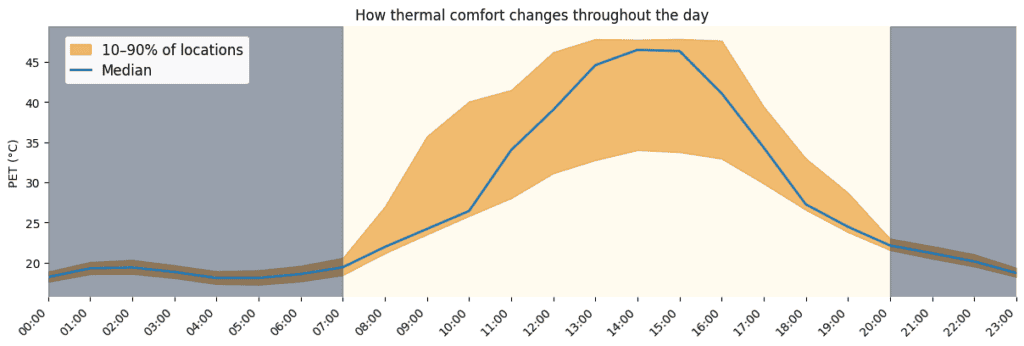
Overall, this shows that daytime thermal comfort is strongly influenced by dynamic factors such as sun exposure and shading, which change from hour to hour. Nighttime thermal comfort is more stable, and it is expected to be shaped to a greater extent by static features of the urban environment. These patterns are also evident when looking at the daily patterns of thermal comfort across locations (see Figure 3).
Street-level Images Analysis
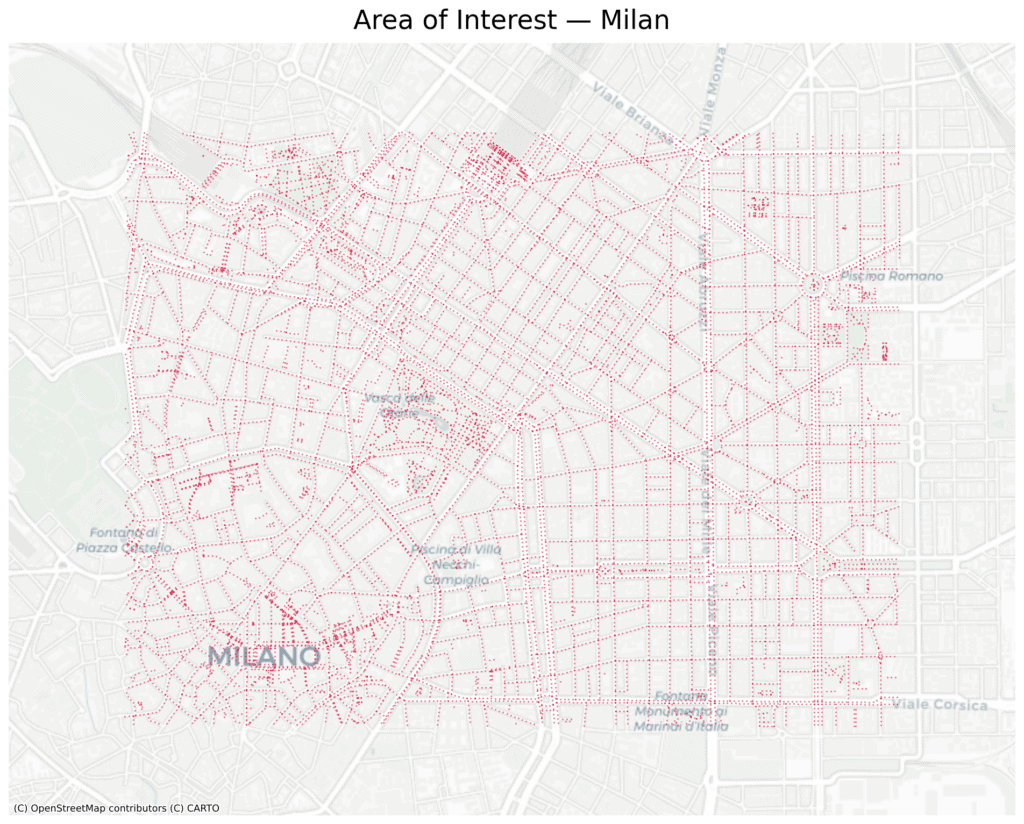
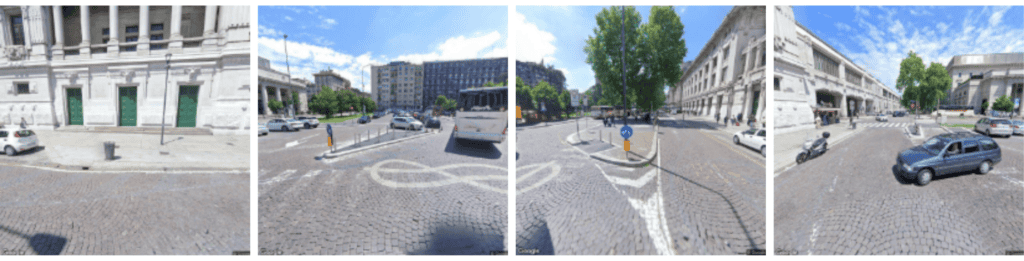
Applying the procedure described in the Enabling Data and Methodology section resulted in a dense and spatially consistent set of observation points along Milan’s pedestrian street network, sampled at 20-meter intervals (Figure 4). For each point, four street-level images were successfully retrieved from Google Street View, capturing forward, backward, left, and right views (see Figure 5). Together, these images provide a comprehensive pedestrian-scale depiction of the surrounding urban environment across the study area, forming the empirical basis for the subsequent feature extraction and analysis.
Using ZenSVI, we derived a diverse set of urban features from the street-level images (see Figure 6 for examples of the semantic segmentation and scene classification outputs). Then, we investigated which of these features correlate with the thermal comfort values. These correlations could indicate: (1) how urban design features associate with thermal comfort across locations, and (2) how relevant are image-based extracted features for estimating thermal comfort.
Dynamic Street-Level Features Estimation
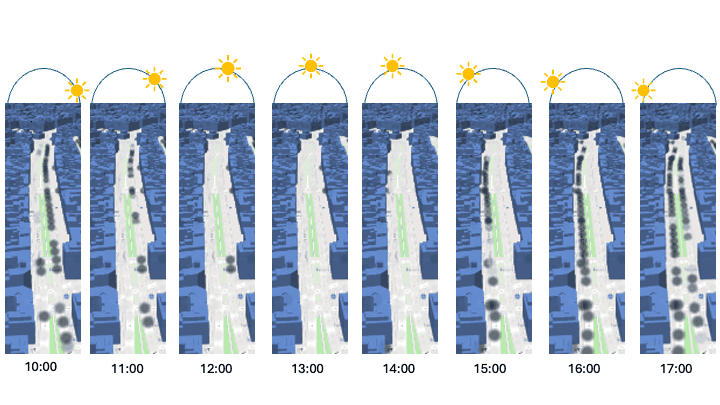
Following the estimation of the dynamic street-level features, we obtained a set of hourly solar geometry and radiation variables—such as sun elevation and azimuth, the cosine of the solar zenith angle, and GHI, DNI, and DHI—that are common across all locations for a given hour. In parallel, we derived location-specific shadow profiles by estimating, at an hourly resolution, the fraction of time each sampled point remains in building shade. As a result, while solar conditions vary only temporally, shadow patterns exhibit pronounced spatial heterogeneity driven by the surrounding built form, as illustrated for an example street segment in Figure 7.
Correlation, Prediction, and Clustering
Correlation
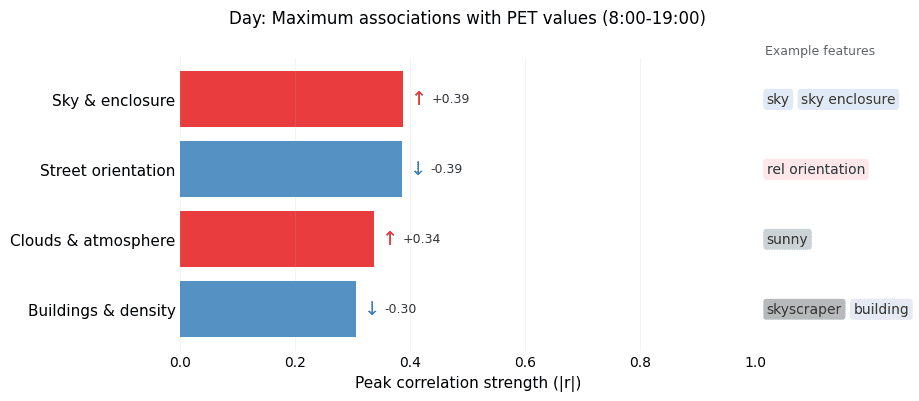
During daytime hours, the correlation analysis suggests that image-derived features have limited explanatory power for hourly PET values (see Figure 8). Three feature groups exhibit weak to moderate associations: sky and cloud-related features capturing the proportion of visible sky, street-orientation measures reflecting alignment with solar exposure, and building-related features indicating the degree of built coverage in the images. However, these correlations remain modest (r ≈ 0.30–0.39), underscoring that the pronounced temporal variability of PET throughout the day cannot be adequately captured by static, image-based characteristics.
During nighttime hours, the results tell a different and clearer story. The correlation analysis shows moderate to strong relationships between image-derived features and hourly PET values, with coefficients ranging from 0.30 to 0.66 (see Figure 9). Sky-related features exhibit a negative correlation, indicating cooler nighttime conditions in locations with greater sky exposure, while vegetation and tree presence are positively correlated with PET. One possible explanation is that locations with greater vegetation also tend to exhibit higher sky exposure, which may enhance radiative cooling at night. However, disentangling these interacting morphological effects would require more targeted modelling. Perceptual attributes—such as places appearing suitable for relaxation or for sports—also show positive associations, suggesting that visually inferred qualities capture meaningful aspects of the nighttime thermal experience. In contrast, surface and built-environment characteristics, particularly asphalt coverage and building presence, are negatively correlated with PET, pointing to the influence of urban materials and morphology on nighttime cooling dynamics.
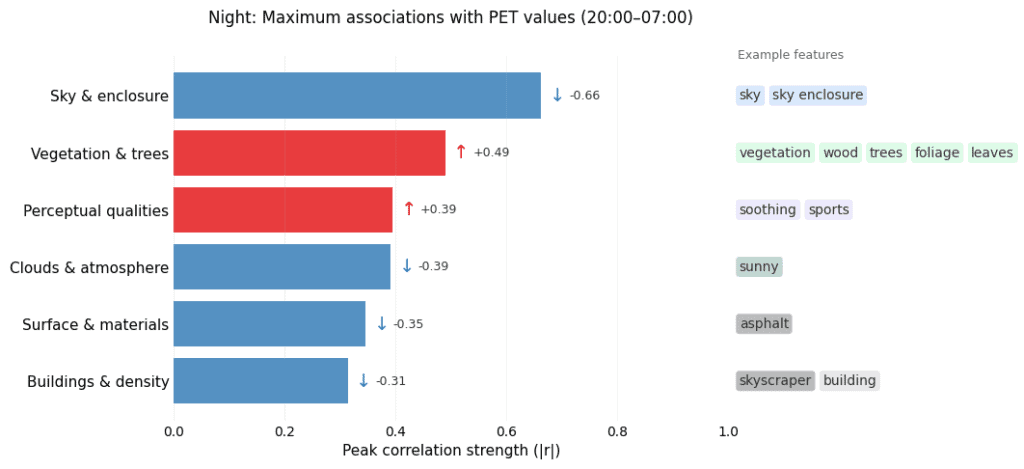
Table 1 and Table 2 outline the mean and standard deviation of selected urban features, and the results of pairwise two-tailed Welch’s t-tests across PET groups, Bonferroni-corrected for 18 comparisons (adjusted α = .0028). Front-facing images reveal statistically significant differences across PET groups for most urban features (i.e., road, building, vegetation, terrain, sky). Buildings, vegetation, and sky exhibit highly significant differences in most pairwise comparisons, suggesting a strong association between visual composition and thermal conditions. Notably, building proportion is the only feature among these three where one comparison does not survive correction (35–41°C vs >41°C), indicating greater similarity between these two groups. In terms of directionality, road proportion increases with higher PET while building proportion decreases, suggesting that hotter urban environments are characterized by greater street exposure but less building coverage in the visual field. Road presence differs significantly only when comparing the highest PET group (>41°C) with lower ranges, suggesting that street exposure becomes distinctive primarily under extreme heat conditions. Terrain shows significant differences only when comparing the <35°C and >41°C groups, suggesting a limited association with thermal conditions. In contrast, sidewalk and building (35–41°C vs >41°C) presence do not show statistically significant differences after correction, suggesting relative consistency across those temperature ranges.
| Environmental Feature | <35°C M (SD) | 35-41°C M (SD) | >41°C M (SD) |
| Road | 0.38 (0.09) | 0.40 (0.05) | 0.47 (0.05) |
| Sidewalk | 0.05 (0.04) | 0.03 (0.03) | 0.04 (0.04) |
| Building | 0.42 (0.09) | 0.14 (0.12) | 0.22 (0.10) |
| Vegetation | 0.001 (0.004) | 0.001 (0.003) | 0.003 (0.006) |
| Terrain | 0.009 (0.034) | 0.007 (0.014) | 0.004 (0.005) |
| Sky | 0.003 (0.004) | 0.003 (0.004) | 0.006 (0.006) |
Table 1 Descriptive Statistics for Environmental Feature Presence Across Temperature Groups
| Environmental Feature | <35 vs 35-41 | <35 vs >41 | 35-41 vs >41 |
| Road | t(85)=-1.36, p=.176, d=-0.27 | t(103)=-7.09, p<.001*, d=-1.21 | t(51)=-5.80, p<.001*, d=-1.25 |
| Sidewalk | t(70)=2.11, p=.039, d=0.44 | t(130)=1.59, p=.115, d=0.27 | t(57)=-0.87, p=.390, d=-0.18 |
| Building | t(44)=11.58, p<.001*, d=2.68 | t(143)=12.57, p<.001*, d=2.08 | t(46)=-3.41, p=.001*, d=-0.76 |
| Vegetation | t(30)=-16.93, p<.001*, d=-4.32 | t(109)=-5.65, p<.001*, d=-0.91 | t(35)=14.41, p<.001*, d=3.47 |
| Terrain | t(29)=-3.03, p=.005, d=-0.78 | t(109)=-5.65, p<.001*, d=-0.91 t(78)=-4.76, p<.001*, d=-0.76 | t(107)=-2.61, p=.010, d=-0.45 |
| Sky | t(81)=7.59, p<.001*, d=1.37 | t(128)=-10.80, p<.001*, d=-1.76 | t(86)=-17.39, p<.001*, d=-2.81 |
Table 2 Pairwise Welch’s T-Test Comparisons for Environmental Feature Presence Across Temperature Groups
Overall, our results are well aligned with previous literature (Hu et al, 2024). They further suggest that during daytime hours the influence of direct solar exposure and shading is so dominant that image-derived urban features play a secondary role, becoming relevant mainly insofar as they relate to shadowing conditions. At night, however, thermal conditions are more stable and less driven by rapidly changing solar dynamics, allowing the static urban features captured in the images to become substantially more informative of PET patterns.
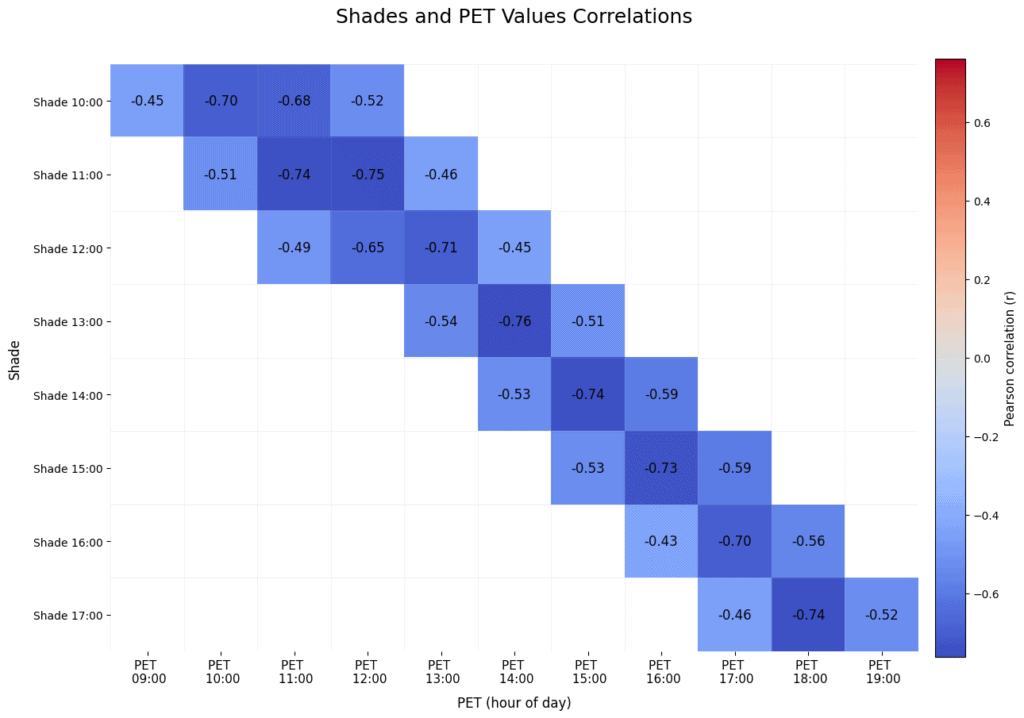
Examining the relationship between dynamic features and daytime PET values reveals a strong association between estimated hourly shading and thermal comfort, further reinforcing the dominant role of shadows relative to other factors (Figure 10). Correlations peak when shadow conditions are evaluated one hour prior to the corresponding PET values (r ≈ 0.70–0.76), weaken when considering shadows one hour earlier or later (r ≈ 0.43–0.68), and largely vanish at temporal offsets of two hours or more. This temporal sensitivity closely mirrors the PET dynamics described in the Thermal Comfort Analysis section, providing consistent evidence of the primacy of shading effects during daytime conditions.
Prediction
To understand how well street-level characteristics can explain hourly thermal comfort, we tested whether our data can predict how hot or comfortable a place feels at different times of the day and night. To do so, we trained two machine-learning models (XGBoost regressors) to estimate the PET values for each location and hour for daytime and nighttime.
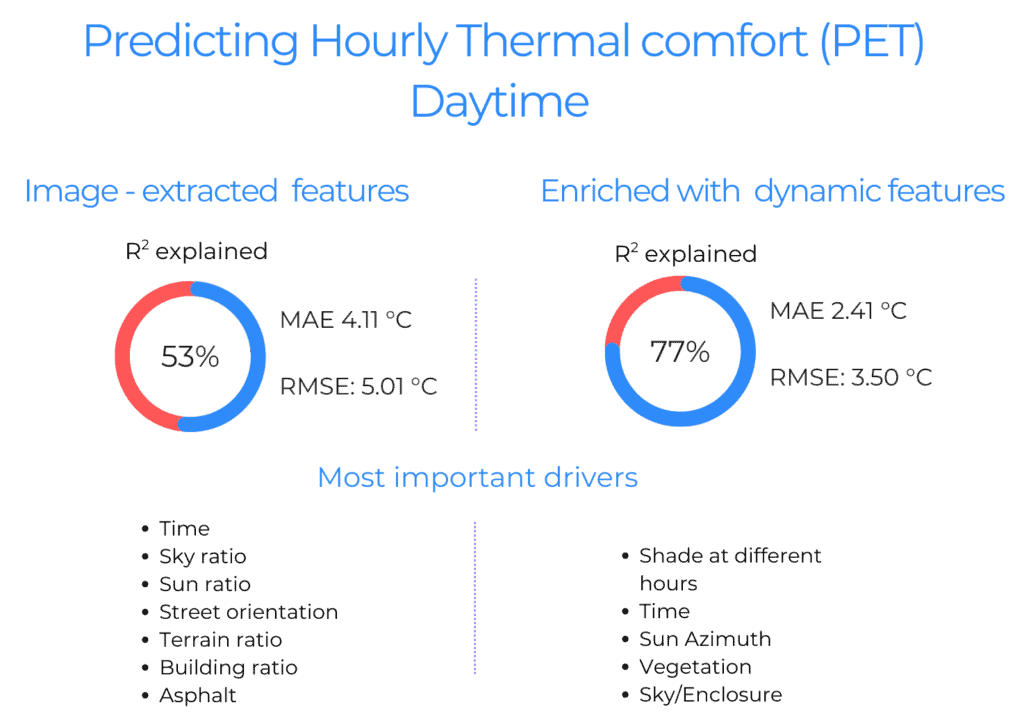
As a first step, the model relied only on features extracted from street-level images, such as visible vegetation, buildings, sky openness, and other perceptual and physical attributes, without using any explicit weather or time-dependent information (apart from the hour). With this limited information, the model explained about 53% of the variation in hourly PET values during the day (R² = 0.53). On average, its predictions were within 4.1 °C (MAE) of the observed values, with most errors falling within 4–5 °C (RMSE). The results show that hourly thermal comfort is driven mainly by the time of day and street-level exposure to the sun and sky, with street orientation and the balance between buildings and terrain shaping how heat is absorbed, shaded, and retained. These results are aligned with previous literature (Hu et. al, 2024).
When we enriched the model with dynamic, time-dependent features (see Figure 11), its performance improved substantially, explaining 77% of the variation in hourly thermal comfort during daytime while reducing the average error to 2.3 °C (MAE) and most errors to within 3.4 °C (RMSE).
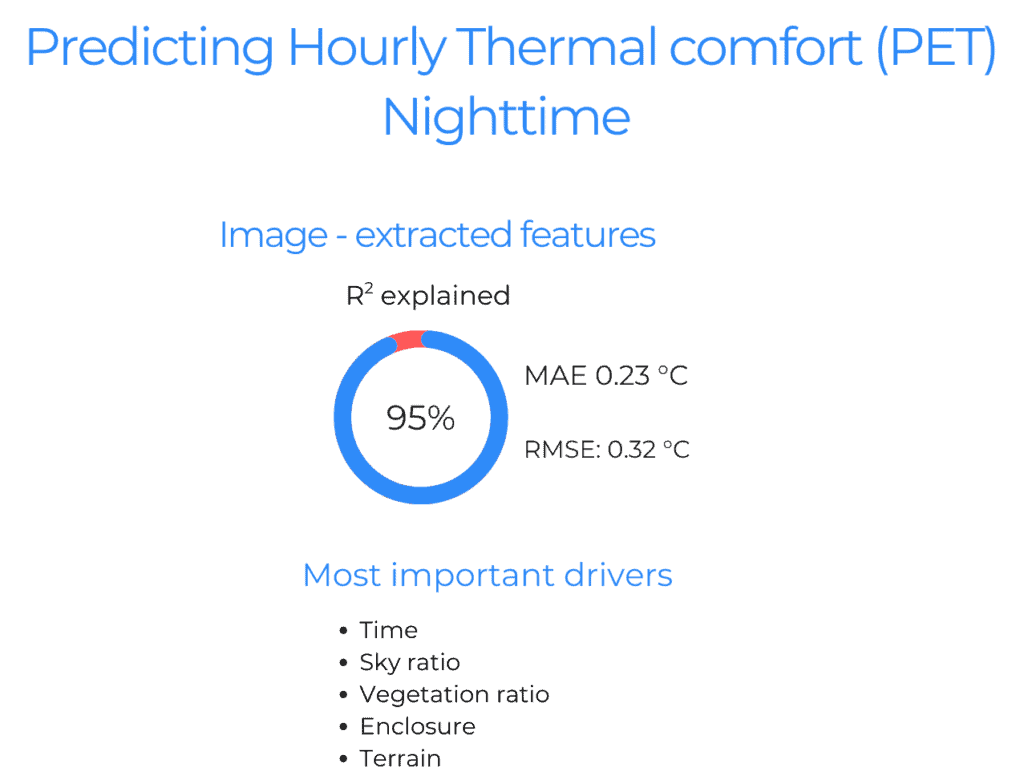
During nighttime hours, model performance further increases, explaining up to 95% of the variation in PET. However, much of this explanatory power is already captured by time alone, which accounts for approximately 82% of the variance, reflecting the relatively uniform but clearly structured hourly evolution of nighttime thermal conditions (see Figure 12). Urban design features—such as sky view factor, enclosure, and vegetation—contribute additional explanatory power by capturing spatial differences between locations within each hour. In other words, while time governs the overall temporal trajectory of nighttime PET, static urban characteristics help explain why some streets remain warmer or cooler than others under the same atmospheric conditions.
Conclusions and Future Work
This analysis indicates that thermal comfort in urban environments cannot be treated as a static condition but differs fundamentally between daytime and nighttime hours. Urban characteristics that might generally be expected to decrease thermal stress, such as vegetation or sky openness, can have the opposite effect during daylight hours by increasing direct solar exposure and eliminating shade. This highlights the need for urban design and planning approaches that explicitly account for diurnal dynamics, rather than relying on uniform assumptions about comfort throughout the day.
From a modelling perspective, the results show that image-extracted features capture a substantial share of spatial variation in thermal comfort during non-solar hours. The same does not apply during solar hours. However, incorporating a small set of dynamic, time-dependent features—most notably those related to solar exposure and shading—leads to markedly improved performance. This suggests that reliable estimation of street-level thermal comfort can be achieved using relatively lightweight data inputs, combining street-level imagery with basic 3D urban geometry, while still capturing the key temporal processes that shape thermal experience.
Acknowledgments
This research received no specific grant from any funding agency in the public, commercial, or not-for-profit sectors. The analyzed data were treated according to the GDPR-General Data Protection Regulation (EU, 2016/679). During the preparation of this work, the authors used ChatGPT to initially structure the python code, and enhance clarity, coherence, and readability of the manuscript text. After using these tools/services, the authors manually reviewed and thoroughly edited all generated outputs and take full responsibility for the content of the research and publication. Mention of trade or commercial products does not constitute endorsement or recommendation by the authors.

References
Aghamolaei, R., Azizi, M. M., Aminzadeh, B., & O’Donnell, J. (2023). A comprehensive review of outdoor thermal comfort in urban areas: Effective parameters and approaches. Energy & Environment, 34(6), 2204-2227. https://doi.org/10.1177/0958305X22111617
Biljecki, F., & Ito, K. (2021). Street view imagery in urban analytics and GIS: A review. Landscape and Urban Planning, 215, 104217. https://doi.org/10.1016/j.landurbplan.2021.104217
Cheng, B., Misra, I., Schwing, A. G., Kirillov, A., & Girdhar, R. (2022). Masked-attention mask transformer for universal image segmentation. In Proceedings of the IEEE/CVF conference on computer vision and pattern recognition (pp. 1290-1299). https://bowenc0221.github.io/mask2former
Lindberg, F., Holmer, B., & Thorsson, S. (2008). SOLWEIG 1.0–Modelling spatial variations of 3D radiant fluxes and mean radiant temperature in complex urban settings. International Journal of Biometeorology, 52(7), 697-713. https://doi.org/10.1007/s00484-008-0162-7
Luber, G. E., Sanchez, C. A., & Conklin, L. M. (2006). Heat-related deaths-United States, 1999-2003. https://www.safetylit.org/citations/index.php?fuseaction=citations.viewdetails&citationIds[]=citjournalarticle_43416_29
Hu, Y., Qian, F., Yan, H., Middel, A., Wu, R., Zhu, M., … & Bao, Z. (2024). Which street is hotter? Street morphology may hold clues-thermal environment mapping based on street view imagery. Building and Environment, 262, 111838. https://doi.org/10.1016/j.buildenv.2024.111838
Ito, K., Zhu, Y., Abdelrahman, M., Liang, X., Fan, Z., Hou, Y., … & Biljecki, F. (2025). ZenSVI: An open-source software for the integrated acquisition, processing and analysis of street view imagery towards scalable urban science. Computers, Environment and Urban Systems, 119, 102283. https://doi.org/10.1016/j.compenvurbsys.2025.102283
Oleson, K. W., Monaghan, A., Wilhelmi, O., Barlage, M., Brunsell, N., Feddema, J., … & Steinhoff, D. F. (2015). Interactions between urbanization, heat stress, and climate change. Climatic Change, 129(3), 525-541. http://doi.org/10.1007/s10584-013-0936-8
Ratti, C., Di Sabatino, S., & Britter, R. (2006). Urban texture analysis with image processing techniques: winds and dispersion. Theoretical and applied climatology, 84(1), 77-90. http://doi.org/10.1007/s00704-005-0146-z
Salesses, M. P. (2012). Place Pulse: Measuring the collaborative image of the city (Doctoral dissertation, Massachusetts Institute of Technology). http://hdl.handle.net/1721.1/76533
Urban, J., Pikl, M., Zemek, F., & Novotný, J. (2022). Using Google Street View photographs to assess long-term outdoor thermal perception and thermal comfort in the urban environment during heatwaves. Frontiers in Environmental Science, 10, 878341. https://doi.org/10.3389/fenvs.2022.878341
Zhou, B., Lapedriza, A., Khosla, A., Oliva, A., & Torralba, A. (2017). Places: A 10 million image database for scene recognition. IEEE transactions on pattern analysis and machine intelligence, 40(6), 1452-1464. http://doi.org/10.1109/TPAMI.2017.2723009
Zhu, L., Samuelson, H. W., Biljecki, F., Tan, C. L., Wong, N. H., & Ang, Y. Q. (2026). Visual determinants of outdoor thermal comfort: integrating explainable AI and perceptual assessments. Building and Environment, 114322. https://doi.org/10.1016/j.buildenv.2026.114322