
During the last years, sharing mobility is one of the emerging transport modes, but seldom its planning is entrusted to private operators and not seen as a major vector of urban mobility. The understanding on how the introduction of sustainable and shared vehicles has an impact on the overall movement pattern of a city, is still an open conversation. Given the natural Internet of Things (IoT) aspect of sharing mobility, vehicle locations are constantly collected along many other diagnostic information. This factor leads to the opportunity to analyze the utilization patterns, with the scope to understand how this service is used to move around the urban environment. Demand spatial location and temporal profile can vary greatly on different days and at different times and this introductory article dives into an Exploratory Data Analysis of a week of carsharing usage in the city of Milan.
Introduction
The last two decades have been defined by a radical change in the urban mobility planning practice. If the 20th Century can be considered the Automotive City Era (Norton, 2008), driven by a car-centric approach, the 21th Century is facing different challenges, among which the Climate Emergency gains the spotlight, thus providing different opportunities of mobility is paramount. In this framework, it’s possible to appreciate the role of sharing mobility as one of emerging Mobility-as-a-Service (MaaS) solutions, capable of tackling the trade-off between the need for flexibility of private transport and the social/economic benefits of collective transport (Shaheen et al., 1998). Especially in Europe, shared mobility is considered as one of the strategic game-changers toward sustainable urban mobility by the SUMP Guidelines (Rupprecht Consult, 2019).
For these reasons, during the last years European cities saw an increasing provision of free-flow carsharing systems: as of 2020, in Germany and Italy, free-flow carsharing operators are active, respectively, in 17 (BCS, 2020) and 5 (Osservatorio Nazionale Sharing Mobility, 2020) cities, grown to 14 Italian cities in 2022 (Osservatorio Nazionale Sharing Mobility, 2022).
In this context, the scientific research in this field is steadily gaining momentum during the last decade, with several approaches to the topic. As the main difference introduced by free-flowing systems is that the vehicles are not linked to parking stations, de facto allowing a spontaneity and flexibility for the users (Kortum et al., 2012), most of the conversation is focusing on understanding how vehicles are utilized.
Given this framework, leveraging data gathered through the same vehicles is it possible to appreciate this flexibility and to identify patterns, sometimes in accordance to well-recognizable phenomena (i.e., commuting patterns), sometimes unexpected and possibly mode-specific.
Enabling Data
This article focuses on a preliminary analysis of a week of vehicle data of one of the carsharing operators active in Milan in 2020. The structure of this exploratory data analysis is aimed at discovering potential patterns, basis of future research, and highlighting the possibilities and the limitation of dataset analyses based only on origin and destination points (i.e., where and when the vehicle is rented and parked).
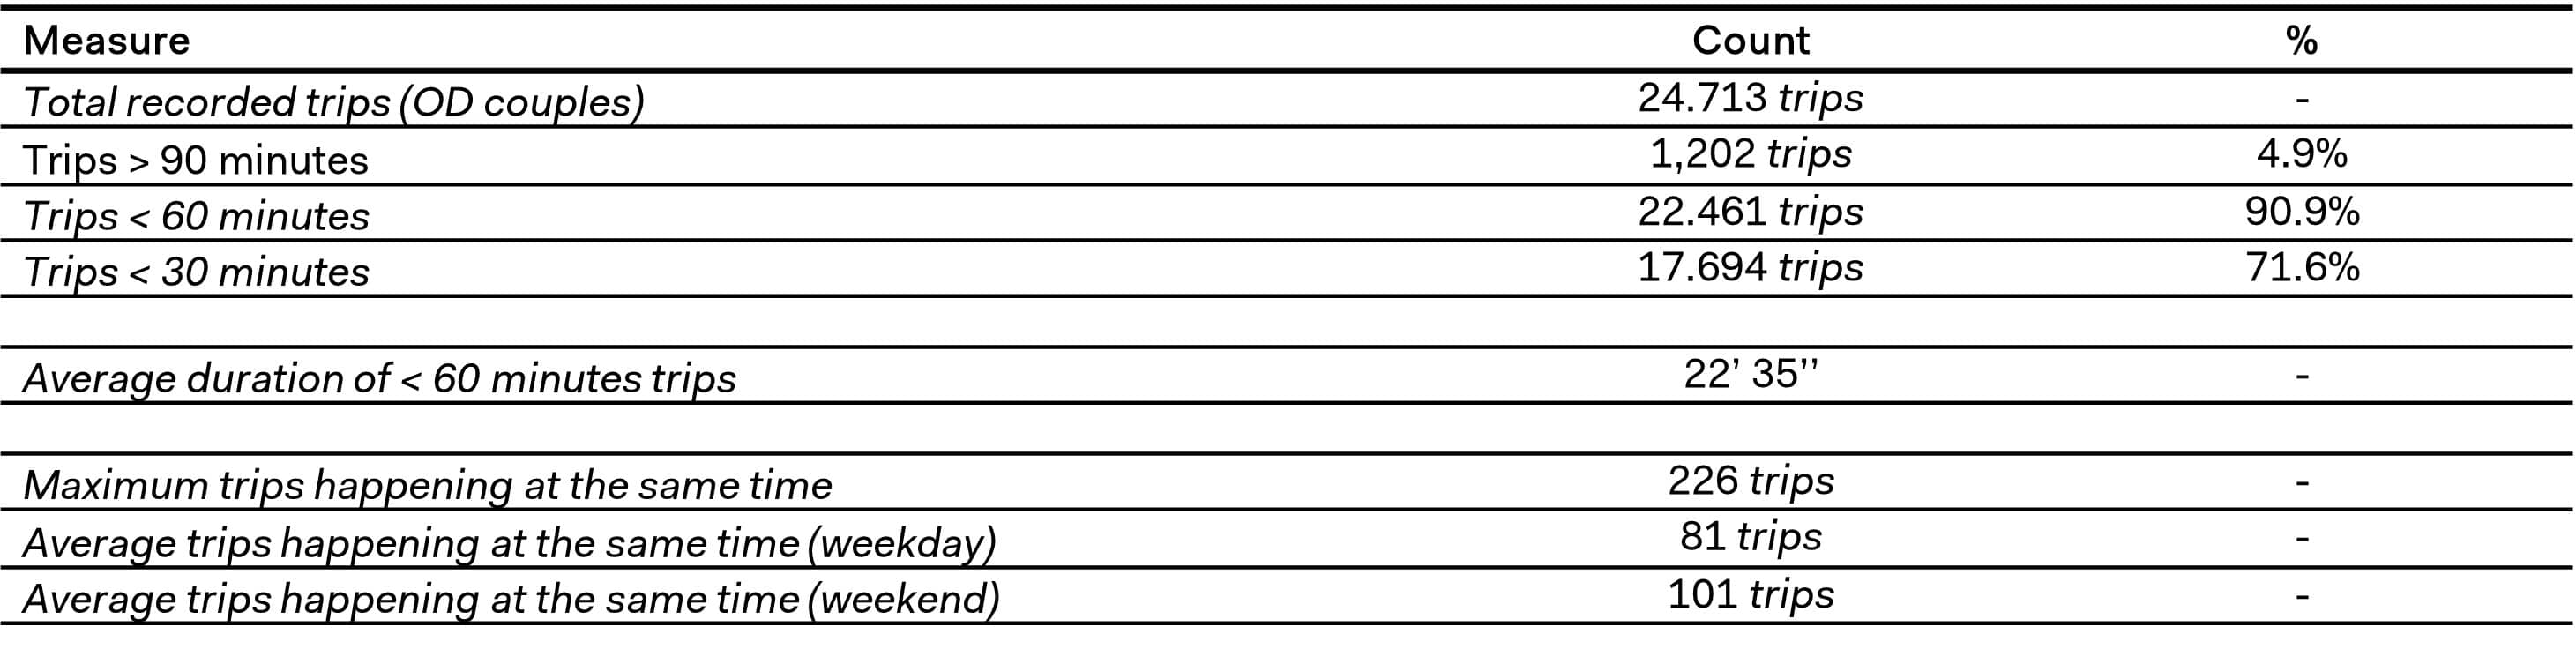
In particular, the data considered for the sake of this article is acquired in real-time through API endpoints, building a dataset of starting and ending points of the rental, with the respective timestamps. Descriptive statistics of the data are shown in Table 1.
The data exploration proposed in this article does not dive into a transportation-focused analysis, as this is the scope of the upcoming Part 2 of this series. On the other hand, the nature of this article is to show the different natures of a carsharing dataset. As previously mentioned, the data is structured as rental starting and ending points, these are the events that define the spatiality of the pattern. However, these events are described by a timestamp, which represent the time-variant essence of the pattern, and lastly these points are connected as the pair of the same trip, forming an OD relation. These dimensions can be represented and explored, providing insights on how the vehicles are utilized, thus on how carsharing services can act as supporting mobility mode.
Exploratory Data Analysis
This section of the article focuses on data visualization experiments to shed light on the dimensions outlined above, in particular the focus is posed on temporal variation and spatial variation.
Temporal variation
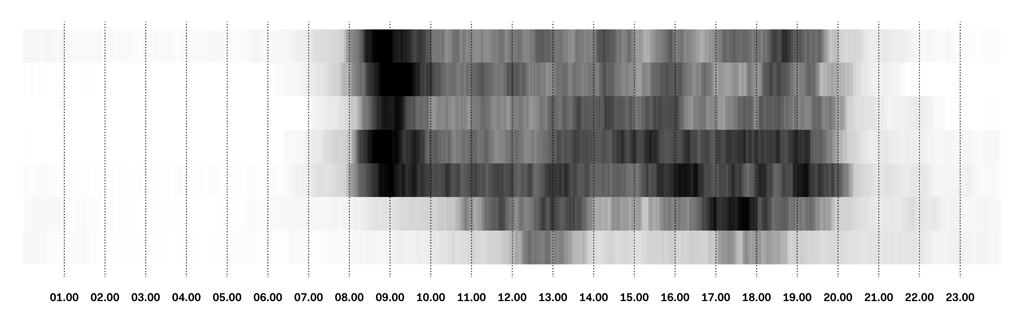
As many similar mobility data, carsharing follows the logic of hourly and demand seasonality, meaning that it is possible to identify utilization peaks during the day, and different trends during different days. While it’s possible to perform time-series analysis of these patterns, unveiling temporal clustering and correlation patterns, a visual representation of demand allows for a quick understanding of demand variation. Figure 1 shows the weekly consistency of the rental events (i.e., when the car is picked-up by the driver). This representation just consider one temporal variable and it shows evidently a difference between the weekdays and the weekends, as during the morning between Monday and Friday, especially 08.00 to 09.30 (the morning peak in Milan), the demand is noticeable higher than the rest of the day. This is additionally supported by the fact that the afternoon peak is usually distributed in more than 2 hours, as office egress time varies significantly and the demand does not include education-related trip purposes. Moreover, Friday and Saturday evening appears equally relevant, as these moments can be considered the “social time” when many occasional trips happen. In this case, the trip purpose is particularly significant since carsharing is much more appealing as occasional trip modal choice than commuting mode, due to its higher cost in respect to private car (if used regularly) or public transport (in any case).
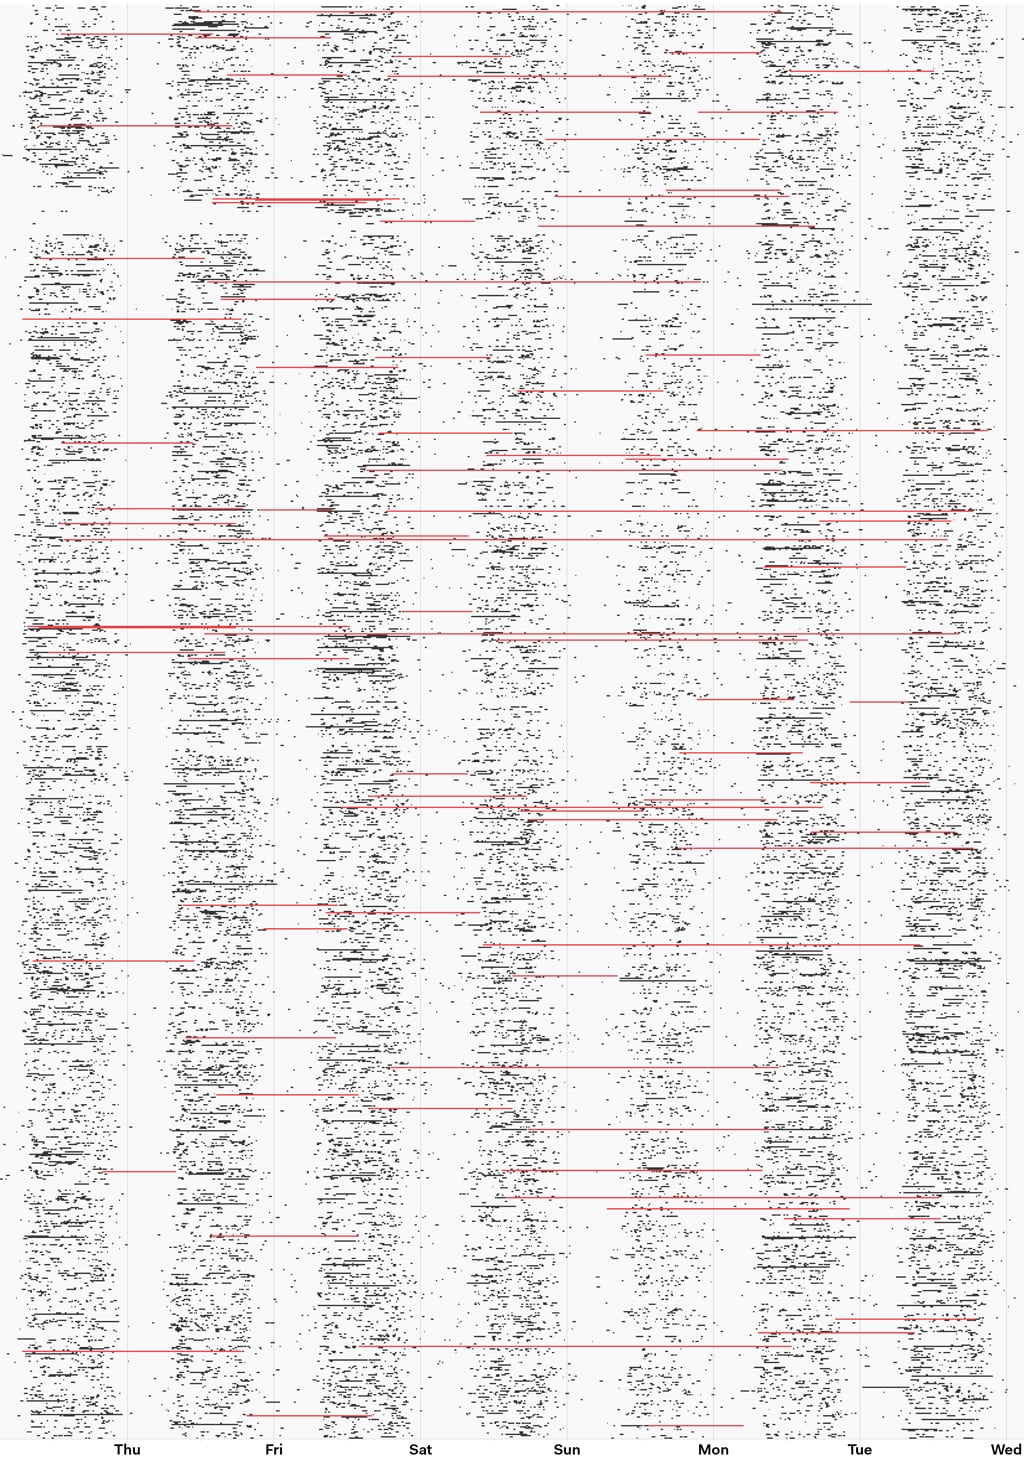
Diving more in the time-variant nature of the data, it is possible to consider the duration of these trips. Since this typology of carsharing is paid by the minute, the majority of trips have a short duration, as shown in Table 1, with 71.6% of the trips is lasting less than 30 minutes. However, it is possible to rent this car for longer period of time, even days, utilization that appear as more frequent in users who are not car owners. Figure 2 shows the temporal duration of each trip. In this case each trip is represented, allowing for the identification of outliers, such as events happening during the night, not visible in Figure 1. In addition to this, it is possible to grasp the variable demand pressure as the visualization of each event shows denser and lighter areas. This visualization includes the third dimension discussed above, namely the relation between the start and end points, here shown as temporal consistency.
Spatial variation
The space-variant nature of carsharing data is very intuitive, as these vehicles are used to move from point A to point B, however it is important to stress that the system here analyzed is a free-floating service, meaning than the parking location is not fixed and, except for a very limited area in the city center, the whole city is accessible by the service. In the case of spatial variation, it is important to consider the starting and ending events as separate datasets: one is representing the origins, the other the destinations, respectively where people is coming from and where they are going to. While this is important in understanding utilization patterns, the availability of vehicle is limited and these two variables are connected, the more vehicles are heading to an area, the more vehicles are available, and possibly used. Figure 3 shows a day of utilization and the number of events is hardly distinguishable at street level. The only evident differences are the urban voids and a gradual decrease in density from the center to the peripherical areas. For visualization purpose the starting and ending points are slightly offset, allowing to see both at the same time even if they happen in the same location (multiple rental of the same vehicle).
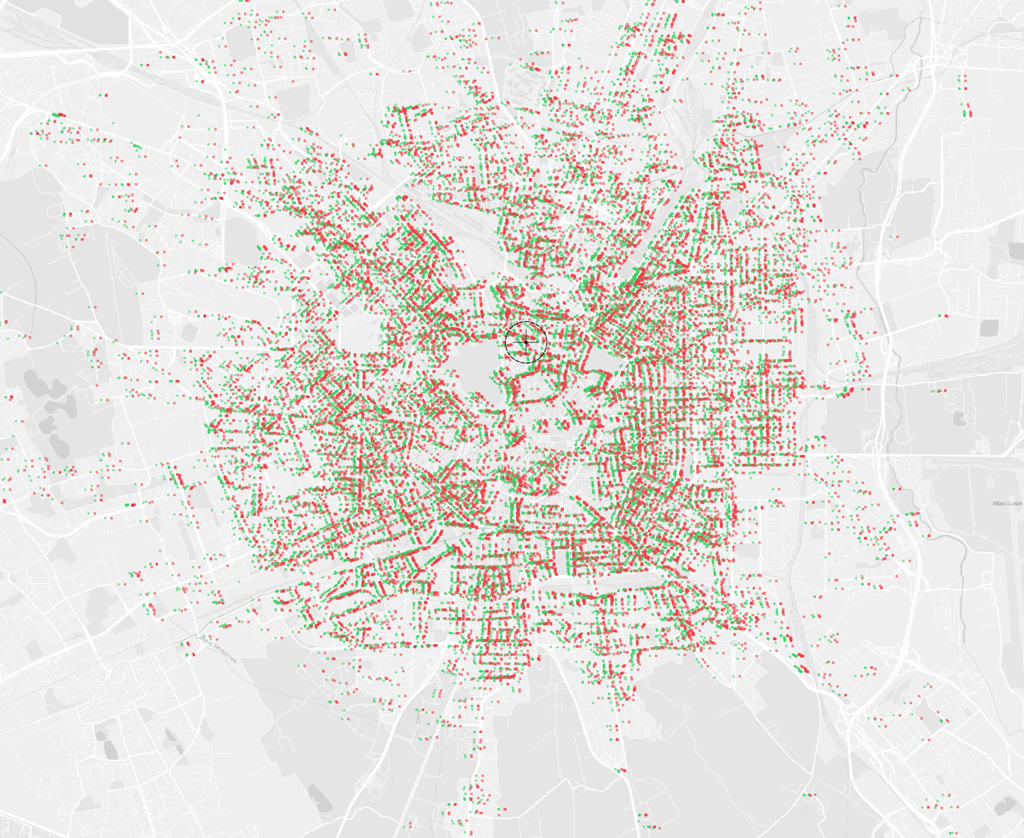
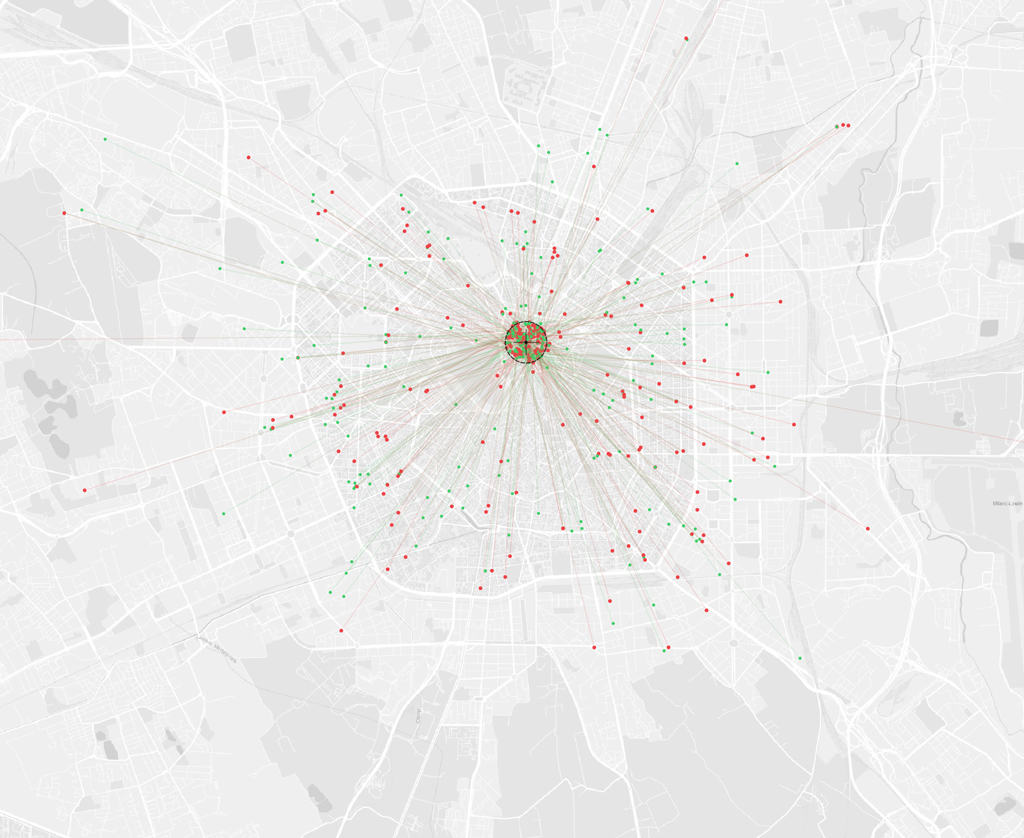
Figure 3 Spatial variation visualized as rental starting (green) and ending (red) points, with OD relations highlighted for a central district of Milan.
On top of the events’ locations, Figure 3 shows the third dimension of trip relation. While this visualization does not offer any analytical insights, it is crucial to show that event spatiality is related to the Origin-Destination relation as the single event location has a meaning both in respect to the location where it happened, informing on areas of higher of lower demand, and as connection among two urban points.
Spatio-temporal variation
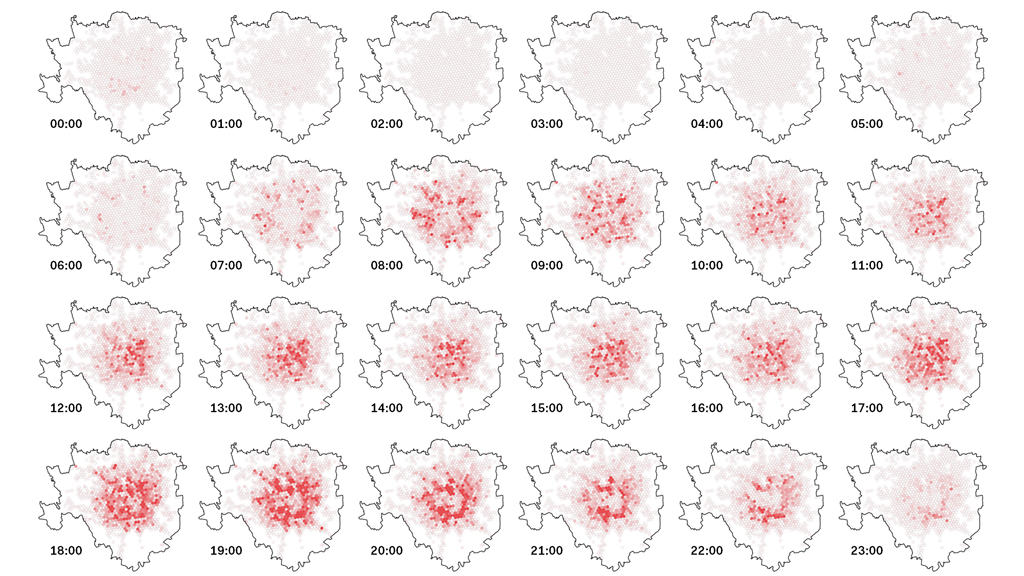
As the carsharing clearly appears as a spatially and temporally defined phenomenon, it becomes necessary to visualize both dimensions at the same time to properly visualize the patterns. The visualization presented in Figures 1, 2 and 3 are excluding either the space or the time from the framework, abstracting the data to a single dimension. On the other hand, Figure 4 shows the hourly variation of the spatial demand pattern, by discretizing spatially (on a grid) and aggregating temporally (hourly) the rental starting events. This visualization already allows for the identification of relevant patterns: i) 08:00 is characterized by a high demand in the residential areas of the city, with a very limited activity in the city center; ii) around 13.00 the pattern is inverted, with the center leading the demand and the external areas with little to no car utilization; iii) from 17.00 to 21.00 the demand’s shape varies significantly, but it’s more consistent with the early morning one. These and additional consideration are the basis for additional analyses performed in the upcoming Part 2 of this series.
To visualize the same patterns while not reducing the time as hour and the space as grid, it is possible to create dynamic visualizations, which allow to appreciate better the local variation of the demand but are not meant to precisely identify or quantify specific variations. As an example, Figure 5 shows the rental end points during the day, highlighting the destinations of the trips.
Finally, for the sake of including the relation dimension in these visualization, it is possible to visualize the OD trips in a dynamic way. While the data itself does not contain information about the actual route driven by the user, it is possible to estimate the shortest path on the vehicular network and simulate a series of least-cost relations among the start and end points, ultimately simulating the routes. Since each trip happens at a specific time and has a specific duration (see Figure 2) the animation proposed in Figure 6 brings the three dimensions of space, time and relation together.
Conclusions
This article presented a data exploration approach of carsharing data, aimed at building an understanding of how the different dimensions of this typology of data can be conceptualized. The three dimensions highlighted are the space, the time and the trip relation, which needs to be analyzed consistently to properly unveil the characteristics of the sharing mobility service. It appears evident how exploring just a subset of these dimensions limits the insights and the additional analytical framework. As first part of this article series, no analytical procedures were presented here focusing the attention on a qualitative understanding based on patterns identification and a critical understanding of the mobility system this data represent.
The upcoming second part of this series will delineate a quantitative methodology to address some of the hypothesis formulated through the data exploration process, understanding the driving factors that shape the demand patterns identified here.
The concepts defined in this article are part of the preparatory data analysis performed while working on a research presented at the 49th European Transport Conference, published on Zenodo: Messa, F. (2021). Free-flow Carsharing Systems in a Spatio-temporal Urban Ecosystem: An Urban Informatics Approach. Zenodo. https://doi.org/10.5281/zenodo.6493824
Acknowledgments
The analyzed data were treated according to the GDPR-General Data Protection Regulation (EU, 2016/679). This research received no specific grant from any funding agency in the public, commercial, or not-for-profit sectors.
References
BCS, Bundesverband CarSharing (2020). Datenblatt CarSharing in Deutschland. Accessed January 10, 2024. Available at: https://www.carsharing.de/sites/default/files/uploads/datenblatt_carsharing_in_deutschland_stand_01.01.2020_1.pdf
Kortum, K. (2012). Free-floating carsharing systems: innovations in membership prediction, mode share, and vehicle allocation optimization methodologies. University of Texas at Austin. Available at: http://hdl.handle.net/2152/ETD-UT-2012-05-318
Norton, P. D. (2011). Fighting traffic: the dawn of the motor age in the American city. Mit Press.
Osservatorio Nazionale Sharing Mobility. (2020). 4o RAPPORTO NAZIONALE SULLA SHARING MOBILITY – 2020. Accessed January 11, 2024. Available at: http://osservatoriosharingmobility.it/wp-content/uploads/2020/12/IV-RAPPORTO-SHARING-MOBILITY.pdf
Osservatorio Nazionale Sharing Mobility. (2022). 6o RAPPORTO NAZIONALE SULLA SHARING MOBILITY – 2022. Accessed January 11, 2024. Available at: https://osservatoriosharingmobility.it/wp-content/uploads/2022/10/6-Rapporto-Nazionale-sharing-mobility.pdf
Rupprecht Consult (editor), (2019). Guidelines for Developing and Implementing a Sustainable Urban Mobility Plan, Second Edition, 2019. Accessed January 10, 2024. Available at: https://urban-mobility-observatory.transport.ec.europa.eu/document/download/87adaa0c-cd13-4ce0-9a15-d138ea31bb2c_en?filename=sump_guidelines_2019_second%20edition.pdf
Shaheen, S., Sperling, D., & Wagner, C. (1998). Carsharing in Europe and North American: past, present, and future. Transportation quarterly. Vol. 52 No. 3, 35-52. Available at: https://hdl.handle.net/2027/mdp.39015048134814?urlappend=%3Bseq=249