 traffic data through Wi-Fi sensors: the evolution of the lockdown phases in Milan")
The development of ICT solutions for monitoring (Big) traffic data in real time enables transport planners and decision makers to understand and predict the travel behaviour of the city users.
The current research work is based on the analysis of the traffic data collected in Milan through a network of Wi-Fi sensors from the beginning of January 2020 to the end of July 2020.
This was aimed at understanding the impact of the lockdown containment measures on urban mobility by merging time series analyses and GIS-based spatial analyses of traffic data.
ICT Solutions for Monitoring Traffic Data
The management and optimization of transport infrastructures requires the monitoring of (Big) traffic data in real time (Batty, 2013)in order to assess the contextual conditions of service, detect anomalies and avoid service disruption (TfL, 2019).
In this regard, the activity of transport planners and decision makers is supported by the development of ICT solutions for monitoring, understanding and predicting the travel behaviour of the city users through location detection systems (National Centre IOT and Privacy, 2020), including the following:
Images or video stream analysis-acquisition systems
: computer vision techniques for processing a sequence of photographs or a video clip collected through CCTV cameras or drones;Radio frequency systems based on Wi-Fi or Bluetooth wireless technology
: antenna type sensors for scanning wireless devices through the media access control (MAC) address (unique identifier of each network device);Cell network data acquisition systems
: data derived from SIM cards and cell network technology;Software development kit, Beacon and bidstream systems
: data derived from Global Positioning System (GPS) signal of navigation devices and Apps for smartphones;Occupancy Detection Systems
: light pulse type remote detection techniques, including Lidar (Laser Imaging Detection and Ranging) sensors and passive infra-red (PIR) occupancy sensors.
Nowadays, monitoring traffic data has become even more crucial considering the need to investigate the unprecedented effects of the Covid-19 pandemic on urban mobility and to assess the effectiveness of immediate and longer-term actions that cities are developing to respond to the crisis (European Platform on Sustainable Urban Mobility Plans, 2020; Comune di Milano and AMAT, 2020).
As highlighted by the mobility report of the Environment, Mobility and Territory Agency (AMAT) of the City of Milan (2020), the lockdown containment measures put into place to contrast the spread of contagion in Milan (from February 23rd, 2020, until May 3rd, 2020) caused a drastic decrease in the usage indicators of both public and private transport systems (e.g. -88% subway, -72% car sharing, -66% bike sharing, -95% park and ride, -43% access to the AREA C congestion charge).
In this framework, the current research work is based on the analysis of a large sample of aggregated traffic data collected in Milan through a network of Wi-Fi sensors. This was aimed at understanding the impact of the lockdown containment measures on urban mobility by merging time series analysis and GIS-based spatial analysis of traffic data.
The Evolution of the Lockdown Phases in Milan
Thanks to the collaboration with the Wi-Fi service provider FreeLuna, Systematica analysed the (Big) traffic data collected through a network of Wi-Fi sensors from the beginning of January 2020 to the end of July 2020. The aggregated dataset includes vehicular, cycling and pedestrian flows.
In general, the analysis was based on filtering the amount of mobile devices (e.g. smartphones, tablets, notebooks, etc.) counted per hour by means of a total of 57 Wi-Fi Access Points, distributed in several department stores, shops and public services.
The radius of action of the sensors is 80 meters, but their capability to detect mobile devices within the catchment area depends on the connection features of the device, its battery level and actual usage.

The interactive map presented above shows the results of a 7-months period of data collection (from January 1st, 2020, to July 31st, 2020), which consists of about 113,652,582 mobile devices counted in total.
The series of data is represented considering a 7-day time interval. The bars correspond to the position of the Wi-Fi sensors managed by FreeLuna in Milan (represented with a radius of 0.25 km). The height and colours of bars are related to the normalized values of mobile devices (Z-Scores in a range between 0 and 1) detected by each sensor through the MAC
address.

The chart presented above shows the results of the time series analysis of traffic data collected through Wi-Fi sensors during the Pre-Covid-19 period (from January 1st, 2020, to February 22nd, 2020) and the lockdown phases, as described below:
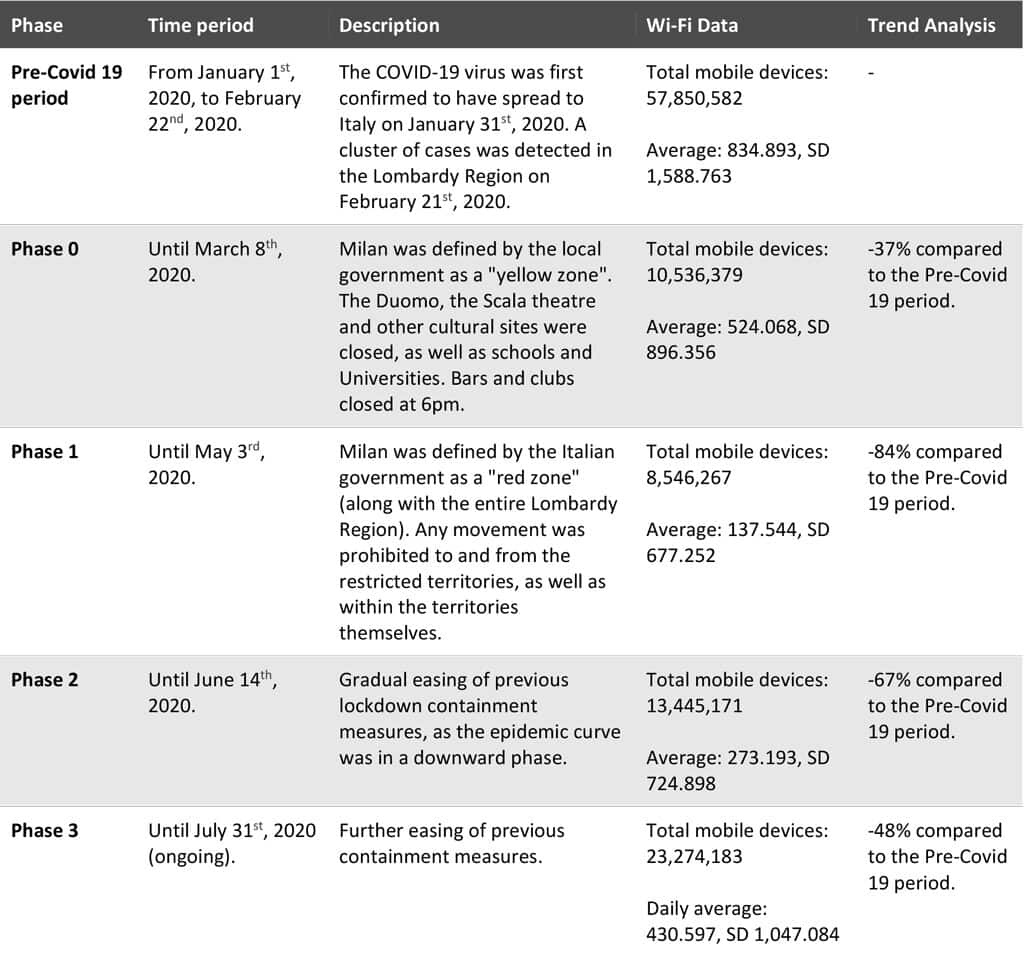
The results of a series of independent-samples t-tests showed a significant difference (p < 0.001) between the number of mobile devices detected on daily average during the Pre-Covid-19 period and during the Phase 0, Phase 1, Phase 2 and Phase 3.
The trend analysis of the time series of traffic data was also supported by the calculation of the difference between the moving average (MA, time period: 3 days) and the cumulative average of values (CA, time period: 7-months) related to the amount of mobile devices counted through the Wi-Fi sensors (Z-Scores in a range between 0 and 1). This allowed us to smoothen out short-term fluctuations of data and to highlight longer-term trends, such as the significant increase of traffic flows during Phases 2 and 3.
The Circadian Rhythm of Milan Before and After the COVID-19 Pandemic
The tables presented below show the average weekly distribution (considering a time interval of 2 hours) of the number of mobile devices counted through the Wi-Fi sensors during the Pre-Covid-19 period (from January 1st, 2020, to February 22nd, 2020) and during the period between Phase 0 and Phase 3 (from February 23rd, 2020, to July 31st, 2020, -64% compared to the Pre-Covid-19 period).
The relative quintile frequency distribution of results allowed the characterization of the circadian rhythm of the City of Milan during the entire time series of data.
The Pre-Covid-19 period is characterized by the highest temporal distribution of values in the late afternoon (average peak hour on Friday at 5-6 pm), and during Saturday night time. The averaged values of Phase 0-3 (-59% compared to the Pre-Covid-19 period) are characterized by a more homogenous temporal distribution of values during the week, with peak hours in the early afternoon.


Delta Values and Location-based Data about POIs
Data analysis on delta values was aimed at comparing the number of mobile devices detected on average during the Pre-Covid-19 period (from January 1st, 2020, to February 22nd, 2020, average: 834.893, SD 1,588.763) and during the period between Phase 0 and Phase 3 (from February 23rd, 2020, to July 31st, 2020, average: 300.810, SD 847.940, -64% compared to the Pre-Covid-19 period).
An extensive GIS-based spatial analysis was executed to calculate the density distribution of the Points of Interest (POIs) (OpenStreetMap dataset, 2020) located within the catchment area of each Wi-Fi Access Point (radius of catchment areas: 80 m): total number of POIs in Milan: 11,051; number of POIs extracted in catchment areas: 512; average number of POIs per Wi-Fi Access Point: 9.273, SD 8.625.
Then, data analysis was focused on grouping the POIs extracted on catchment areas in 10 typologies (presented in alphabetical order): bank and ATM (6%), bar, cafè, pub and nightclub (18%), cinema and theatre (1%), department store (1%), fast food and restaurant (25%), health service (4%), place of worship (0.4%), public service (3%), shop (30%), supermarket (1%), tourists attraction (9%).
A series of correlation analyses (Pearson’s Correlation Coefficient) showed a moderate, positive correlation between the number of POIs located inside in the catchment areas and the number of mobile devices detected during the Pre-Covid-19 period (R2 = 0.213, r = 0.462, n = 55, p < 0.001), and a weak, negative correlation between the number of POIs located inside the catchment areas and delta values (R2 = 0.088, r = -0.297, n = 55, p = 0.028). Results showed that the density distribution of POIs (with particular reference to shops, fast foods and restaurants, tourist attractions, bars, cafè, pubs and nightclubs) is an indicator of higher traffic flows in urban areas.

The interactive map presented above shows the density distribution of POIs in Milan (hexagonal grid cell radius: 0.25 km) and the percentage difference related to the average number of mobile devices detected inside the catchment areas of the Wi-Fi Access Points during the Pre-Covid-19 period and during the Phases 0-3.
The results of the analysis showed that the traffic flows observed during the Pre-Covid-19 period were concentrated in the Milan city center, as the area characterized by the highest density distribution of POIs. Moreover, results showed that the centrality of POIs was also linked to the lower variance of traffic flows observed during Phases 0-3 in peripheral areas. This opens up debate on the need to design cities to have a polycentric structure, with several and distinctive areas of attraction for the city users, in order to be resilient to extraordinary events such as the Covid-19 pandemic.
Final Remarks and Future Work
Wi-Fi sensing technology has been recognized as one of the most effective methods for collecting traffic data in urban areas considering installation and maintenance costs, precision rate (Bellini et al., 2017) and compliance to the General Data Protection Regulation (National Centre IOT and Privacy, 2020).
In this regard, the proposed research work was based on the analysis of a large sample of aggregated traffic data collected during a 7-months period (from January 1st, 2020, to July 31st, 2020) through the Wi-Fi Access Points managed by FreeLuna in the City of Milan.
Data analysis aimed at understanding how the lockdown containment measures put in place to contrast the spread of contagion in Milan have impacted on urban mobility. Results confirmed the effectiveness of this data collection method, enabling to assess the evolution and the characteristics of the lockdown phases (e.g. time series analysis, circadian rhythm analysis).
An extended GIS-based spatial analysis aimed at investigating the relationship between traffic data and POIs (e.g. delta values and location-based data about POIs). Results showed that the density distribution of POIs is correlated to higher traffic flows, with particular reference to the presence of shops, food shops and restaurants, tourist attractions, bars, cafè, pubs and nightclubs.
The results of the proposed research work could be of notable interest for those interested in data-driven approaches for transport planning. Future work will be based on the use of computer vision techniques to cross check the validity of traffic data collected through the Wi-Fi sensors, and on the development of Wi-Fi sensing applications for monitoring mobility data in real time considering both outdoor and indoor scenarios.
Acknowledgement
Systematica thanked the team of FreeLuna for their fruitful collaboration and for sharing data.
References and Online Sources
AMAT (2020). Impatto della Pandemia Covid-19 sui Sistemi di Mobilità a Milano. Analisi di Dettaglio dei Sistemi di Mobilità e Trasporto.
Batty, M. (2013). Big data, smart cities and city planning. Dialogues in human geography, 3(3), 274-279.
Bellini, P., Cenni, D., Nesi, P., & Paoli, I. (2017). Wi-Fi based city users’ behaviour analysis for smart city. Journal of Visual Languages & Computing, 42, 31-45.
Comune di Milano and AMAT (2020). Milan 2020 Adaptation strategy.
European Platform on Sustainable Urban Mobility Plans (2020). COVID-19 SUMP Practitioner Briefing. CIVITAS SATELLITE CSA.
Geofabrik GmbH Karlsruhe (2020). OpenStreetMap dataset.
National Centre IOT and Privacy (2020). Physical Audience Measuring Technologies and Privacy Concerns. White Paper, v.01/2020.
Transport for London (2019). Review of the TfL WiFi pilot. Our findings.