

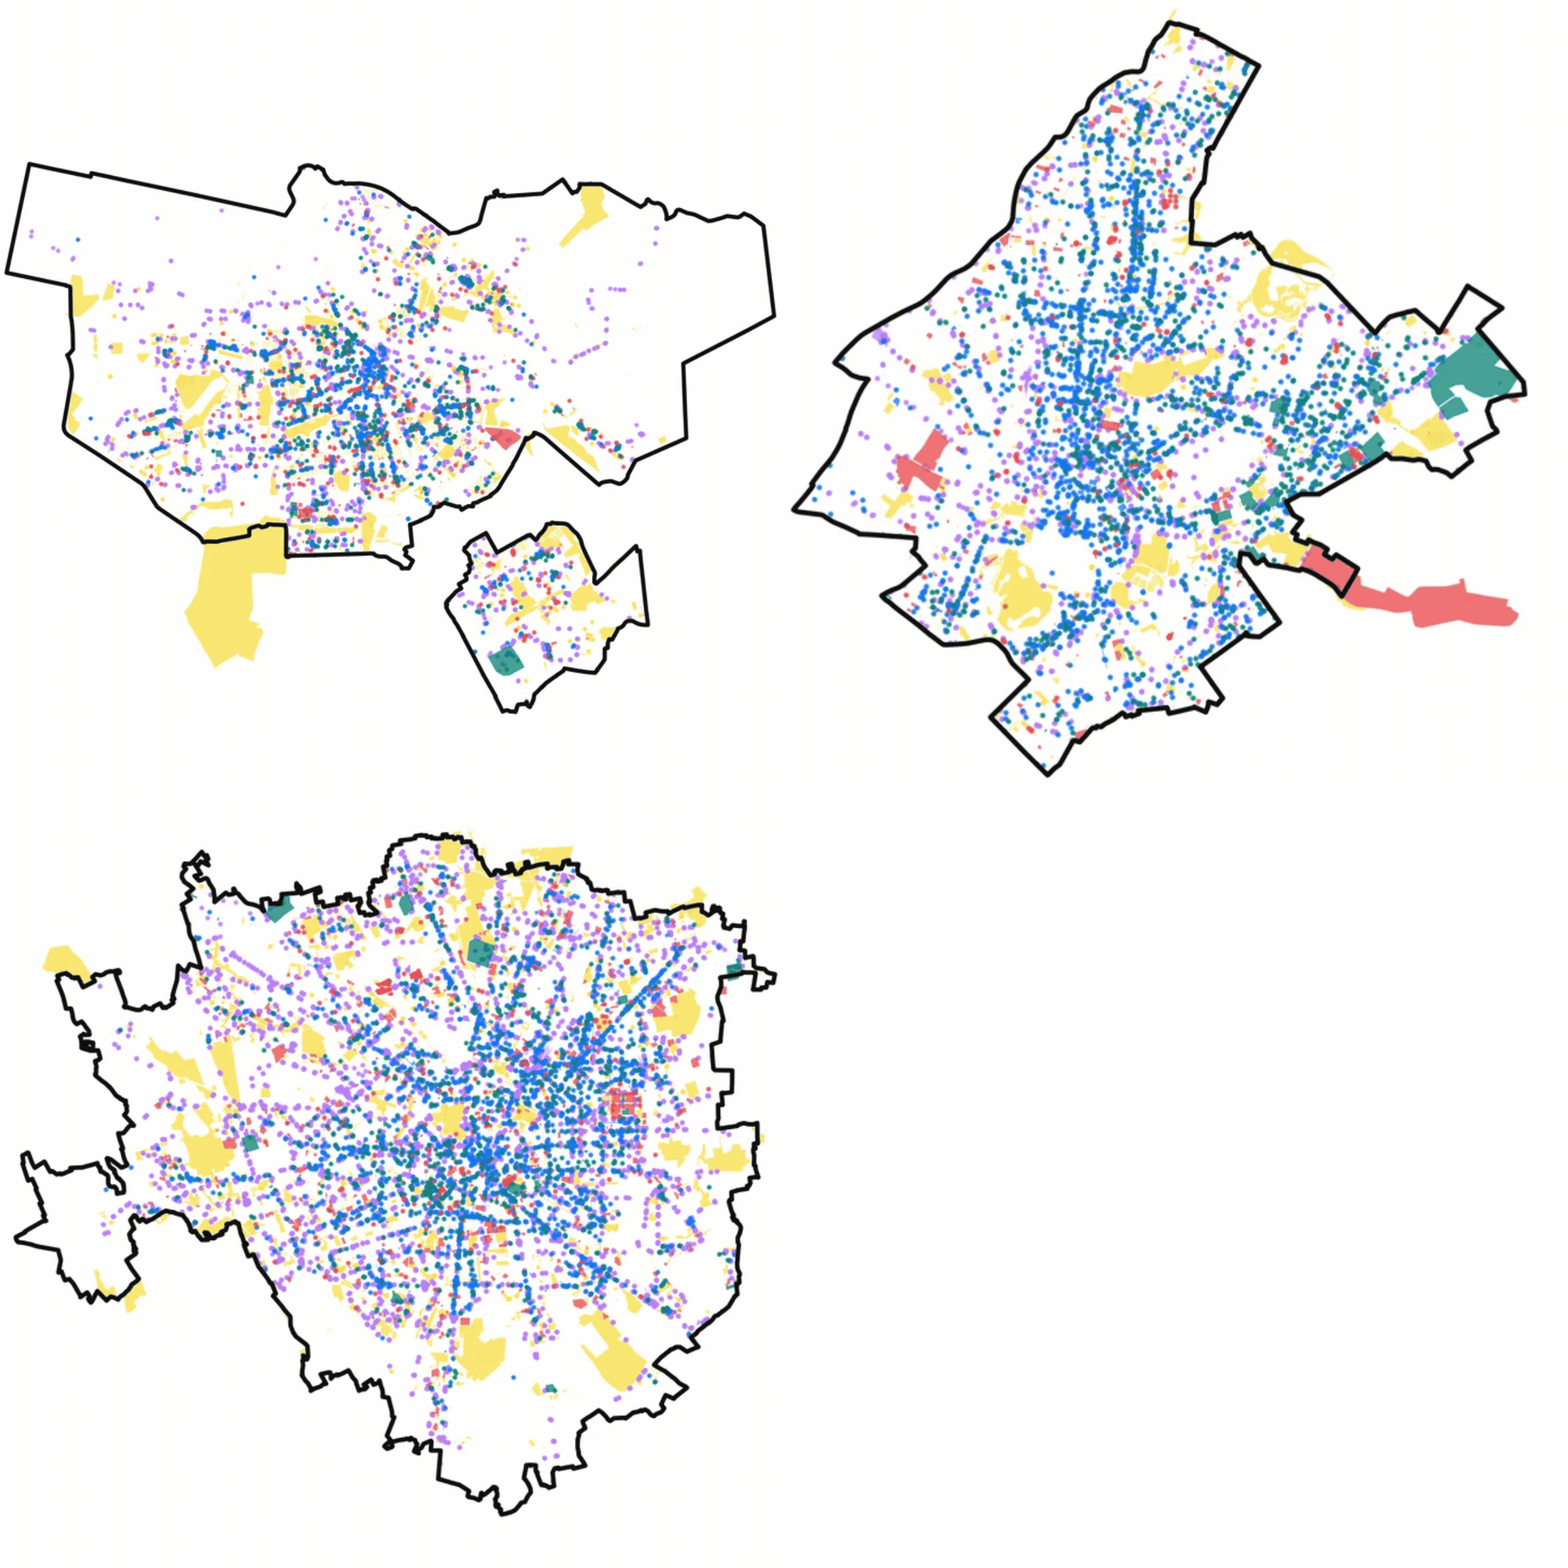
Proximity-based planning has expanded the use of urban accessibility analysis, yet studies often remain fragmented, limiting reproducibility and comparability. This article introduces an end-to-end accessibility workflow, from spatial data acquisition and preprocessing to accessibility and equity evaluations.
Using OpenStreetMap, WorldPop, and user-provided datasets, accessX supports flexible travel-cost assumptions, isochrone generation, and established accessibility measures. Its application to Amsterdam, Athens, and Milan demonstrates how integrated open-source workflows can produce consistent, transparent, and policy-relevant assessments of pedestrian accessibility and equity.
The Need for a Library
Accessibility has been a core component of urban planning for decades, with its first well-accepted conceptualization coming as the “potential of opportunities for interaction” which takes into account both the spatial distribution of the destinations and the “ability […] to overcome spatial separation” (Hansen, 1959 p. 73). More recently, accessibility got back under the spotlight thanks to the growing interest in proximity-based planning (Handy S., 2023), active mobility, and the 15-minute city (Abdelfattah et al., 2022; Büttner et al, 2024; Moreno et al, 2021). Cities, researchers, and practitioners are increasingly asking a simple but critical question: how easily can people access everyday opportunities such as schools, healthcare, shops, green spaces, public transport, or cultural activities?
Answering this question usually requires a sequence of technical steps. Analysts need to define the study area, collect spatial data, build a street network, estimate travel costs, generate reachable areas, calculate accessibility indicators, and evaluate whether access is distributed fairly across space and population groups. Although many accessibility studies follow this same logic, they are often implemented through fragmented scripts, different datasets, and case-specific assumptions. This makes results harder to reproduce, compare, and translate into planning practice.
This challenge is becoming even more relevant in the era of AI-assisted analysis. AI tools can accelerate coding and data processing, but they can also hide important methodological details or produce workflows that appear correct without being fully transparent. For accessibility studies, where choices about networks, travel costs, destinations, thresholds, and population weighting can strongly affect results, open and inspectable methods are essential.
Existing open-source tools have already advanced network-based accessibility analysis. The 15minCS Toolkit developed by Transform Transport, estimates accessibility scores under the 15-minute city concept (Albashir et al., 2024). OSMnx (Boeing, 2017; Boeing, 2025), NetworkX (Hagberg et al., 2008), r5r (Pereira et al., 2021), Pandana (Foti, et al., 2012), cityseer (Simons, 2023), and scikit-mobility (Pappalardo et al., 2022) support tasks such as street-network extraction, routing, multimodal travel-time estimation, catchment analysis, accessibility modelling, and mobility analysis. Nevertheless, these tools often focus on specific components of the workflow. Researchers therefore still need to combine multiple libraries, preprocessing steps, datasets, and custom scripts to complete a full accessibility assessment.
accessX builds upon this ecosystem by organizing the broader accessibility process into a unified but modular workflow. It supports data acquisition, network preparation, travel-cost modelling, isochrone generation, accessibility estimation, co-accessibility analysis, and equity evaluation. The library can start from open spatial data sources such as OpenStreetMap and WorldPop (Tatem, A. J., 2017). while also allowing users to integrate local datasets and define their own assumptions about travel behavior, cost, and accessibility measurement. The data sources currently integrated in the library will be expanded within the same logic, to allow researchers to further enrich their analysis.
This article presents the rationale, structure, and application of accessX. The library is demonstrated through comparative pedestrian accessibility analyses in Amsterdam, Athens, and Milan, showing how an integrated open-source workflow can support transparent, transferable, and policy-relevant accessibility assessments. More broadly, accessX aims to contribute to a shared and evolving foundation for accessibility research, where researchers and practitioners can build on common methods instead of repeatedly developing similar workflows in isolation.
Structure and Modules of accessX
A Modular Workflow for Accessibility Analysis
accessX is designed as a modular Python library for network-based accessibility analysis in X-minute cities, proximity planning, and urban opportunity mapping. The library organizes the main stages of an accessibility workflow into reusable modules, allowing users to move from an area of interest to accessibility, co-accessibility, and equity indicators through a transparent sequence of steps. A typical workflow starts by defining the study area, generating an H3 hexagonal grid (Uber, 2018), retrieving a walking or cycling street network, assigning travel costs to the network, collecting destinations and population data, and finally computing accessibility scores.
A key principle of accessX is that it provides ready-to-use methods without locking users into a fixed workflow. Intermediate outputs remain available as GeoDataFrames or OSMnx/NetworkX graphs, meaning that users can inspect, save, modify, or replace each layer depending on the needs of the analysis. This makes the library suitable both for rapid exploratory assessments and for more customized research workflows.
Open and User-Provided Spatial Data
accessX can rely on open spatial data sources while remaining compatible with local or user-provided datasets. Street networks and points of interest can be retrieved from OpenStreetMap, with POIs organized into custom analytical categories such as healthcare, open space, daily needs, or public transport. The original OSM tags, feature identifiers, and geometries are preserved, allowing users to trace how each opportunity category was constructed.
Population data can be incorporated through WorldPop rasters or through user-provided demographic datasets or grids. The library includes tools to download and clip population rasters, convert raster cells into vector grids, and aggregate population to H3 hexagons using area-weighted overlap. The same tools can be used to convert any vector-based demographic data to the H3 hexagons. This enables both territorial analyses, where each spatial unit is treated equally, and population-based analyses, where accessibility is weighted by the number or characteristics of residents.
Cost as the Basis of Accessibility
In accessX, accessibility is calculated over the street network using a numeric edge cost. This cost can represent walking time, cycling time, distance, generalized impedance, or any other measurable burden of movement. The library includes built-in helpers for common travel-cost assumptions, such as constant-speed walking time and slope-sensitive walking time. At the same time, users can define their own edge-cost functions to incorporate local assumptions related to comfort, safety, effort, terrain difficulty, or other context-specific factors.
This design makes it possible to compare different interpretations of accessibility using the same origins, destinations, and network. For example, an analyst can estimate how many services are reachable within 15 minutes under a standard walking-speed assumption, and then repeat the analysis using a slope-adjusted or comfort-adjusted cost function.
Accessibility, Co-Accessibility, and Equity Indicators
Building on the prepared network, destinations, and population inputs, accessX supports several established accessibility models (Levinson & Wu, 2020). These include cumulative opportunity measures, which count how many destinations are reachable within a given cost threshold; nearest-POI measures, which estimate the minimum cost to n closest services; Hansen-type accessibility (Hansen, 1959), which gives stronger weight to nearby opportunities by using gravity-based models; and two-step floating catchment area methods, which compare service supply with accessible population demand (Luo & Wang, 2003; Wang & Luo, 2005).
The library also extends the analysis beyond origin-based accessibility. Co-accessibility indicators can estimate how many people can access each destination, supporting destination-side analyses of potential demand, exposure, or encounter opportunities (Milias & Psyllidis, 2022; Milias et al, 2024). Finally, equity tools allow users to assess how accessibility is distributed across places and populations. Lorenz curves and Gini indices support egalitarian analysis of distributional inequality, while sufficientarian scores evaluate whether spatial units or population groups meet explicit minimum accessibility thresholds (Lucas et al, 2016; Milias et al, 2025).
From Planning Questions to Reproducible Accessibility Workflows
The accessX case studies demonstrate how a common accessibility workflow can be used to answer a sequence of practical planning questions. Rather than starting from a single indicator, the demonstration begins with the urban question itself: what can people reach, how fairly is access distributed, and which places are accessible to different population groups?
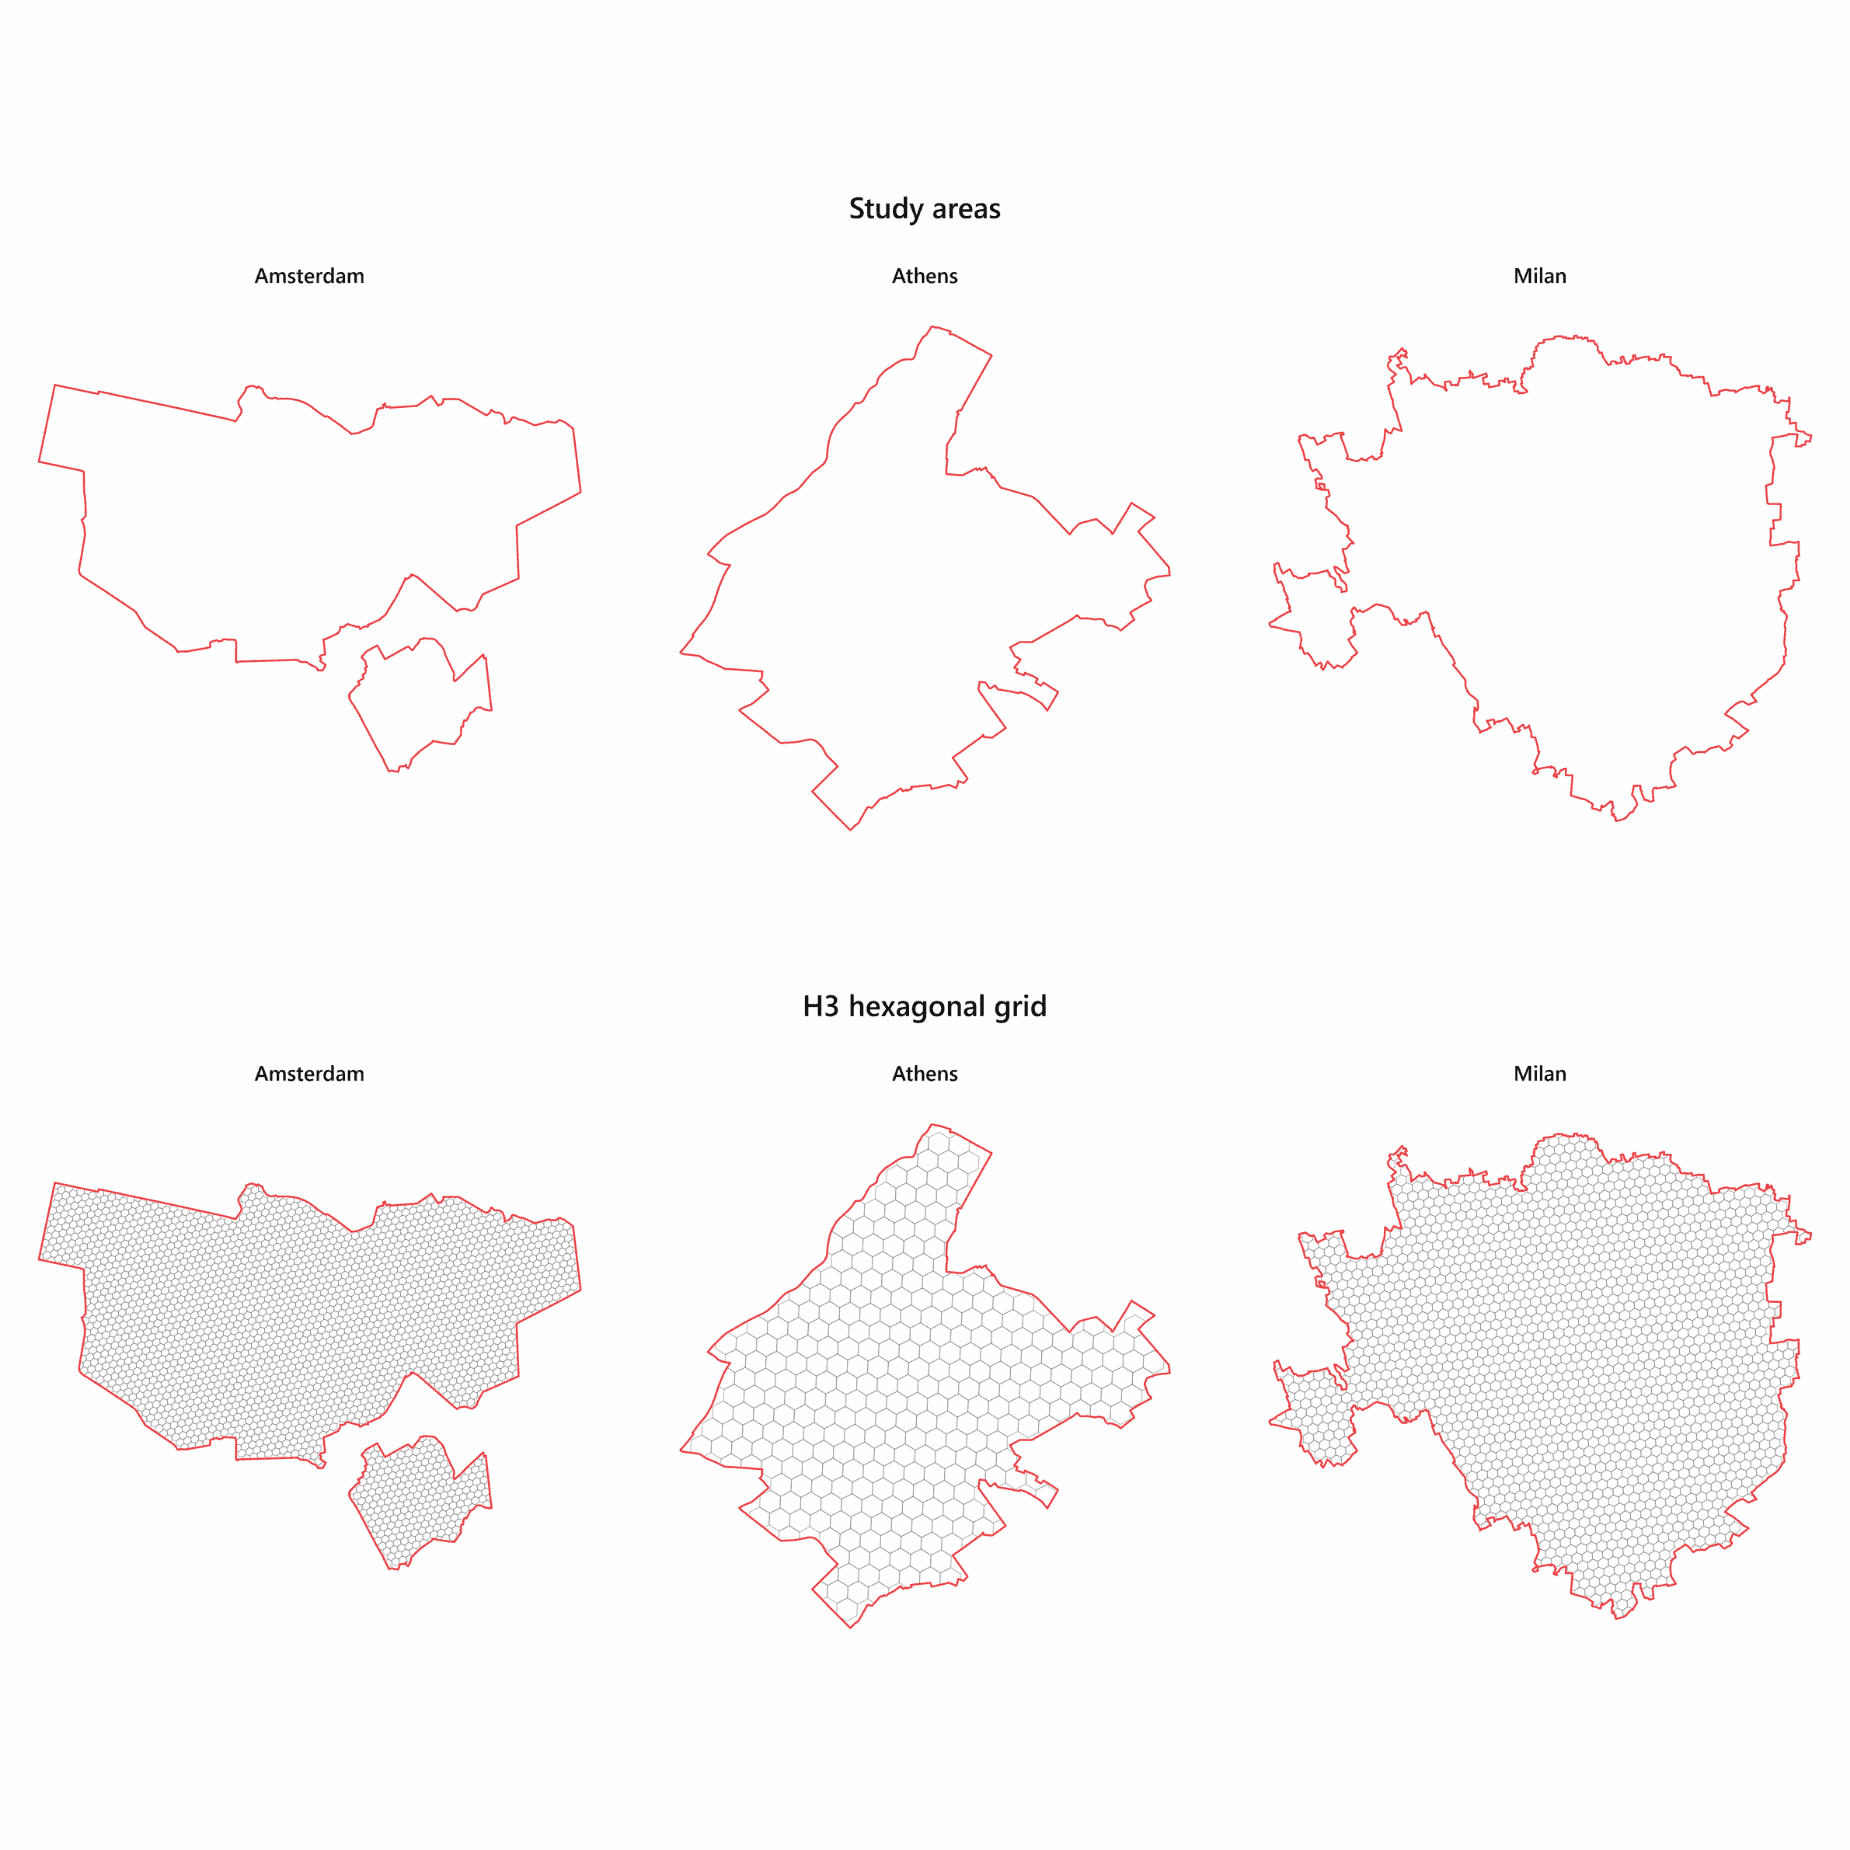
On accessX Github page, case-study notebooks are provided to showcases all the modules and to reproduce the workflow on three selected areas, Amsterdam, Athens, and Milan. For each city, accessX first defines the area of interest and discretized the space in the H3 hexagonal grid that acts as the spatial unit of analysis. This grid provides the basis for linking origins, population, destinations, accessibility scores, and equity indicators. By using the same spatial logic across cities, the results can be compared while still preserving the specific urban structure of each place.
How Far Can People Walk within 15-minutes?
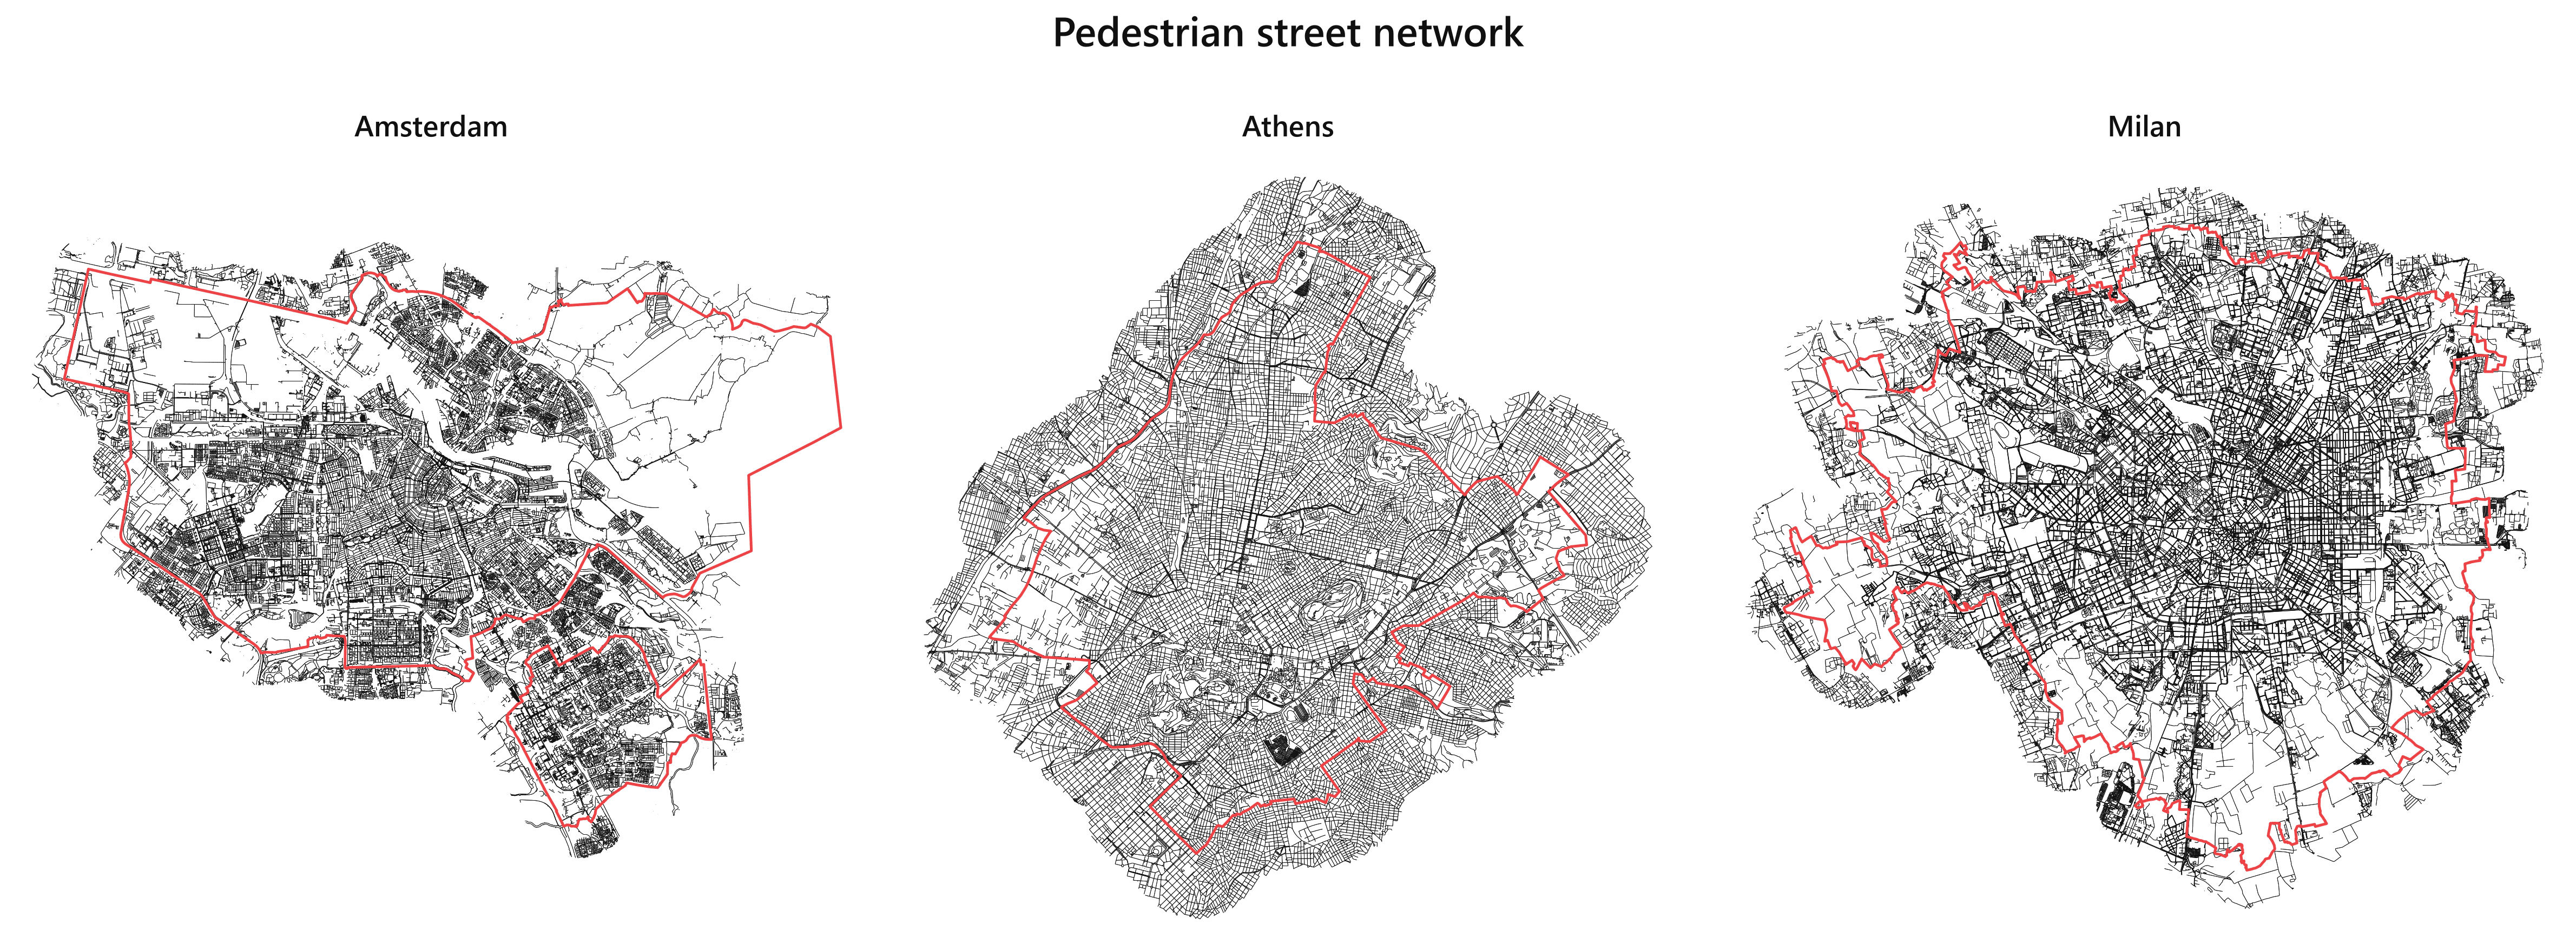
The first step is to represent how people move through the city. accessX retrieves the pedestrian street network and assigns a travel cost to each network edge. In the case-study notebooks, this cost is expressed as walking time, using an average walking-speed assumption that can be selected by the user. This allows the library to calculate how far people can walk through the actual street network, rather than relying on straight-line distances.
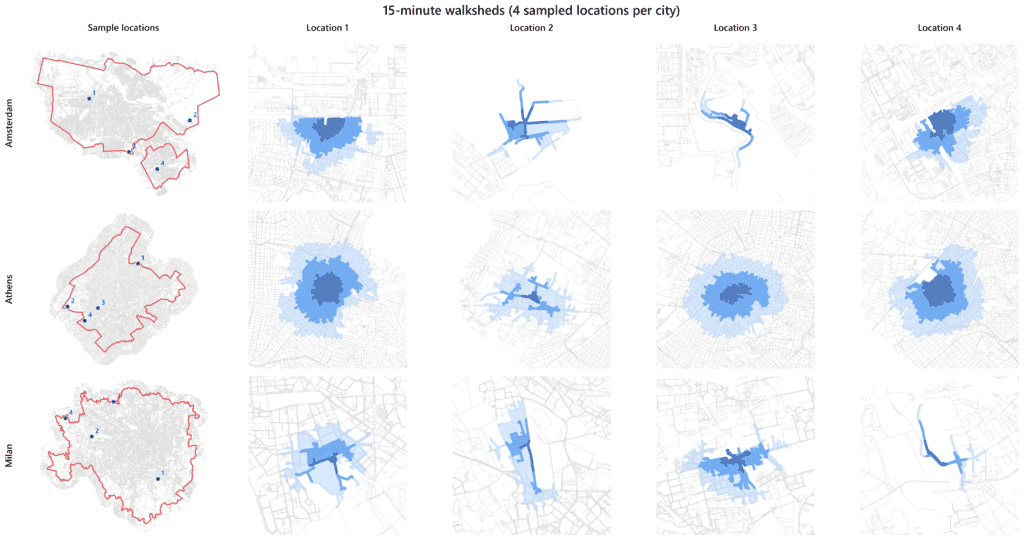
The isochrone workflow illustrates this logic by generating 5-, 10-, and 15-minute walking catchments from selected origins. These outputs show the reachable area around each origin and provide an intuitive visual layer for communicating accessibility. They also help reveal how local street-network structure shapes pedestrian access: two locations with the same circular distance from a destination may have very different walkable catchments once the street network is taken into account.
What Opportunities Are Reachable Within 15 Minutes?
Once the walking network is prepared, accessX retrieves and organizes destinations from OpenStreetMap. The case studies group POIs into analytical categories such as healthcare, education, daily needs, open space and play, and public transport. This makes it possible to move from raw OSM tags to planning-relevant questions, such as: how many healthcare facilities, parks, schools, or public transport stops are accessible within a 15-minute walk?
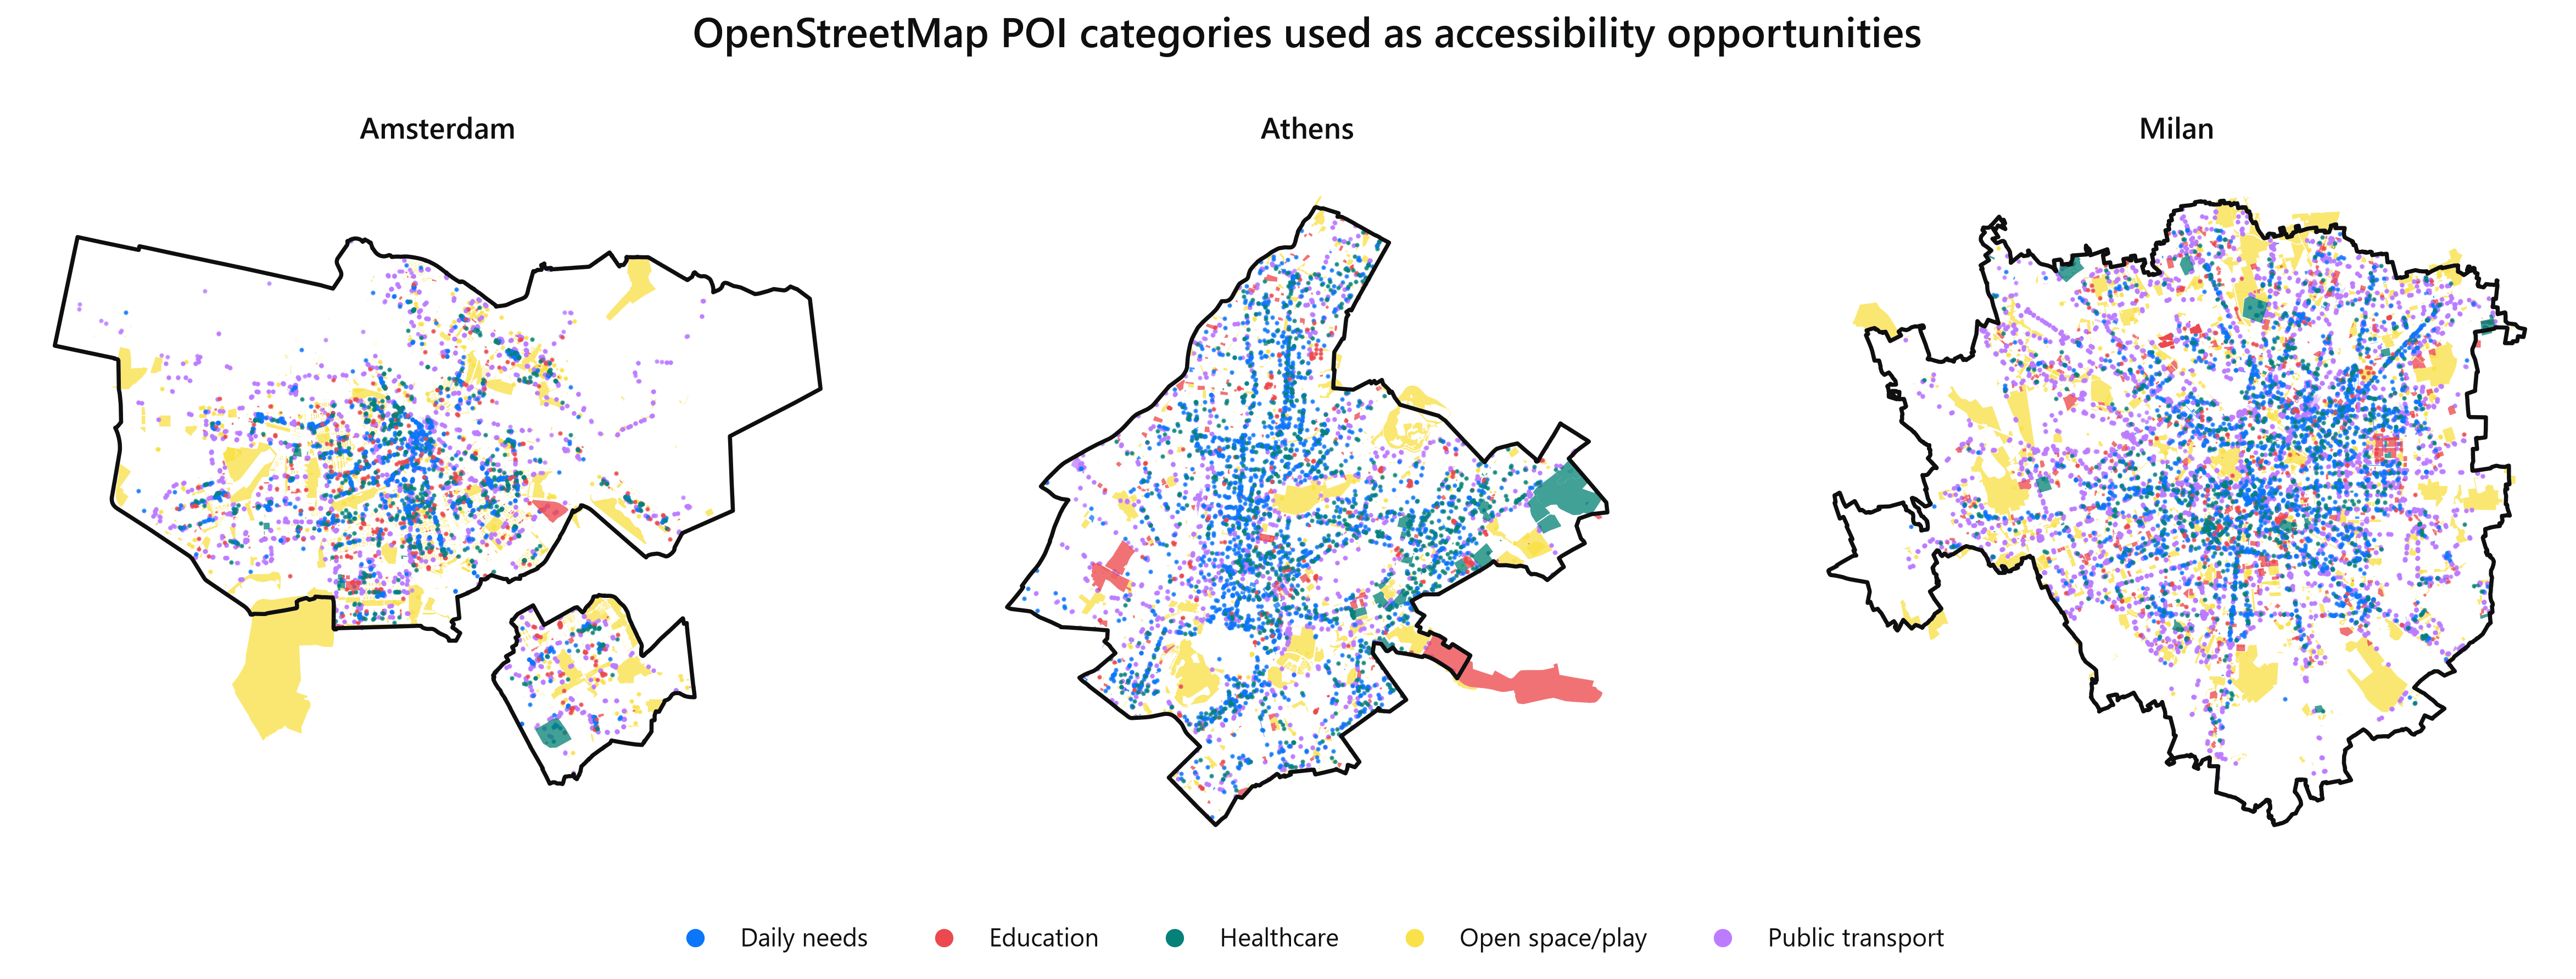
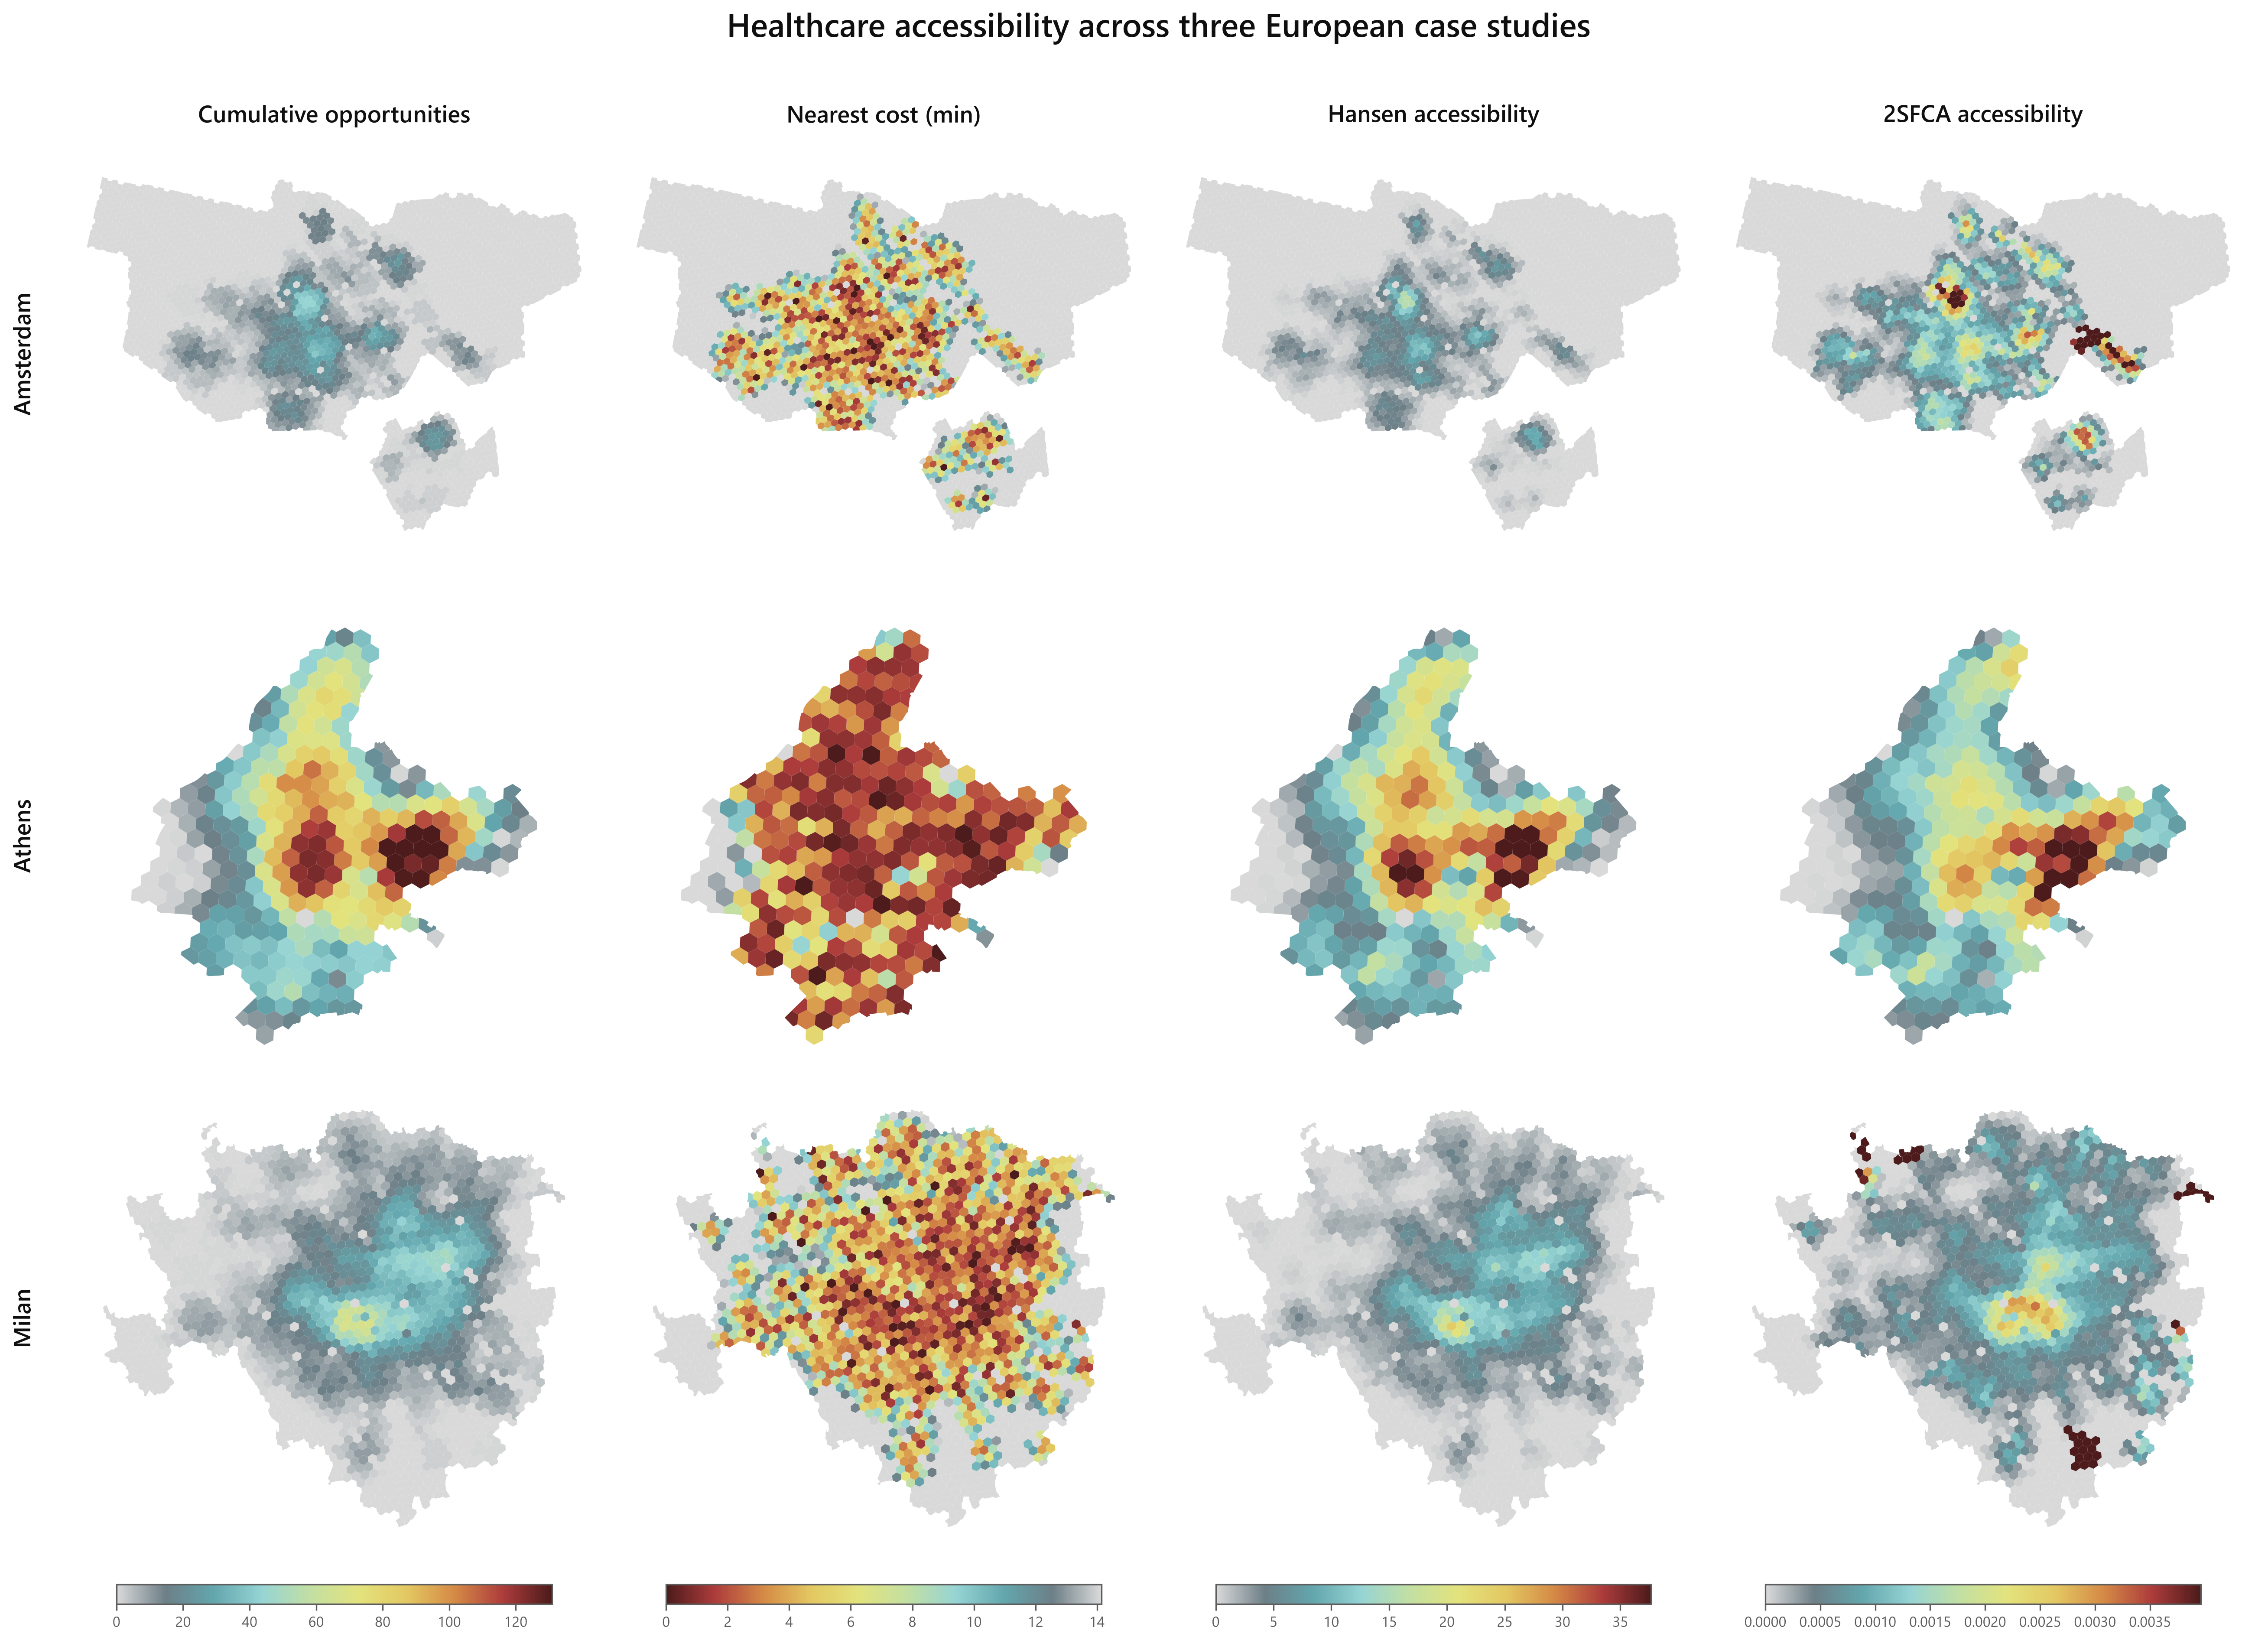
The accessibility workflow answers this question using several complementary indicators:
- Cumulative opportunity measure counts how many destinations of each type can be reached from each hexagon within the 15-minute walking threshold.
- Nearest-POI measures estimate the walking cost to the closest destination of each type.
- Hansen-type accessibility gives more importance to nearby opportunities.
- Two-step floating catchment area relates service supply to accessible population demand.
This list is not exhaustive and will be expanded to include additional methods. Conceptually, the availability of multiple indicators is in line with the whole accessX library structure, which does not define accessibility in only one way. Instead, the same network, origin grid, and destination data can be evaluated through different measures depending on the planning question. A municipality interested in minimum service proximity may focus on nearest facilities. A study of 15-minute city performance may use cumulative opportunities. A service-planning analysis may use 2SFCA to compare supply with accessible demand.
How Equally is Access Shared Across the City?
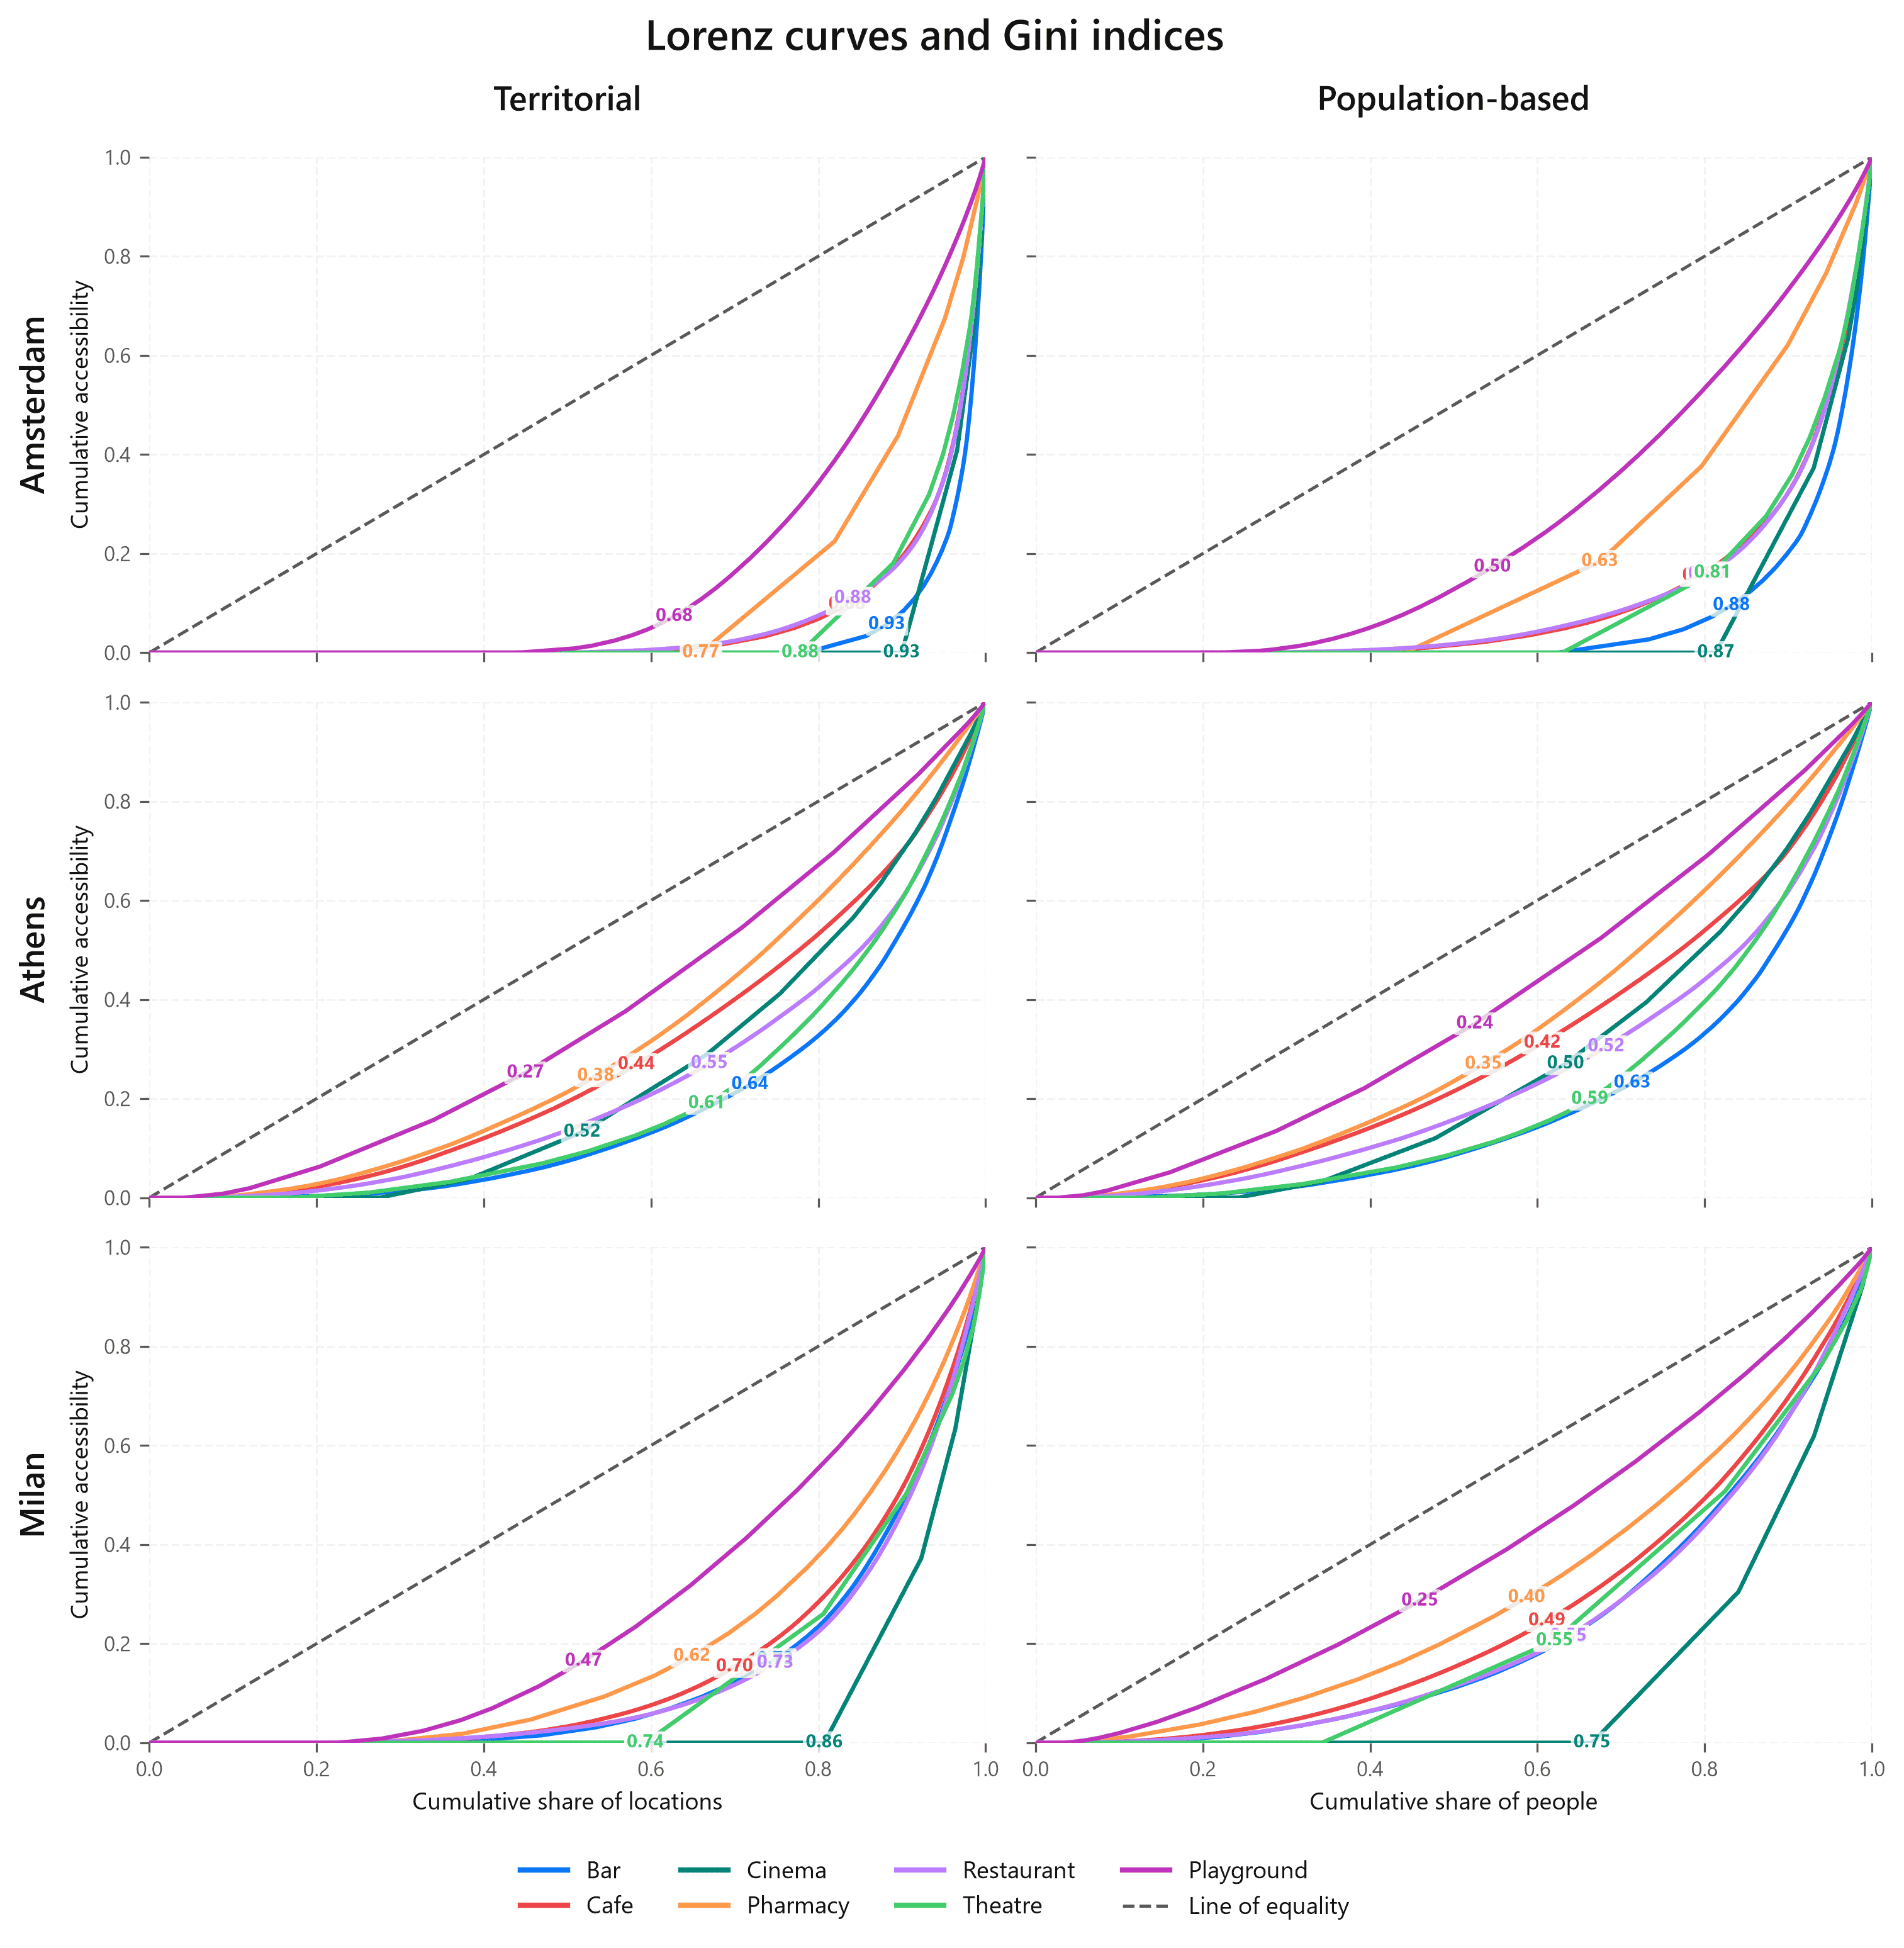
The case-study notebooks then move from accessibility measurement to equity assessment. This is important because high average accessibility does not necessarily mean that access is fairly distributed. A city may perform well overall while still leaving specific neighborhoods or population groups with limited access to essential opportunities.
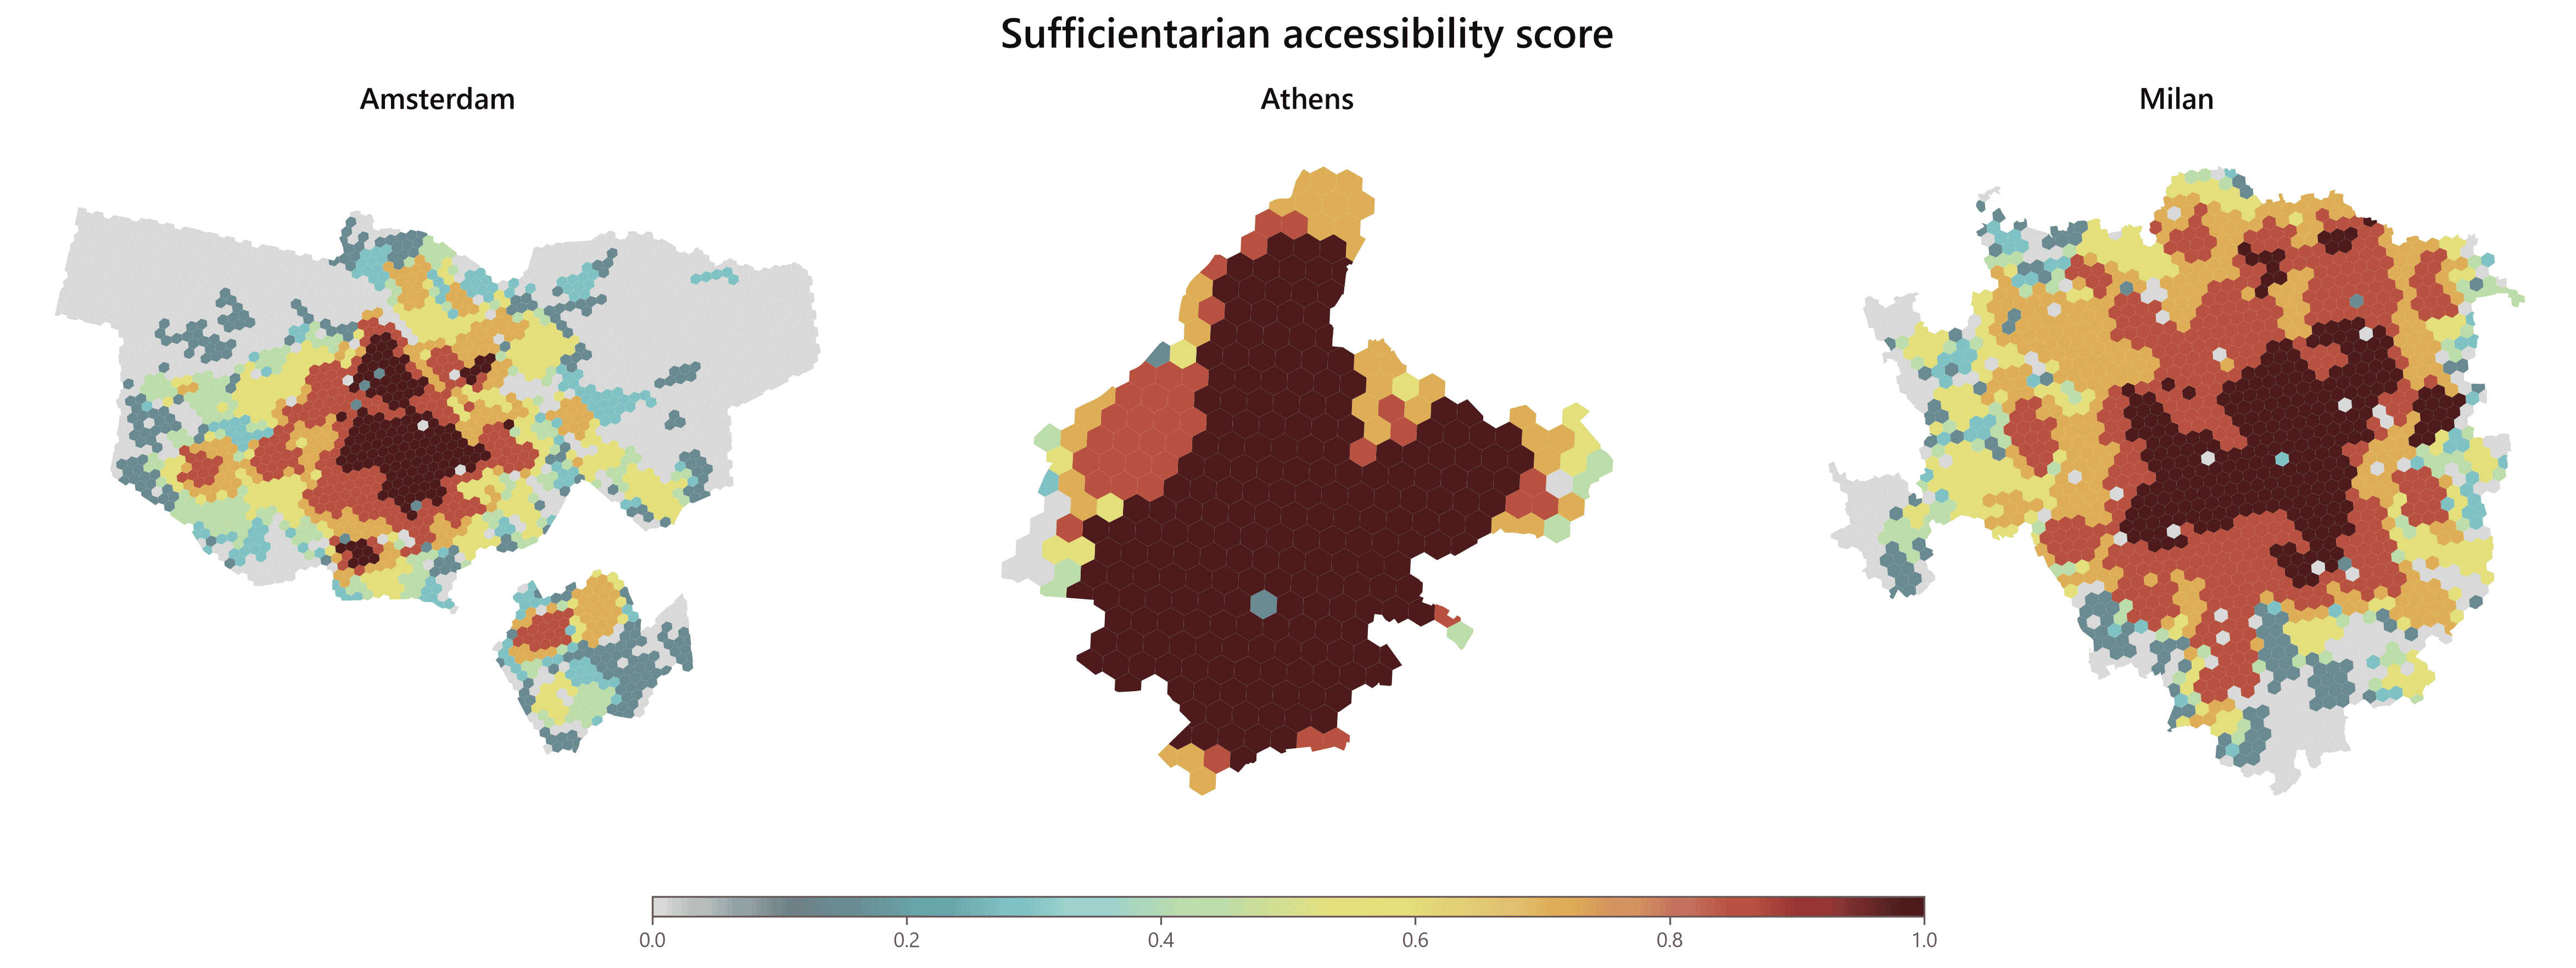
accessX supports two complementary equity perspectives. The first is egalitarian: it evaluates how evenly accessibility is distributed across spatial units or population-weighted groups using Lorenz curves and Gini coefficients. The second is sufficientarian: it asks whether each place or population group reaches a minimum acceptable level of access (Lucas et al, 2016; Milias et al., 2025).
In the sufficientarian case study, each hexagon is evaluated against a basket of minimum accessibility thresholds, including access to at least one bar, cafe, cinema, pharmacy, restaurant, theater, and playground. This translates accessibility into a simple policy-relevant question: which parts of the city satisfy a basic set of everyday opportunities within walking reach? The results can be summarized territorially, treating each hexagon equally, or population-based, weighting each hexagon by the number of residents. This distinction matters because an inaccessible area with few residents has a different policy implication from an inaccessible area where many people live.
Which Parks and Public Squares Promote Intergenerational Encounters in Amsterdam?
The final case study shifts the perspective from origins to destinations. Instead of only asking what residents can reach from where they live, accessX can also ask who can reach a given destination. This is the logic of co-accessibility.
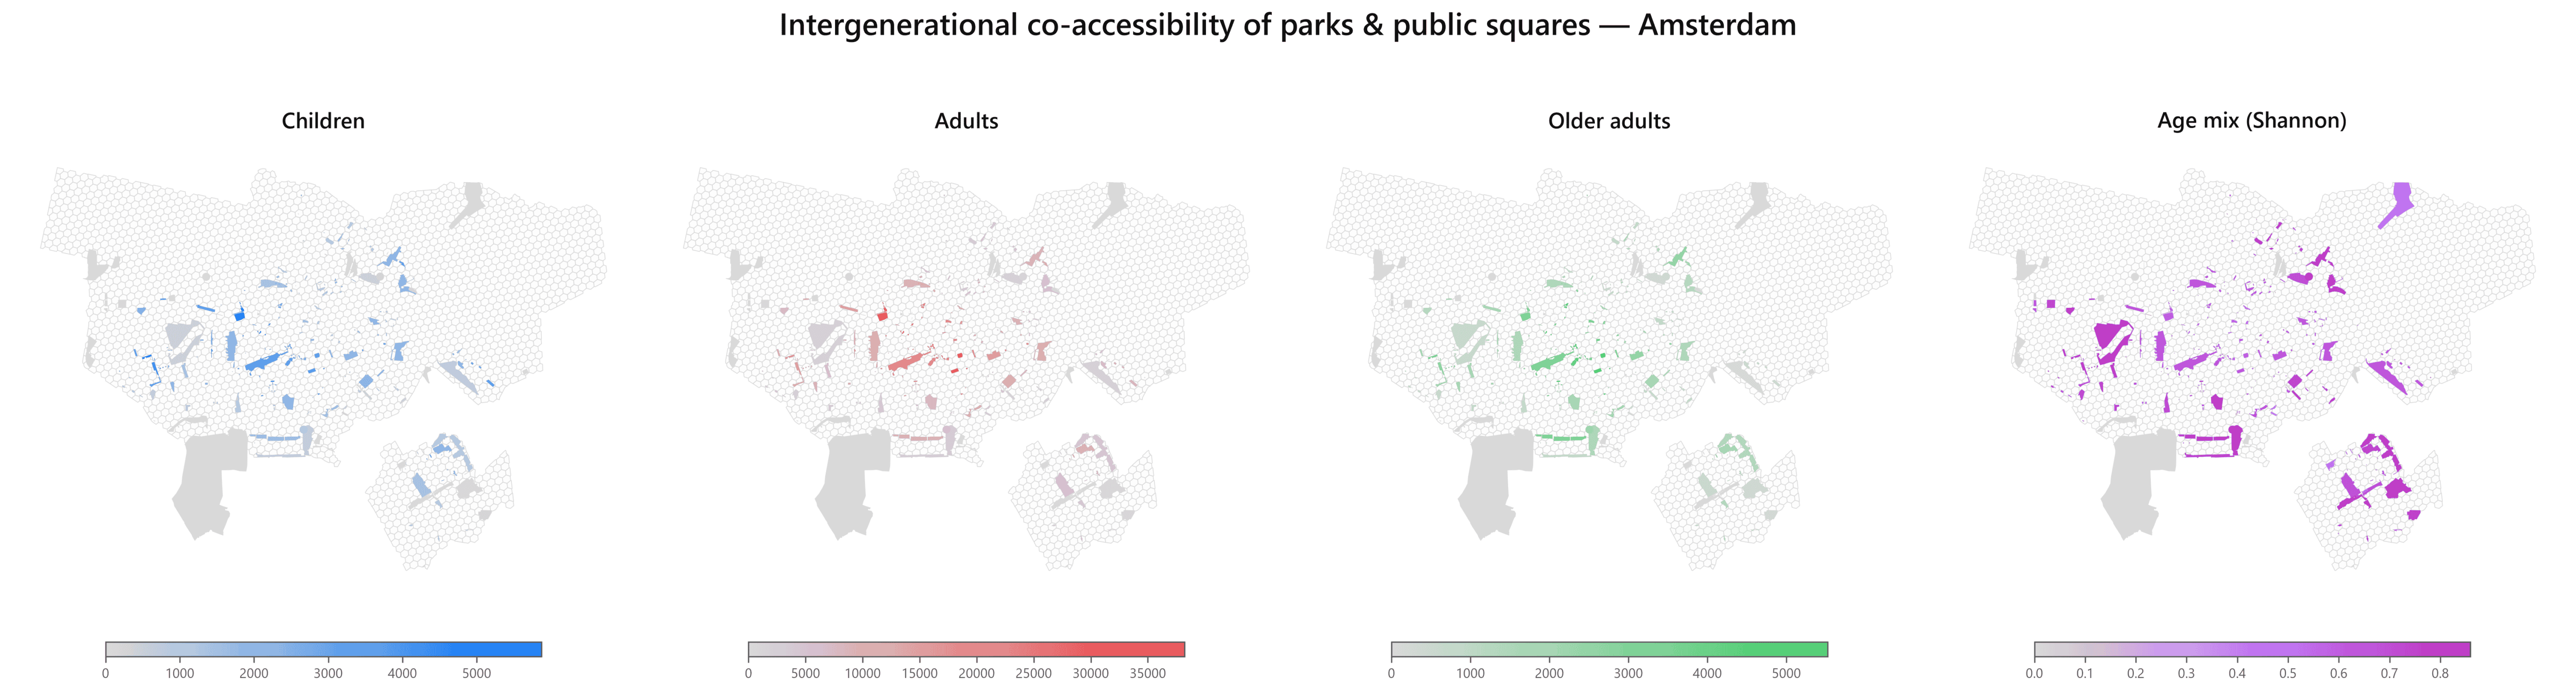
The Amsterdam co-accessibility example focuses on parks and public squares as potential spaces of everyday encounter. For this case study, accessX combines the pedestrian street network and public-space destinations with population data from Statistics Netherlands (CBS). This dataset provides information by population group, allowing the analysis to estimate not only how many people can reach each public space within a 15-minute walk, but also which age groups are represented in its walkable catchment.
For each park or public square, accessX estimates the accessible population of children, adults, and older adults. The analysis then uses a normalized Shannon diversity score to identify destinations with a more balanced mix of age groups within walking reach. Public spaces with high co-accessibility and high age-group diversity may have stronger potential to support intergenerational encounters, shared use, and inclusive public life.
This example also highlights the modularity of the library. While accessX can rely on default open-data inputs such as OpenStreetMap and WorldPop, it does not require users to work only with these sources. Locally available datasets, such as the CBS population data in the Amsterdam case, can be integrated into the same workflow as long as they can be linked to the spatial units of analysis. In this way, accessX supports both rapid open-data assessments and richer context-specific analyses.
Conclusions & Future Development
accessX demonstrates how accessibility analysis can be organized as a transparent and reproducible workflow, from data preparation to policy interpretation. Starting from an area of interest, the library supports the creation of a common spatial grid, the retrieval or integration of street networks, the definition of travel costs, the collection and classification of opportunities, the estimation of multiple accessibility indicators, and the evaluation of distributional and threshold-based equity. It can also reverse the analytical perspective through co-accessibility analysis, estimating the population catchments of destinations and their potential to support shared access and encounter.
Beyond its technical functionality, the broader aim of accessX is to support a more standardized and collaborative way of conducting accessibility studies. Many researchers and practitioners currently perform similar analytical steps, but often through different scripts, assumptions, data structures, and hidden undocumented decisions. This limits comparability and increases the risk that important methodological differences remain unnoticed. By providing a common open-source framework, accessX aims to reduce this fragmentation while still allowing users to adapt the workflow to their own research questions, datasets, and local contexts.
This need is especially important in the current era of AI-assisted coding and analysis. AI tools can help researchers develop code faster, but they may also hide algorithmic details, reproduce errors, or generate workflows that appear correct without being fully inspected. For accessibility studies, where small methodological choices can significantly affect results and policy conclusions, transparency is essential. Open-source libraries such as accessX can help make these choices visible, auditable, and reusable.
Future work will focus on expanding the library through additional accessibility measures, travel-cost functions, data connectors, visualization tools, and case-study examples. Equally important, accessX is intended as a collaborative platform. Researchers and practitioners are encouraged to contribute new methods, test the library in different urban contexts, report limitations, and collectively improve its functionality. In this sense, accessX is not only a tool for producing accessibility maps, but a step toward a shared, transparent, and evolving standard for accessibility research and practice.
Acknowledgments
This research received no specific grant from any funding agency in the public, commercial, or not-for-profit sectors. The analyzed data were treated according to the GDPR-General Data Protection Regulation (EU, 2016/679). During the preparation of this work, the authors used ChatGPT to initially structure the python code, and enhance clarity, coherence, and readability of the manuscript text. After using these tools/services, the authors manually reviewed and thoroughly edited all generated outputs and take full responsibility for the content of the research and publication. Mention of trade or commercial products does not constitute endorsement or recommendation by the authors.
References
Abdelfattah, L., Albashir, A., Ceccarelli, G., Gorrini, A., Messa, F., & Presicce, D. (2025). The Right to the Night City: Exploring the Temporal Variability of the 15-min City in Milan and Its Implications for Nocturnal Communities. Computers, 14(1), 22. https://doi.org/10.3390/computers14010022
Abdelfattah L., Deponte D., & Fossa G. (2022). The 15-minute city as a hybrid model for Milan. TeMA – Journal of Land Use, Mobility and Environment, 71-86. https://doi.org/10.6093/1970-9870/8653
Albashir, A., Messa, F., Presicce, D., Pedrazzoli, A., & Gorrini, A. (2024). 15min City Score Toolkit – Notebook. In Transform Transport Open Source Collection. Zenodo. https://doi.org/10.5281/zenodo.14231427
Boeing, G. (2017). OSMnx: New methods for acquiring, constructing, analyzing, and visualizing complex street networks. Computers, environment and urban systems, 65, 126-139. https://doi.org/10.1016/j.compenvurbsys.2017.05.004
Boeing, G. (2025). Modeling and Analyzing Urban Networks and Amenities with OSMnx. Geographical Analysis 57 (4), 567-577. https://doi.org/10.1111/gean.70009
Büttner, B., Silva, C., Merlin, L., & Geurs, K. (2024). Just around the corner: Accessibility by proximity in the 15-minute city. Journal of Urban Mobility, 6, 100095. https://doi.org/10.1016/j.urbmob.2024.100095
Foti, F., Waddell, P., & Luxen, D. (2012). A generalized computational framework for accessibility: from the pedestrian to the metropolitan scale. In Proceedings of the 4th TRB conference on innovations in travel modeling. Transportation research board (Vol. 98). https://onlinepubs.trb.org/onlinepubs/conferences/2012/4thITM/Papers-A/0117-000062.pdf
Hagberg, A. A., Schult, D. A., & Swart P. J., (2008). Exploring network structure, dynamics, and function using NetworkX. In Proceedings of the 7th Python in Science Conference (SciPy2008), Gäel Varoquaux, Travis Vaught, and Jarrod Millman (Eds), (Pasadena, CA USA), pp. 11–15, Aug 2008. https://www.osti.gov/biblio/960616
Handy, S. (2023). Shifting gears: Toward a new way of thinking about transportation. MIT Press.
Hansen, W. G. (1959). How accessibility shapes land use. Journal of the American Institute of planners, 25(2), 73-76. https://doi.org/10.1080/01944365908978307
Levinson, D., & Wu, H. (2020). Towards a general theory of access. Journal of Transport and Land Use, 13(1), 129-158. https://doi.org/10.1016/j.trd.2020.102355
Lucas, K., Van Wee, B., & Maat, K. (2016). A method to evaluate equitable accessibility: combining ethical theories and accessibility-based approaches. Transportation 43(3): 473–490. https://doi.org/10.1007/s11116-015-9585-2
Luo, W., & Wang, F. (2003). Measures of spatial accessibility to health care in a GIS environment: synthesis and a case study in the Chicago region. Environment and planning B: planning and design, 30(6), 865-884. https://doi.org/10.1068/b29120
Milias, V., & Psyllidis, A. (2022). Measuring spatial age segregation through the lens of co-accessibility to urban activities. Computers, Environment and Urban Systems, 95, 101829. https://doi.org/10.1016/j.compenvurbsys.2022.101829
Milias, V., Psyllidis, A., & Bozzon, A. (2024). Bridging or separating? Co-accessibility as a measure of potential place-based encounters. Journal of Transport Geography, 121, 104027. https://doi.org/10.1016/j.jtrangeo.2024.104027
Milias, V., Tsigdinos, S., Tzouras, P. G., & Kepaptsoglou, K. (2025). Assessing equitable access in X-minute cities through open spatial data. Environment and Planning B: Urban Analytics and City Science, 23998083251398660. https://doi.org/10.1177/23998083251398660
Moreno, C., Allam, Z., Chabaud, D., Gall, C., & Pratlong, F. (2021). Introducing the “15-Minute City”: Sustainability, resilience and place identity in future post-pandemic cities. Smart cities, 4(1), 93-111. https://doi.org/10.3390/smartcities4010006
Pappalardo, L., Simini, F., Barlacchi, G., & Pellungrini, R. (2022). Scikit-mobility: A Python library for the analysis, generation, and risk assessment of mobility data. Journal of Statistical Software, 103, 1-38. https://doi.org/10.18637/jss.v103.i04
Pereira, R. H. M., Saraiva, M., Herszenhut, D., Braga, C. K. V., & Conway, M. W. (2021). r5r: Rapid Realistic Routing on Multimodal Transport Networks with R5 in R. Findings, 21262. https://doi.org/10.32866/001c.21262
Simons, G. (2023). The cityseer Python package for pedestrian-scale network-based urban analysis. Environment and Planning B: Urban Analytics and City Science, 50(5), 1328-1344. https://doi.org/10.1177/23998083221133827
Tatem, A. J. (2017). WorldPop, open data for spatial demography. Scientific data, 4(1), 170004.
Uber, (2018). H3: Uber’s Hexagonal Hierarchical Spatial Index. Accessed June 22, 2026. Retrieved from: https://www.uber.com/blog/h3/
Wang, F., & Luo, W. (2005). Assessing spatial and nonspatial factors for healthcare access: towards an integrated approach to defining health professional shortage areas. Health & place, 11(2), 131-146. https://doi.org/10.1016/j.healthplace.2004.02.003
WorldPop, (N.D.). WorldPop – Open Spatial Demographic Data and Research. Accessed July 10, 2026. Retrieved from: https://www.worldpop.org/
accessX: Additional Resources
accessX: an open-source Python library for accessibility analysis: This modular toolkit can build networks, model travel costs, and compute reachable opportunities from open spatial data (OSM-first, extensible, reproducible).