
Sharing mobility, carsharing in particular, requires a thorough analytical approach to be fully understood and planned. The aim of this article is to provide an extensive analysis of the relation between the utilization of carsharing vehicles and urban spatio-temporal patterns, focusing on the analysis of 4 weeks of free-flow carsharing data in the City of Milan. Since both temporal and spatial phenomena are influencing the carsharing demand, time-invariant factors (resident population density, etc.) and time-variant factors (public transport offer) were taken into consideration and analyzed in relation to starting and ending point of rentals, and OD couples’ characteristics. All the statistical analyses are performed on the weekday’s and weekend’s average values for each hour of the day, resulting in a series of daily utilization patterns unveiling the relationship between site-specific characteristics in respect to carsharing demand.
Introduction
This article is the second part of a free-flow carsharing series and proposes an innovative approach to understand carsharing utilization patterns by analyzing trip data of a free-flow system in Milan, Italy, acquired in real-time through API endpoints during 4 weeks, from April 12th 2021 to May 09th 2021. Each trip data consists of the starting and ending points of the rental, with the respective timestamps, thus it can be located temporally and spatially in the urban territory.
The analyzed data adds up to a total of 312,406 starting and ending points (i.e., Rental Events), divided in weekday and weekend datasets in order to comprehend commuting-related phenomena. Since the aim of the research is to understand spatial and temporal relations, the statistical analyses are performed by looking at 60 minutes long timespans, allowing the authors to build daily profiles that describe the constantly changing factors influencing and shaping the mobility demand. For this reason, three categories of factors were considered: i) Populations, namely resident and working population densities, ii) Points of Interest, such as the density of diverse kind of amenities, and iii) Public Transport offer.
While the first part of this series includes a general overview of the mode typology, this article mainly focuses on the analytical process already considered by other authors. In particular, it is noted how traditional modelling approaches focus on the operational aspects of carsharing, both for station-based systems (Kek et al., 2006), free-flow systems (Kortum et al., 2012), and e-vehicle free-flow systems (Bruglieri et al. 2013), proposing allocation modelling methodology to properly locate vehicles and operational techniques to meet the demand. In this framework, it emerges how demographic characteristics and household density play an important role in mobility demand estimation (Kortum et al., 2012). Other approaches (Heilig et al., 2018) utilize agent-based travel demand models to further develop current planning tools to include this additional transport mode.
An alternative research track is proposed through a spatio-temporal approach, with the goal of analyzing the relation between demand and external factors, such as weather and socio-demographic data (Schmöller & Bogenberger 2013), and subsequently by analyzing time-defined spatial clusters of demand in relation with demographic distribution (Schmöller et al., 2015). Similarly, trip data has been analyzed using GPS traces registering trips chains in relation to users’ demographic characteristics (Leclerc et al., 2013).
Enabling Data and Methodology
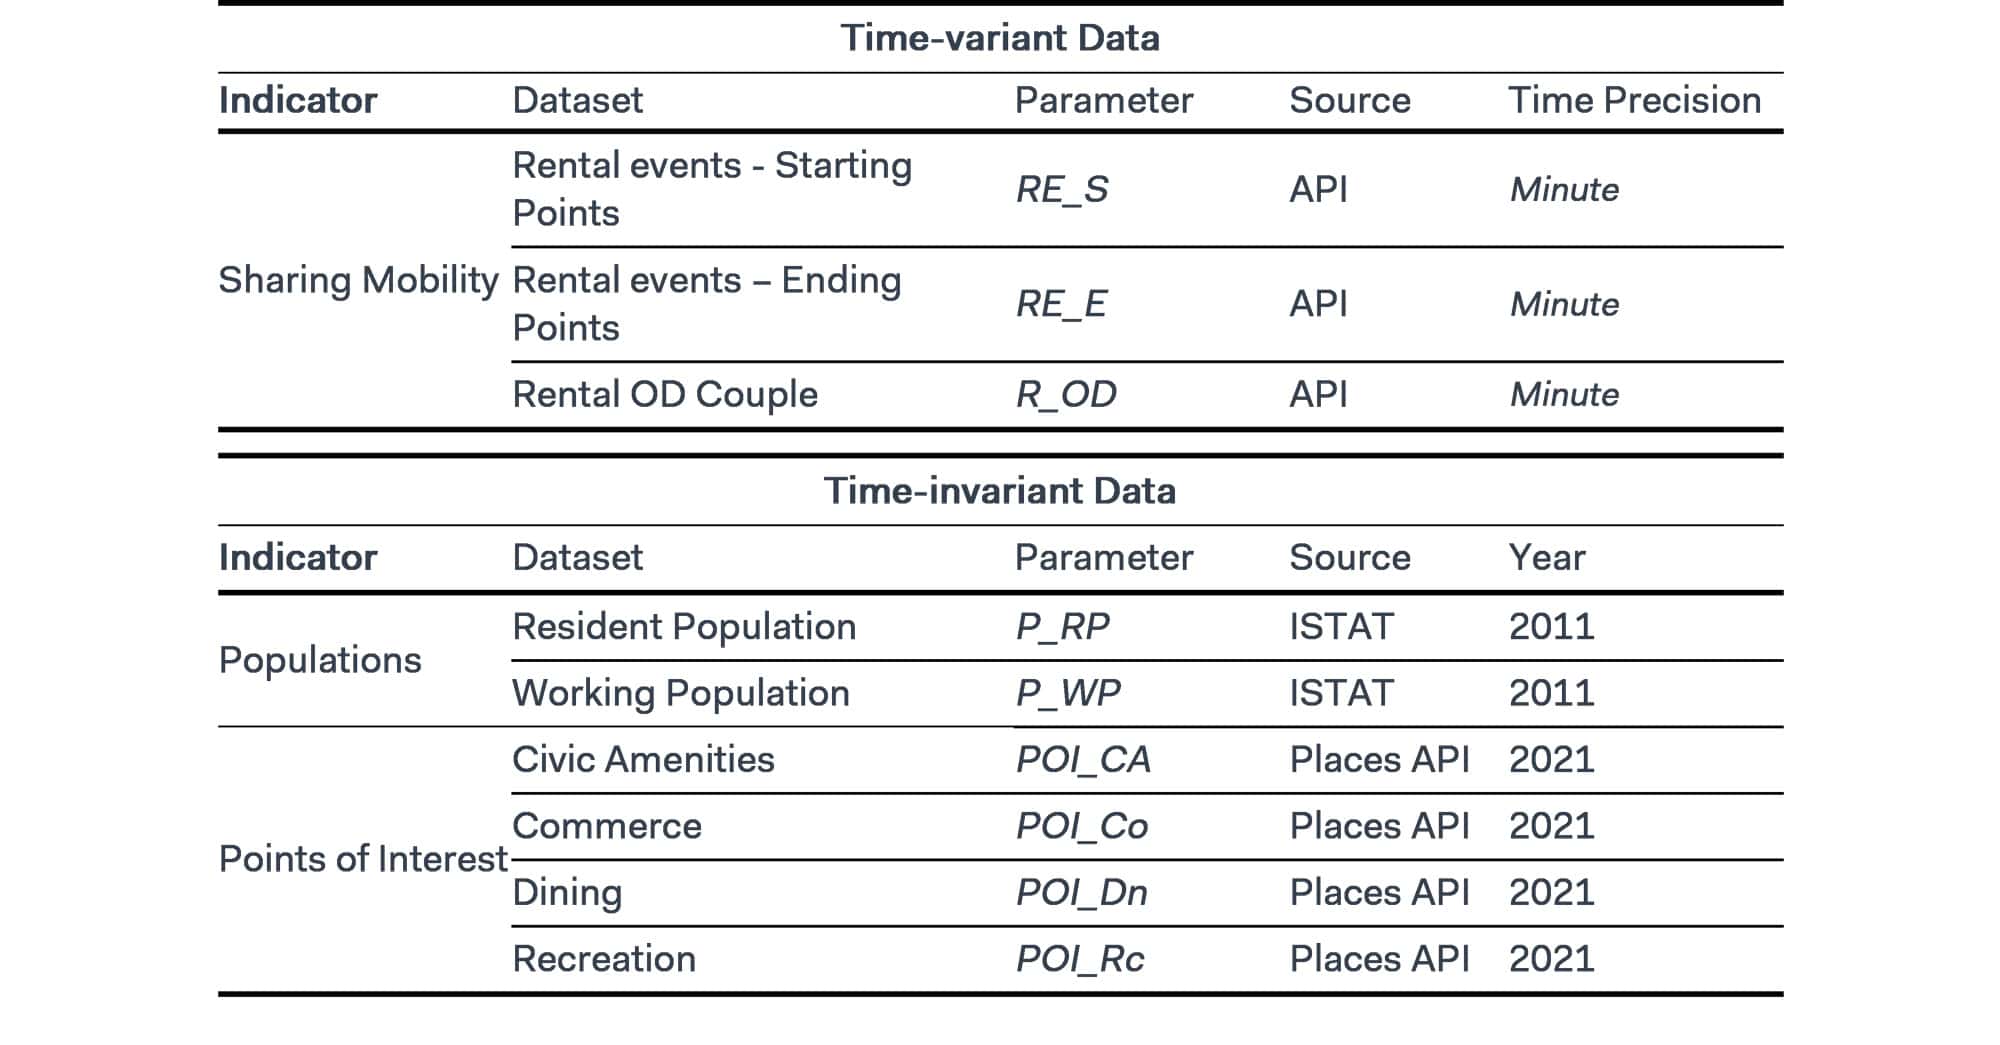
The main source of data used in the research is acquired in real-time through API endpoints of one of the carsharing operators active in Milan in the period comprised between April 06th 2021 and May 12th 2021. The information included in the dataset are the starting and ending points of each rental, with the associated geographical coordinates, timestamps and rental ID, thus all the information needed to spatially and temporally locate the Events (i.e., starting and ending of the rental) and the OD couple between the two points. The rest of the data used in the research is gathered from open-data sources and Google Places API queries and it is summarized in Table 1.
This article focuses on a preliminary analysis of a week of vehicle data of one of the carsharing operators active in Milan in 2020. The structure of this exploratory data analysis is aimed at discovering potential patterns, basis of future research, and highlighting the possibilities and the limitation of dataset analyses based only on origin and destination points (i.e., where and when the vehicle is rented and parked). In particular, the data considered for the sake of this article is acquired in real-time through API endpoints, building a dataset of starting and ending points of the rental, with the respective timestamps. Descriptive statistics of the data are shown in Table 1.
Analysis timeframe and spatial constraints definition
Since one of the research questions was to highlight patterns, the data was divided between weekdays and weekend, covering 4 weeks divided in two phases. The phases were introduced as different levels pandemics restrictions were present, but the discrepancy didn’t appear statistically significant, hence it’s not consider in the following steps.
Furthermore, the rental dataset was referred to a grid, specifically the H3 hexagon grid, a hierarchical geospatial index developed by Uber. The number of hexagons included in the Milan Municipality border is 1,904, covering an extremely heterogeneous land use, for the purpose of this research the hexes were filtered so that only the cells with a number of Events greater than the 20th percentile (26.000) of the distribution were selected, resulting in 969 hexagons that were analyzed, as shown in Figure 1.
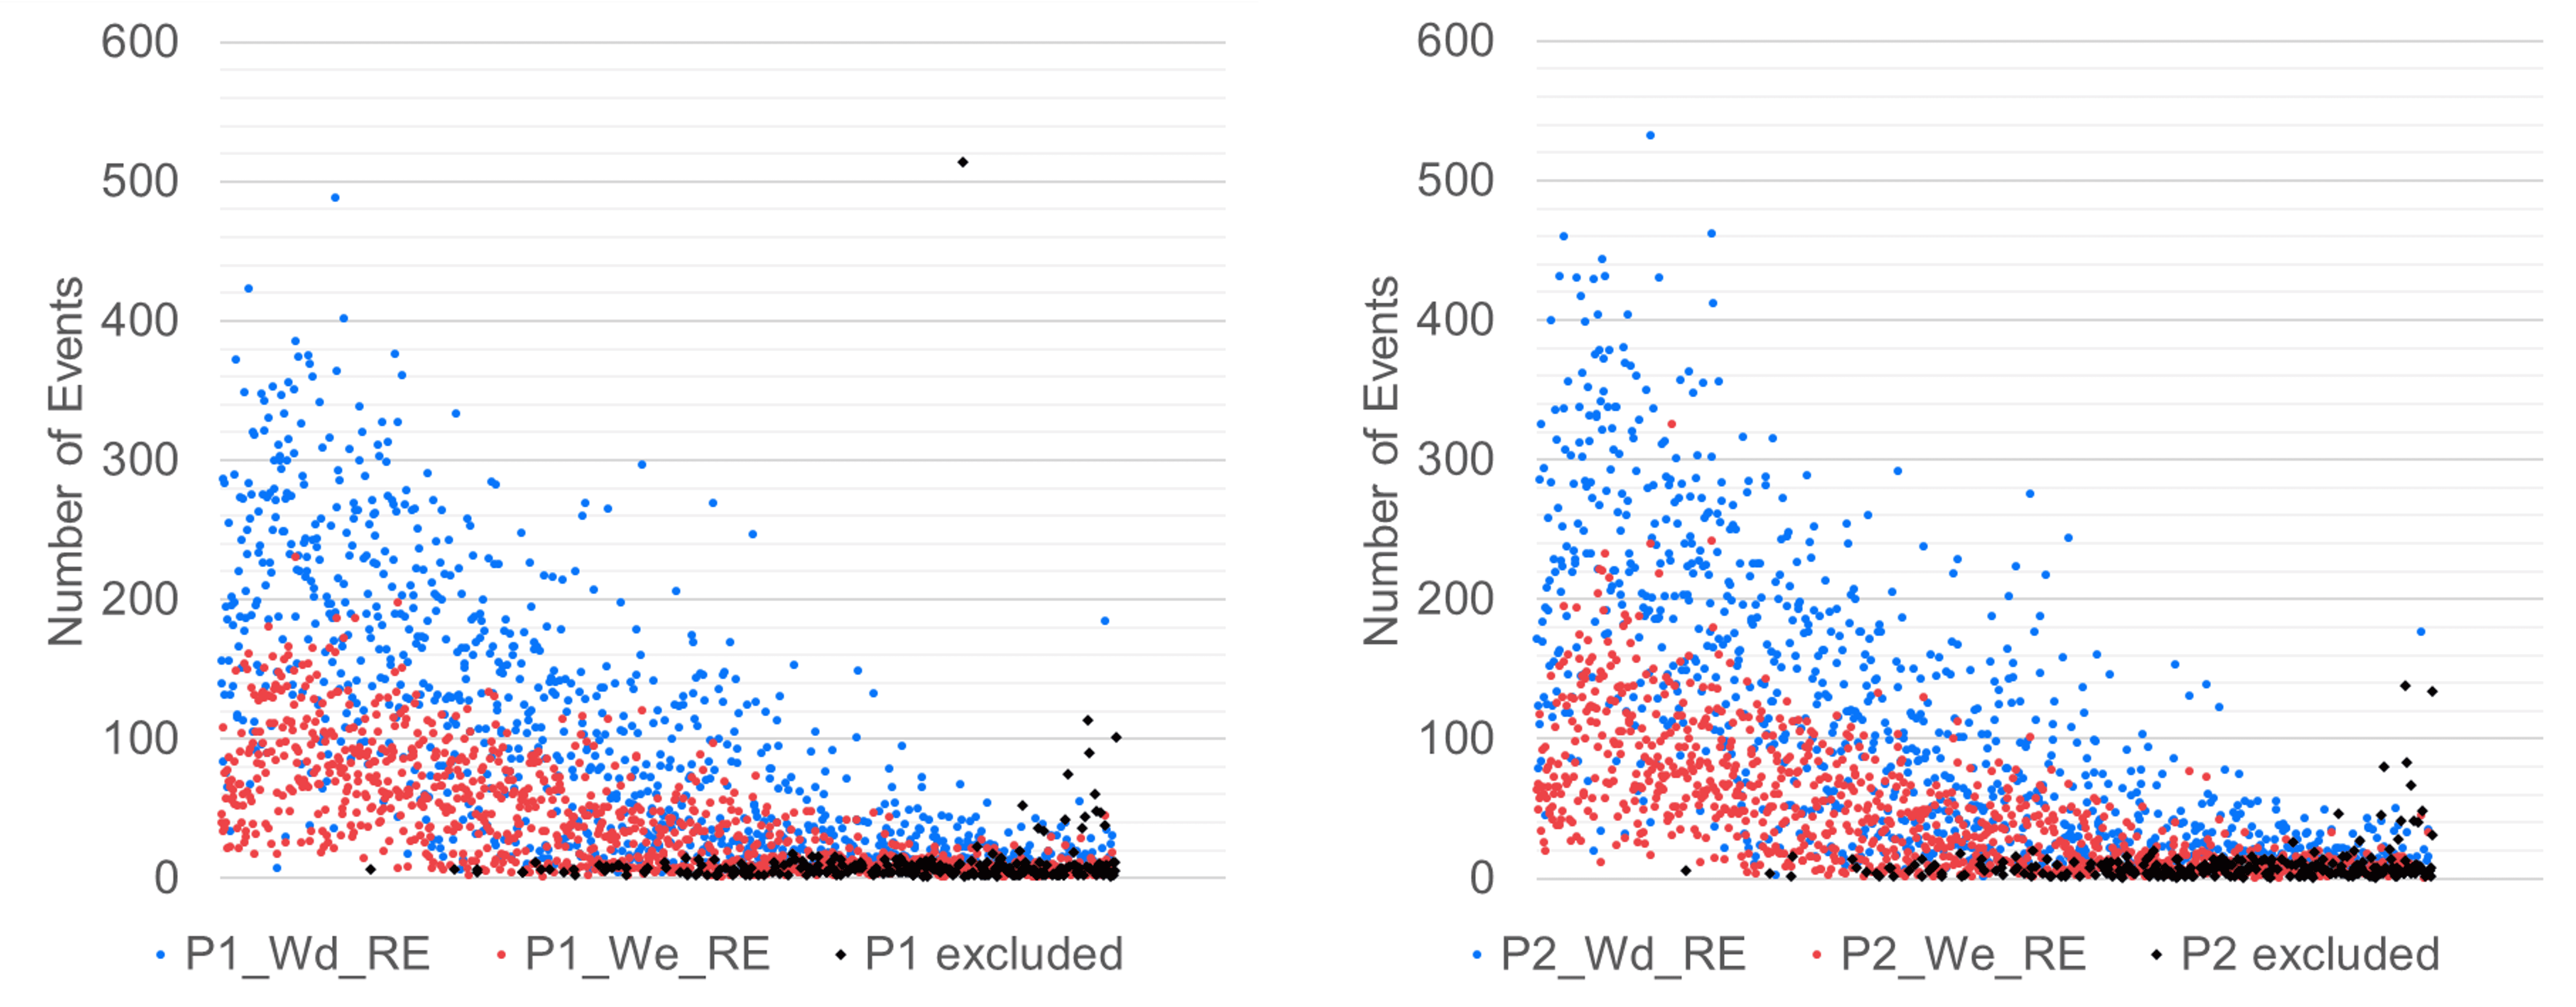
The overall number of Rental Events (RE) considered in the analysis is 312,406 over a total of 315,435 for the same timeframe, where the excluded portion accounts for about 1% of the dataset. Moreover, Starting set (RE_S) and Ending set (RE_E) are considered conceptually as two separate datasets, taking into account exclusively the spatial and temporal position of such events.
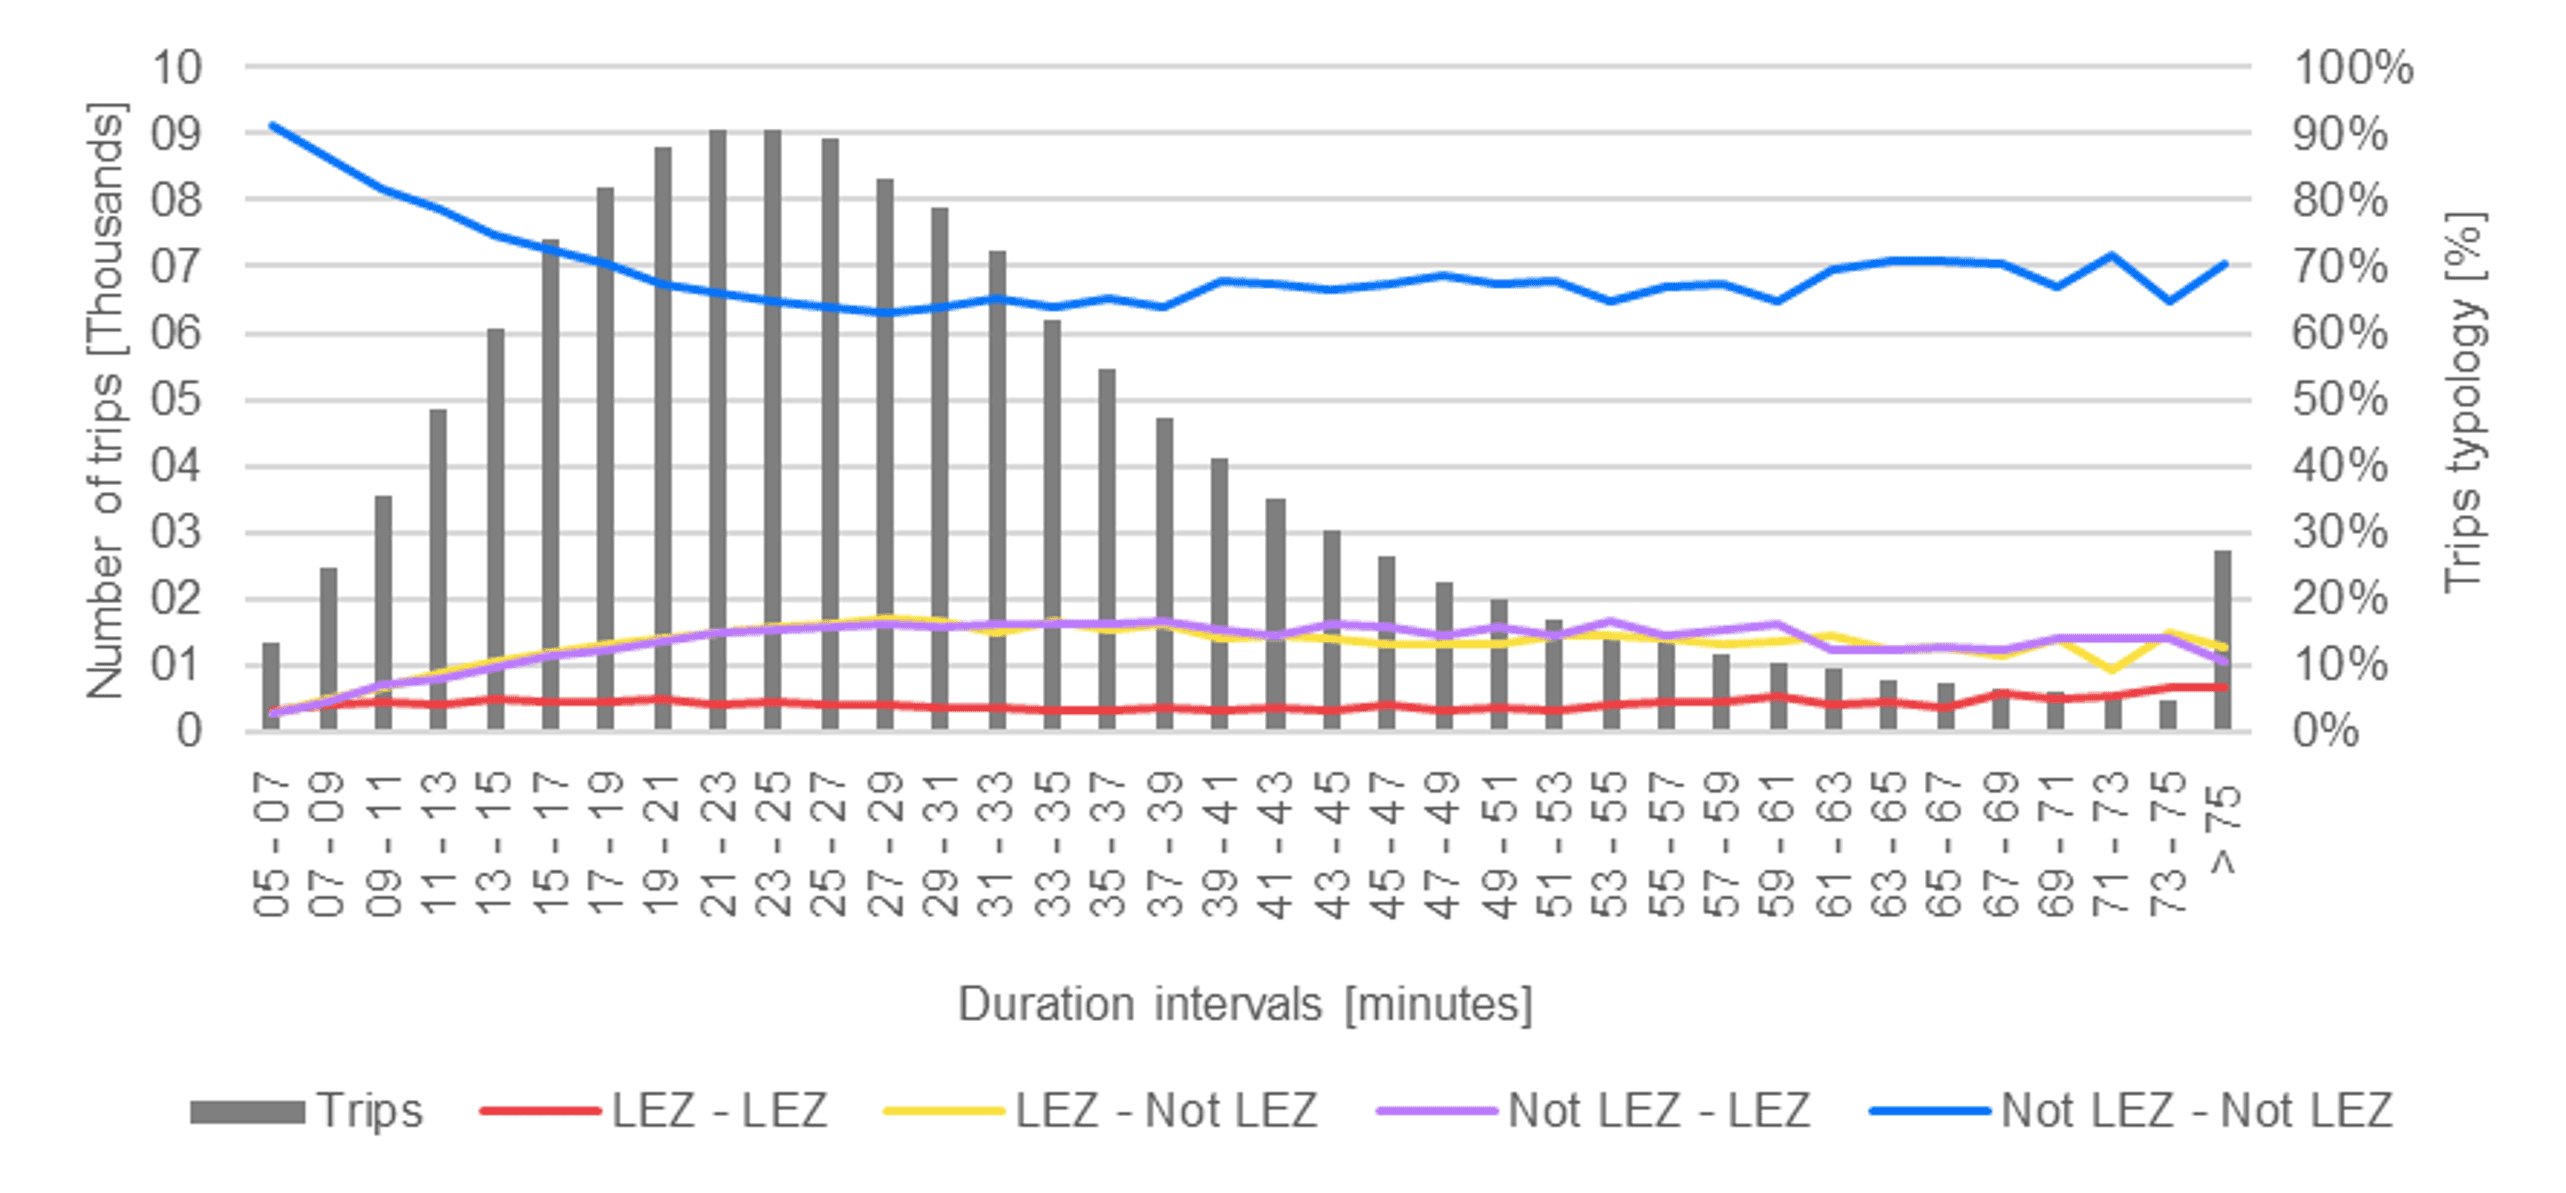
On the other hand, the Rental OD Couple dataset (R_OD) is based on the relation between the Events of the same trip. For this reason, the dataset is cleaned from i) the trips originating or ending outside the selected hexes, and from ii) the trips shorter than 5 minutes or longer than 90 minutes. Data validation resulted in 141,205 OD couples, defined by a starting hex, an ending hex and a duration. As shown in Figure 2, trips differ in duration and most of them are from 20 to 30 minutes long.
Spatio-Temporal Urban Data analyses
H3 hexagon were used to aggregated Urban Data as well, using a two-step spatial join methodology to avoid MAUP and edge-effect inaccuracies. Conceptually, the intent of the analyses based on the Urban Data is to understand how each parameter is influencing the carsharing demand (Rental Events), by taking into account both the spatial and the temporal location.
To understand the heterogenous factors that shape the demand, the task was split in smaller portions and different analyses for each dataset, in particular: i) a series of correlations (using Pearson’s Correlation Coefficient) between the Resident Population and Working Population, and the Events datasets, aimed at understanding the systematic relation between households, working places and carsharing demand; and ii) a series of multiple linear regression models between the Events datasets as dependent variables and the Points of Interest datasets as independent variables, aimed at understanding the role of each typology of amenity in relation to the carsharing demand. These calculations are performed for each of the 60 minutes long timespans, in order to build a daily profile able to represent the time-variant nature of the demand.
Results
The analyses were aimed at identifying relations between Urban Data and carsharing demand. The first portion of the outcomes consists in a series of correlations between the Events datasets, which represent the origins and the destinations of the demand, and the Populations datasets. The results of the analyses are arranged by Starting Points and Ending Points, for the weekday and weekend dataset, shown in Figure 3.
The results of the multiple regression models between the demand datasets and the POI datasets are expressed as charts for the dependent values datasets, in this article just the weekday results were included. The outputs are organized as daily profiles, showing only the results where the model has an adjusted r square value ≥ 0.3. The Beta coefficient values for the four Points of Interest parameters are expressed only if significant (P value < 0.05), see Figure 4.
Conclusions
The analyses proposed in this article try to describe different aspects of the same framework: the sharing mobility utilization in an urban environment. Generally speaking, the mobility patterns of a city are defined by numerous and heterogenous factors, that hardly can be summarized in a single analysis. The roles of different kinds of mobility demand (e.g., work commuting, study commuting, occasional, touristic, etc.) and the availability of several modes (e.g., private cars, sharing mobility, public transport, soft mobility, etc.) account to the definition of a complex system that can be studied more effectively by looking at smaller portions.
The smaller tasks tackled here can be summarized around systematic and occasional mobility areas. In particular by looking at the correlation analyses results. The relation between the Rental Events and the Resident Population dataset was expected to be higher during the weekdays and lower during the weekends, and the results confirmed this hypothesis. The fact that the correlations are weak or moderate can be explained by the fact stated at the beginning of this section: carsharing mobility patterns are not influenced by a single factor, so a strong correlation was not expected and the focus is more on the relative weights of these values.
Another confirmed hypothesis is the difference between the starting and ending point datasets, that describe respectively the origins and the destinations. The r values are higher during the morning peak hour for the origins and during the afternoon peak hour for the destinations, showing a systematic usage pattern.
On the contrary, the Working Population results should be interpreted in a different way: the correlation coefficients seem to suggest a stronger relation with the Rental Events datasets, but in the authors’ opinion, this result cannot be completely explained as systematic mobility as Milan’s workplace and POI distribution follows very mono-centric patterns, therefore the correlation with the Working Population could be explained by the compresence of other factors, such as the amenities. This is further stressed by the fact that the correlation coefficients between the Working Population and the Rental Events datasets are compatible with the outputs of the multiple linear regression models. During the hours with coefficients showing a stronger relation, the regression models show a higher reliability as well, ranging from adjusted r squared values between 0.302 and 0.485. Considering these profiles as a method to understand the role of occasional mobility, the Beta coefficients values associated to the significant POI parameters can be referred as the relative weights of the influence of each amenity typology on the carsharing demand. Generally speaking, Figure 4 confirms expected patterns: i) Dining and Recreation datasets have a stronger weight during the evening, ii) Commerce dataset influences negatively the demand during the evening, iii) Civic Amenities dataset weight ceases to exist after office business hours.
The analyses proposed in this article move from the conceptualization proposed in the first part of the carsharing series, introducing a methodological approach to quantify the relation between some of the dimension of the mobility datasets. In particular, the focus is on starting and ending points, highlighting the relation between systematic and occasional mobility.
The results of this research has been presented at the 49th European Transport Conference 2021 (13-15 September 2021, Milan, Italy) and awarded the Neil Mansfield Award. Part of the results of this research has been published on Zenodo: Messa, F. (2021). Free-flow Carsharing Systems in a Spatio-temporal Urban Ecosystem: An Urban Informatics Approach. Zenodo. https://doi.org/10.5281/zenodo.6493824
Acknowledgments
The analyzed data were treated according to the GDPR-General Data Protection Regulation (EU, 2016/679). This research received no specific grant from any funding agency in the public, commercial, or not-for-profit sectors.
References
Bruglieri, M., Colorni, A., & Lue, A. (2014). The vehicle relocation problem for the one-way electric vehicle sharing: an application to the Milan case. Procedia-Social and Behavioral Sciences, 111, 18-27. https://doi.org/10.1016/j.sbspro.2014.01.034
Heilig, M., Mallig, N., Schröder, O., Kagerbauer, M., & Vortisch, P. (2018). Implementation of free-floating and station-based carsharing in an agent-based travel demand model. Travel Behaviour and Society, 12, 151-158. https://doi.org/10.1016/j.tbs.2017.02.002
Kek, A. G., Cheu, R. L., & Chor, M. L. (2006). Relocation simulation model for multiple-station shared-use vehicle systems. Transportation research record, 1986 (1), 81-88. https://doi.org/10.1177%2F0361198106198600111
Kortum, K. (2012). Free-floating carsharing systems: innovations in membership prediction, mode share, and vehicle allocation optimization methodologies. University of Texas at Austin. Available at: http://hdl.handle.net/2152/ETD-UT-2012-05-318
Leclerc, B., Trépanier, M., & Morency, C. (2013). Unraveling the travel behavior of carsharing members from global positioning system traces. Transportation research record, 2359 (1), 59-67. https://doi.org/10.3141%2F2359-08
Schmöller, S., & Bogenberger, K. (2014). Analyzing External Factors on the Spatial and Temporal Demand of Car Sharing Systems. Procedia-Social and Behavioral Sciences, 111, 8-17. https://doi.org/10.1016/j.sbspro.2014.01.033
Schmöller, S., Weikl, S., Müller, J., & Bogenberger, K. (2015). Empirical analysis of free-floating carsharing usage: The Munich and Berlin case. Transportation Research Part C: Emerging Technologies, 56, 34-51. https://doi.org/10.1016/j.trc.2015.03.008